in the population sciences published by the Max Planck Institute for Demographic Research Konrad-Zuse Str. 1, D-18057 Rostock · GERMANY www.demographic-research.org
DEMOGRAPHIC RESEARCH
VOLUME 22, ARTICLE 21, PAGES 635-662
PUBLISHED 16 APRIL 2010
http://www.demographic-research.org/Volumes/Vol22/21/ DOI: 10.4054/DemRes.2010.22.21
Research Article
Satisfaction with life as an antecedent of
fertility: Partner + Happiness = Children?
Nick Parr
© 2010 Nick Parr.
This open-access work is published under the terms of the Creative Commons Attribution NonCommercial License 2.0 Germany, which permits use, reproduction & distribution in any medium for non-commercial purposes, provided the original author(s) and source are given credit.
1 Overview 636
2 Literature review 637
3 Data and methods 641
4 Results 642
4.1 Variation in satisfaction with life 642
4.2 The effects of satisfaction with life and other variables on fertility 644
5 Conclusion 653
6 Acknowledgement 655
Satisfaction with life as an antecedent of fertility:
Partner + Happiness = Children?
Nick Parr1
Abstract
This paper examines the relationships between satisfaction with life in general, particular domains of life, the partner, and parental relationships with existing children, and subsequent fertility. The data are from 2,948 women and 2,622 men aged 15 to 44 years, from a longitudinal survey of the household population in Australia. For both sexes, a strong positive relationship between prior satisfaction with life and fertility two years later is found. Men’s satisfaction with their partner and with their partner’s relationship with existing children are positively related to fertility. Fertility is also related to age, parity, marital status, education, employment and birthplace.
1. Overview
Are people who are more satisfied (“happier”) with life more likely to have children? And are people who are happier with their partners more likely to have children? The literature on the interrelationship between fertility and an individual’s ordinal level of satisfaction with life (often termed subjective wellbeing) has tended to focus on the effect of having additional children on satisfaction with life (McLanahan and Adams 1987, 1989; Evenson and Simon 2005; Kohler et al. 2005). Except for Perelli-Harris (2006), the possibility of higher levels of satisfaction with life among parents having preceded the arrival of the children appears to have been overlooked.
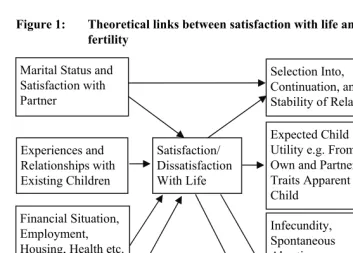
There is a range of theoretical reasons to expect those with higher levels of satisfaction with life to have higher fertility. First, the presence of a partner contributes to a person’s satisfaction with life, and also, obviously, would affect fertility (Evans and Kelley 2004; Zimmermann and Easterlin 2006; Carmichael and Whittaker 2007a, b). A person’s satisfaction with their partner would affect their satisfaction with life, and would affect their fertility through enhancing the stability and the likelihood of continuation of the union. Third, parents generally aspire to have happy children. If prospective parents are happy with life this may increase the likelihood that their children will be so, due to parent-to-child transmission of biological or social endowments. A perceived prospect of happier children in turn may heighten the fertility desire (Easterlin 2006). Furthermore, since a child will to some extent be in the image of his or her parents, adults who have a more positive view of themselves and of their partner may be more favourably disposed to their prospective offspring. Among those who have already had children, the satisfaction derived from those children will also have contributed to the overall level of satisfaction with life (Kohler et al. 2005). Parental experiences with existing children and the satisfaction they derive from these experiences differ widely and may affect parents’ desire for additional children (Newman 2008). Finally, depression and stress have been found to contribute to (as well as result from) reduced fecundity, and hence would contribute to reduced subsequent fertility (Abbey et al. 1992; Phillips and Slaughter 2000; Arck et al. 2001; Wisborg et al. 2008; Zemishlany and Weizman 2008). Figure 1 presents a diagrammatic representation of these relationships.
Figure 1: Theoretical links between satisfaction with life and subsequent fertility
Experiences and Relationships with Existing Children
Satisfaction/ Dissatisfaction With Life
Expected Child Utility e.g. From Own and Partner’s Traits Apparent in Child
Gives Birth to/Father’s (Additional) Child
Infecundity, Spontaneous Abortion, Still Birth, Libido, Sexual
Dysfunction
Contraceptive Use Marital Status and
Satisfaction with Partner
Biological and Social Endowments Financial Situation, Employment, Housing, Health etc.
Selection Into, Continuation, and Stability of Relationships
2. Literature review
traits). Fowler and Christakis (2008) have shown the happiness of one spouse tends to affect the happiness of the other. This may make the happier more desirable as partners. Fertility within unions and the continuation of unions may also be related to satisfaction with the partner and with life more generally. For example, Carmichael and Whittaker (2007a, b) document examples of men and women who were childless because they had never viewed their relationships as being with “the right person” or had become unhappy with relationships and who believed that having children would make it more difficult to search for a more satisfying relationship. The discontinuation of some unions may be due to the impairment of the relationship by one of the partners’ depression, anxiety or other personality traits (Kiernan 1986; Zimmermann and Easterlin 2006; Zemishlany and Weizman 2008).
A second reason that satisfaction with life may be an antecedent of fertility is that adults with differing levels of satisfaction with life may perceive the prospect of (additional) children differently; there may be “image of self” and “image of partner” effects. According to Billari and Kohler (2009), the additional happiness which parents anticipate would result from their having (additional) children is a key driver of childbearing decisions. I hypothesize on theoretical grounds that such “predicted happiness from childbearing” would be related to the current levels of satisfaction with life and satisfaction with the partner. The literature suggests that a person’s satisfaction with life reflects biological, personality and social endowments from their parents (Kohler et al. 2005; Easterlin 2006). Thus happier, better-adjusted adults might reasonably anticipate having happier, better-adjusted (and hence more desirable) children. Moreover, since a person’s level of satisfaction with life may be partly attributable to their satisfaction with their own personality and physical characteristics and with those of their partner, and since a child is likely to resemble (to some degree) his or her parents, the highly satisfied (or highly satisfied with partner) face the prospect of children with characteristics they might expect to find highly satisfying, whilst the less satisfied face the prospect of children with characteristics they might expect to find less satisfying.
additional time spent on the domestic work and parental childcare which results from children is borne mostly by the mother (Craig and Bittman 2004; Craig 2005).
As well as providing reasons to expect the more satisfied to have higher fertility, the literature also provides other reasons which might lead one to expect lower fertility among the more satisfied. According to Ramu (1984) and Carmichael and Whittaker (2007a) aversion to lifestyle change is one of the main types of justification the voluntarily childless cite for their remaining childless. If it may be presumed that those who do not wish to change their lifestyle tend to express high existing levels of satisfaction with life, then such high levels of subjective wellbeing might be expected to be associated with lower fertility (Ramu 1984). A second factor tending to produce a negative relationship between satisfaction and subsequent fertility is the experience of infant or child deaths, which would reduce satisfaction with life and may also lead to “replacement” fertility (Olsen 1980).
The well-established relationships between lower levels of satisfaction with life and infecundity or reduced fecundity provide a third set of reasons for expecting lower satisfaction with life to be an antecedent of lower fertility. Depression and antidepressant medications have been found to be causes of sexual dysfunction, reduced libido, and impaired interpersonal relationships (Phillips and Slaughter 2000; Zemishlany and Weizman 2008). Stress has also been identified as a trigger for spontaneous abortions and still births (Arck et al. 2001; Wisborg et al. 2008). This said, the interrelationship between infecundity and satisfaction with life is complex. In addition to being a determinant of fertility, infecundity has also been found to negatively affect life satisfaction, with this relationship being stronger among women who are not employed than among women who are employed (Bongaarts and Potter 1983; Abbey et al. 1992; McQuillan et al. 2007). However, where the birth of a child followed assisted reproduction, reduced parenting stress, more positive parent-child relationships, and a higher satisfaction with life have been found (Hahn 2001; McQuillan et al. 2007).
Contraceptive use is another proximate determinant which may also be related to psychological wellbeing. Increased rates of discontinuation of use of contraceptive injections and implants have been found among women with pre-initiation of use depressive symptoms, although this may be the due to their generally lower levels of satisfaction with their relationships (Westhoff et al. 1998 a, b). Moreover, fears that use of hormonal methods may affect mood may deter women from adopting these methods, and the depressive individual may be particularly sensitive to such fears.
literature provides numerous theoretical reasons to expect relationships between satisfaction with particular domains of life and fertility, there appears to be a dearth of studies which investigate such relationships empirically. Satisfaction with one’s financial situation may be important, since the reasons given by Australians for not having more children are often financial (Weston et al. 2004). Employment opportunities may be a consideration, since pregnancy and children may diminish opportunities to take advantage of them, particularly for women (Parr 2005). A person’s health has been found to be related both to their satisfaction with life and to fertility. Ryff et al. (2006) have shown that a person’s weight and waist-hip ratio have significant negative associations with their psychological well-being, and that a range of other biomarkers also indicates that higher psychological well-being is associated with a lower biological risk of ill health. Obese and overweight men have also been found to have reduced fecundity (Sallmén et al. 2006), and it is plausible the biomarkers Ryff et al. (2006) describe may also be related to the selection of individuals into unions, the continuation of unions, and fertility desires among those within unions. The home in which a person lives may also have ramifications for fertility: those in unsatisfactory living conditions may delay having additional children until they can move to more satisfactory housing or may forgo having them altogether (Felson and Solaun 1975; Bernadi 2005). In Australia house size would be an issue for those contemplating additional children (Newman 2008). The move towards higher density housing in Australia’s larger cities and increasingly delayed leaving of the parental home due to housing unaffordability and unavailability may thus affect fertility (Flateau et al. 2007). The prospect of moving away from a neighbourhood or local community with which one is dissatisfied may similarly lead to a postponement of some childbearing. Satisfaction with the availability of free time may also be a consideration in view of the reductions to such time use which result from additional children (Craig 2005, 2006). For example, Carmichael and Whittaker (2007a) present examples of people who rationalise their childlessness in terms of the extra free time they could enjoy without children.
both to expressed satisfaction with life and to fertility (Carmichael and McDonald 2003; Parr 2005, 2006). Moreover, the effects of age need to be controlled for, in view of the documented variation in life satisfaction with age and the variation in fertility with age (Easterlin 2006; ABS 2008).
This paper analyses the fertility of Australian women and men, paying particular attention to whether women and men who are more highly satisfied with life are more likely to subsequently have children. The relationship between satisfaction with life and fertility measured at the same point of time will be affected both by the processes through which past levels of satisfaction may have affected fertility and by the effects of the children on satisfaction with life (Kohler et al. 2005). However, the longitudinal structure of the data used allows the levels of satisfaction to be related to fertility at later points in time, thereby ensuring the observations of explanatory satisfaction-related variables cannot have been affected by the fertility response variable (i.e. reverse causality). In this respect the analysis differs from the overwhelming majority of the existing literature on the interrelationships between life satisfaction and fertility. The relationships with subsequent fertility of satisfaction with a range of particular domains in life, including the relationships with the partner and any existing children, the financial situation, employment, housing, health and free time, and with a range of demographic, socioeconomic and cultural variables are also assessed.
3. Data and methods
The data used are from the Household, Income and Labour Dynamics in Australia Survey (HILDA). Wave 1 of this nationwide, longitudinal survey was conducted in 2001, and subsequent waves on an annual basis. The sample design employed a multi-stage cluster sample of households. Remote areas of the country were not sampled (Watson and Wooden 2002a, b).
safe you feel”, “feeling part of the local community in which you live”, “your health”, “the neighbourhood in which you live”, and “the amount of free time you have” were also considered. A similarly-scaled measurement of “satisfaction with your partner” was collected from partnered men and women using a special self-completion module of the questionnaire. For those with children, questions were also asked on satisfaction with “your relationship with your children” and “your partner’s relationship with your children”.
The analysis was restricted to 2,948 women and 2,622 men who were aged 15 to 44 years last birthday one year before the Wave 5 interview and for whom a measurement of satisfaction with life was available from Wave 3. Separate analyses were performed for women and men in order to assess whether the interrelationships of fertility and satisfaction with life differed significantly between the sexes. The analyses incorporating measures of satisfaction with the partner were conducted on 1,290 married or cohabiting women and 1,084 married or cohabiting men. Additional analyses incorporating measures of the respondent’s satisfaction with their relationship with their children, and their satisfaction with their partner’s relationship with their children, were conducted on 857 women and 700 men who were either married or cohabiting, and who had at least one child. Since the response variable was binary, logistic regression was used. For reasons provided in the introduction, control variables include those for marital status, age, parity, education, income, employment, and birthplace.
4. Results
4.1 Variation in satisfaction with life
In general Australian women and men aged 15-44 report high levels of satisfaction with life (Headey and Wooden 2004). The mean score for women (7.93) was slightly above that for men (7.84). For each sex the modal value was 8 out of 10. Moreover, for each sex only 2.6 per cent rated their satisfaction with life below the scale’s natural mid-point of 5 (Table 1).
Those who are not employed have a lower mean satisfaction with life than those who are in employment, with the difference being slightly greater for men than for women. Both for men and for women the variations in satisfaction by highest level of education and by annual income are slight. Migrants tend to express lower levels of satisfaction with life than the Australia-born, with the difference from the Australia-born being somewhat wider for men born in Europe and for men in the “Other Overseas” birthplace category.
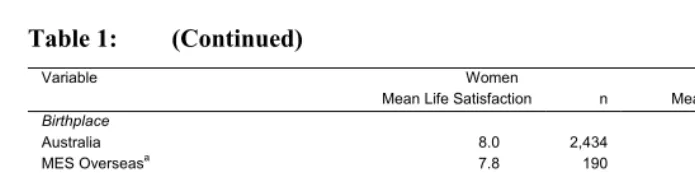
Table 1: Mean scores for satisfaction with life for men and women aged 15-44 by background variables
Variable Women Men
Mean Life Satisfaction n Mean Life Satisfaction n
Marital Status
Married 8.1 1,278 8.0 983
Cohabiting 8.0 413 7.8 354
Divorced, Separated or Widowed 7.3 283 7.3 173 Never Married and Not Cohabiting 7.9 974 7.8 1,112
Parity
0 8.0 1,355 7.9 1,513
1 7.9 403 7.9 326
2 7.8 666 7.8 466
3+ 8.0 524 7.7 317
Age at Start of Year
15 to 19 8.2 374 8.4 363
20 to 24 8.0 421 7.8 392
25 to 29 7.9 403 7.8 358
30 to 34 7.9 519 7.8 456
35 to 39 7.9 583 7.7 500
40 to 44 7.8 648 7.7 553
Highest Level of Education
Bachelors or Higher 7.9 677 7.8 476
Year 12 7.9 929 7.7 784
Below Year 12 8.0 1,342 7.9 1,362
Total Annual Income
Above 100,000 8.0 304 7.8 1,173
45,000-99,999 7.8 779 7.7 500
10,000-44,999 7.8 842 7.9 324
Below 10,000 8.1 726 8.1 380
Employment Status
Employed 8.0 1,978 7.9 2,198
Table 1: (Continued)
Variable Women Men
Mean Life Satisfaction n Mean Life Satisfaction n
Birthplace
Australia 8.0 2,434 7.9 2,188
MES Overseasa 7.8 190 7.7 201
Europeb 7.9 77 7.6 46
Asiac 7.8 171 7.8 102
Other Overseas 7.9 76 7.6 85
All 7.9 2,948 7.8 2,622
Source: HILDA Survey Combined Wave1-Wave 5 Data
a. Main English-Speaking overseas i.e. Canada, Ireland, New Zealand, South Africa, United Kingdom, United States Falkland Islands, British and New Zealand Antarctic Territories.
b. Excludes Ireland and United Kingdom. and includes French and Norwegian Antarctic Territories. c. Excludes Middle East.
d. Calculated from Wave 5 data for time point two years before Wave 5 interview (the recording of fertility in Wave 5 is more complete).
4.2 The effects of satisfaction with life and other variables on fertility
4.7 per cent of women in the 15 to 44 age range gave birth to a child in the year before their Wave 5 interview (Table 2). There is significant variation in fertility by the level of satisfaction with life expressed roughly two years earlier, with generally higher levels of fertility being associated with higher preceding levels of satisfaction with life. None of the 78 women whose life satisfaction was below the scale’s natural mid-point of 5 subsequently gave birth, whilst the percentages giving birth among women who rated their satisfaction with life at 9 or 10 are 51 per cent and 24 per cent respectively above the average for all women aged 15 to 44 years. Table 2 also shows the variation in the percentage of women who gave birth by marital status, parity, age, level of education, income, employment status and ethnicity as recorded at Wave 3.
Table 2: Percent who gave birth to or fathered a child in 12 months before wave 5 interview by satisfaction with life and background variables measured approximately two years earlier
Variable %women who gave birth n % men who fathered child n
Satisfaction With Life
0 to 4 0.0 78 0.0 68
5 5.5 109 0.0 89
6 0.6 161 4.1 196
7 3.8 579 3.5 550
8 3.9 941 4.9 865
9 7.1 736 6.4 578
10 5.8 344 6.5 276
Marital Status
Married 6.6 1,278 8.0 983
Cohabiting 7.3 413 6.8 354
Divorced, Separated or Widowed 2.8 283 4.6 173 Never Married and Not Cohabiting 1.6 974 1.3 1,112
Parityd
0 4.1 1,355 3.4 1,513
1 13.2 403 14.4 326
2 2.7 666 3.4 466
3+ 2.1 524 2.9 317
Age at Start of Year
15 to 19 2.1 374 0.1 363
20 to 24 4.0 421 2.8 392
25 to 29 10.9 403 8.9 358
30 to 34 8.3 519 9.2 456
35 to 39 3.8 583 5.0 500
40 to 44 0.6 648 2.2 553
Highest level of Education
Bachelors or Higher 7.1 677 9.0 476
Year 12 5.3 929 5.0 784
Below Year 12 3.1 1,342 3.1 1,362
Total Annual Income
Above 100,000 6.6 304 6.7 1,173
45,000-99,999 5.1 779 3.8 500
10,000-44,999 4.2 842 1.9 324
Below 10,000 3.6 726 2.4 380
Employment Status
Employed 4.2 1,978 5.3 2,198
Not Employed 5.7 970 1.7 424
Birthplace
Australia 4.9 2,434 4.7 2,188
MES Overseasa 3.7 190 5.9 201
Europeb 3.9 77 2.2 46
Asiac 2.3 171 2.0 102
Other Overseas 5.3 76 8.2 85
All 4.7 2,948 4.7 2,622
Source: HILDA Survey Combined Wave1-Wave 5 Data
a. Main English-Speaking overseas i.e. Canada, Ireland, New Zealand, South Africa, United Kingdom, United States Falkland Islands, British and New Zealand Antarctic Territories.
b. Excludes Ireland and United Kingdom. and includes French and Norwegian Antarctic Territories. c. Excludes Middle East.
Both for women and for men, the effect of satisfaction with life is positive and significant at the 5% level, even after controlling for a range of demographic, socioeconomic and cultural variables (Model 1 in Table 3 and Model 1 in Table 4). The size of the effect of satisfaction with life on fertility is slightly greater for men than for women, but not significantly so. The possibility of a nonlinear effect was tested for by consideration of a squared term but found to be insignificant. Model 2 (Table 3 and Table 4), which includes interaction effects between satisfaction with life and whether the respondent was in a married or cohabiting union, shows the strength of the effect of satisfaction with life on fertility was stronger among the partnered, and significantly so for women. Interaction effects with parity were also considered. However the differences in the strength of the effects of satisfaction with life by parity were not significant.
Model 3 (Tables 3 and 4) attempts to unpack the effects of satisfaction with life for the full samples of women and for men by testing for the effects of eight domains of life. However for both sexes and for each of these domains the effect of satisfaction with that domain of life was small and not statistically significant. Even when the variables representing satisfaction with domains of life are entered singly, as opposed to in combination, their effects are insignificant after the other variables in the model are controlled for.
Table 3: Logistic regressions of whether a woman gave birth to a child in 12 months before wave 5 interview
Model 1(All Women Aged 15-44, N = 2,948)
Model 2 (All Women Aged 15-44, N = 2,948)
Model 3 (All Women Aged 15-44, N = 2,948)
Variable β S. E. (β) β S. E. (β) β S. E. (β)
Satisfaction With Life 0.20** 0.08 -0.07 0.15 0.28** 0.12
Interaction Satisfaction with Life & Being in a Married/Cohabiting Partnership 0.37** 0.18
Satisfaction with Partner
Satisfaction with Relationship with Children Satisfaction with Partner’s Relationship with Children
Satisfaction with Home 0.01 0.06
Satisfaction with Employment Opportunities -0.02 0.05
Satisfaction with Financial Situation -0.04 0.06
Satisfaction with Safety 0.02 0.08
Satisfaction with Local Community -0.04 0.06
Satisfaction with Health 0.00 0.07
Satisfaction with Neighbourhood -0.01 0.07
Satisfaction with Free Time 0.01 0.05
Marital Status
Married 0.00 0.00 0.00
Cohabiting -0.53* 0.27 -0.53 1.45 -0.61** 0.28
Divorced, Separated or Widowed -0.17 0.40 2.69*f 1.42 -0.16 0.42
Never Married and Not Cohabiting -2.18*** 0.75f 1.45 -2.20*** 0.42
Parity
0 -0.89*** 0.27 -0.89*** 0.27 -0.95*** 0.27
1 0.00 0.00 0.00
2 -1.52*** 0.32 -1.54*** 0.32 -1.66*** 0.34
3+ -1.56*** 0.39 -1.58*** 0.39 -1.99*** 0.47
Agee
15 to 19 2.18** 0.92 2.31** 0.92 2.46** 1.01
20 to 24 2.70*** 0.69 2.71*** 0.69 2.80*** 0.81 25 to 29 3.12*** 0.63 3.12*** 0.63 3.30*** 0.75 30 to 34 2.63*** 0.62 2.62*** 0.62 2.91*** 0.74 35 to 39 1.84*** 0.63 1.84*** 0.63 2.22*** 0.75
40 to 44 0.00 0.00 0.00
Highest level of Education
Bachelors or Higher 0.44 0.29 0.46 0.29 0.50* 0.30
Year 12 0.37 0.26 0.39 0.26 0.40 0.27
Below Year 12 0.00 0.00 0.00
Incomed 0.02 0.01 0.02 0.01 0.02 0.02
Not Employed 0.56** 0.24 0.55** 0.24 0.55** 0.26
Birthplace
Australia 0.00 0.00 0.00
MES Overseasa -0.34 0.45 -0.34 0.45 -0.38 0.46
Europeb -0.51 0.75 -0.49 0.75 -1.28 1.05
Asiac -1.31** 0.62 -1.31** 0.62 -1.19** 0.62
Other Overseas 0.04 0.56 0.06 0.57 -0.34 0.65
Constant -6.09*** 0.95 -6.89*** 1.06 -6.33*** 1.11
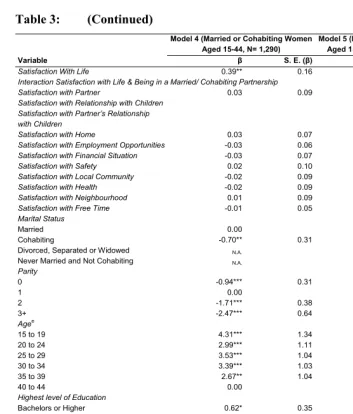
Table 3: (Continued)
Model 4 (Married or Cohabiting Women Aged 15-44, N= 1,290)
Model 5 (Married or Cohabiting Women Aged 15-44 with Children, N = 857)
Variable β S. E. (β) β S. E. (β)
Satisfaction With Life 0.39** 0.16 0.47** 0.22
Interaction Satisfaction with Life & Being in a Married/ Cohabiting Partnership
Satisfaction with Partner 0.03 0.09 0.01 0.15
Satisfaction with Relationship with Children 0.05 0.20
Satisfaction with Partner’s Relationship with Children
-0.01 0.17
Satisfaction with Home 0.03 0.07 0.08 0.10
Satisfaction with Employment Opportunities -0.03 0.06 0.09 0.08
Satisfaction with Financial Situation -0.03 0.07 -0.21* 0.10
Satisfaction with Safety 0.02 0.10 0.10 0.15
Satisfaction with Local Community -0.02 0.09 -0.01 0.10
Satisfaction with Health -0.02 0.09 0.00 0.11
Satisfaction with Neighbourhood 0.01 0.09 -0.09 0.12
Satisfaction with Free Time -0.01 0.05 0.02 0.07
Marital Status
Married 0.00 0.00
Cohabiting -0.70** 0.31 -0.37 0.49
Divorced, Separated or Widowed N.A. N.A
Never Married and Not Cohabiting N.A. N.A
Parity
0 -0.94*** 0.31 N.A
1 0.00 0.00
2 -1.71*** 0.38 -1.60*** 0.43
3+ -2.47*** 0.64 -2.11*** 0.698
Agee
15 to 19 4.31*** 1.34 3.43***g 1.23
20 to 24 2.99*** 1.11 3.43***g 1.23
25 to 29 3.53*** 1.04 3.84*** 1.08
30 to 34 3.39*** 1.03 2.71** 1.06
35 to 39 2.67** 1.04 1.95* 1.08
40 to 44 0.00 0.00
Highest level of Education
Bachelors or Higher 0.62* 0.35 1.39*** 0.49
Year 12 0.62* 0.33 0.90* 0.45
Below Year 12 0.00 0.00
Incomed 0.02 0.02 0.00 0.03
Not Employed 0.57* 0.30 0.62 0.38
Birthplace
Australia 0.00 0.00
MES Overseasa -0.22 0.49 -0.35 0.70
Europeb -0.94 1.07 -18.13 7308
Asiac -1.54** 0.76 -1.89* 1.09
Other Overseas 0.05 0.70 0.87 0.76
Constant -7.66*** 1.49 -9.29*** 2.20
-2 Log Likelihood 518.0 251.7
Table 3 Notes:
Survey Combined Wave1-Wave 5 Data
a. Main English-Speaking overseas i.e. Canada, Ireland, New Zealand, South Africa, United Kingdom, United States, Falkland Islands, British and New Zealand Antarctic Territories.
b. Excludes Ireland and United Kingdom. Includes French and Norwegian Antarctic Territories. c. Excludes Middle East.
d. Measured in A$10,000.
e. As at start of 12 months before Wave 5 interview.
f. The values of the coefficients of these variables in Model 2 are to be interpreted as extrapolations to the modelled levels when satisfaction with life is zero.
g. 15 to 19 and 20 to 24 merged because of small numbers in 15 to 19 *** p < 0.01, **0.01 ≤ p < 0.05, * 0.05 ≤ p < 0.01
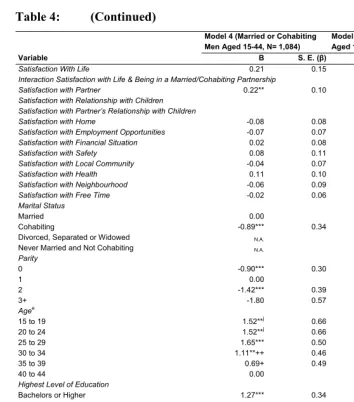
Among partnered men with one or more children, it is the level of satisfaction with the partner’s relationship with the children, as opposed to the relationship with the partner per se, which is the significant factor affecting fertility (Model 5 in Table 4). The coefficient for satisfaction with life remains positive and of similar magnitude after the introduction of these variables, but has a reduced level of significance. For partnered women with children neither the level of satisfaction with their own relationship with children nor their level of satisfaction with their partner’s relationship with the children has a significant effect (Model 5 in Table 3). For women the effect of satisfaction with life remains significant after controlling for the satisfaction with their own and their partner’s relationship with the children. For partnered women with children, the level of satisfaction with the financial situation has a significant negative relationship to subsequent fertility. This may reflect the budgetary constraints on having extra children being more readily apparent to those with children than to those without children.
partnered also contributes to the reduction of the size of the coefficient for females. For both sexes the effects of age resemble an inverted U-shape, with the peak in the 25 to 29 age group (Tables 3 and 4). However the contrast between the coefficients for 25 to 34 year olds and the baseline 40 to 44 year old group is significantly smaller for males than for females.
Table 4: Logistic regressions of whether a man fathered a child in 12 months before wave 5 interview
Model 1 (All Men Aged 15-44, N=2,622)
Model 2 (All Men Aged 15-44, N=2,622)
Model 3 (All Men Aged 15-44, N = 2,622)
Variable β S. E. (β) Β S. E. (β) β S. E. (β)
Satisfaction With Life 0.24*** 0.09 0.20 0.18 0.35*** 0.11
Interaction Satisfaction with Life & Being in a Married/Cohabiting Partnership 0.05 0.21
Satisfaction with Partner
Satisfaction with Relationship with Children Satisfaction with Partner’s Relationship with Children
Satisfaction with Home -0.08 0.06
Satisfaction with Employment Opportunities -0.06 0.06
Satisfaction with Financial Situation 0.00 0.06
Satisfaction with Safety 0.07 0.09
Satisfaction with Local Community -0.01 0.06
Satisfaction with Health 0.06 0.08
Satisfaction with Neighbourhood -0.10 0.07
Satisfaction with Free Time -0.05 0.05
Marital Status
Married 0.00 0.00 0.00
Cohabiting -0.79* 0.29 -0.79 0.29 -0.85*** 0.30
Divorced, Separated or Widowed 0.07 0.41 0.43f 1.71 0.06 0.41
Never Married and Not Cohabiting -2.25*** 0.41 -1.89f 1.71 -2.18*** 0.41
Parity
0 -0.79*** 0.26 -0.79*** 0.26 -0.70*** 0.26
1 0.00* 0.00 0.00
2 -1.40*** 0.33 -1.40 0.33 -1.35*** 0.33
3+ -1.56*** 0.44 -1.56*** 0.44 -1.50*** 0.44
Agee
15 to 19 0.47 0.90 0.50 0.90 0.45 0.90
20 to 24 1.30** 0.54 1.30** 0.53 1.15** 0.54
25 to 29 1.63***++ 0.42 1.63***++ 0.42 1.48***+ 0.43 30 to 34 1.34***+ 0.38 1.34***+ 0.38 1.28***++ 0.39 35 to 39 0.88** 0.39 0.88** 0.39 0.87**+ 0.40
40 to 44 0.00 0.00 0.00
Highest Level of Education
Bachelors or Higher 0.94***+ 0.27 0.94***+ 0.27 0.93*** 0.28
Year 12 0.32 0.27 0.32 0.27 0.38 0.27
Below Year 12 0.00 0.00 0.00
Incomed -0.02++ 0.01 -0.02++ 0.01 -0.02+ 0.01
Not Employed -0.14 0.44 -0.14 0.44 -0.30 0.49
Birthplace
Australia 0.00 0.00 0.00
MES Overseasa 0.01 0.35 0.01 0.35 0.08 0.35
Europeb -0.78 1.07 -0.78 1.07 -0.85 1.08
Asiac -1.19 0.75 -1.18 0.75 -1.09 0.75
Other Overseas 0.62 0.45 0.62 0.45 0.68 0.46
Constant -4.55*** 0.85 -4.64*** 0.95 -4.35***+ 0.94
Table 4: (Continued)
Model 4 (Married or Cohabiting Men Aged 15-44, N= 1,084)
Model 5 (Married or Cohabiting Men Aged 15-44 with Children, N= 700)
Variable Β S. E. (β) β S. E. (β)
Satisfaction With Life 0.21 0.15 0.20 0.21
Interaction Satisfaction with Life & Being in a Married/Cohabiting Partnership
Satisfaction with Partner 0.22** 0.10 0.06 0.17
Satisfaction with Relationship with Children 0.02 0.23
Satisfaction with Partner’s Relationship with Children 0.51*+ 0.26
Satisfaction with Home -0.08 0.08 -0.16+ 0.11
Satisfaction with Employment Opportunities -0.07 0.07 -0.05 0.10
Satisfaction with Financial Situation 0.02 0.08 -0.06 0.11
Satisfaction with Safety 0.08 0.11 0.20 0.15
Satisfaction with Local Community -0.04 0.07 -0.09 0.10
Satisfaction with Health 0.11 0.10 0.13 0.14
Satisfaction with Neighbourhood -0.06 0.09 -0.08 0.13
Satisfaction with Free Time -0.02 0.06 -0.05 0.08
Marital Status
Married 0.00 0.00
Cohabiting -0.89*** 0.34 -0.68 0.53
Divorced, Separated or Widowed N.A. N.A.
Never Married and Not Cohabiting N.A. N.A.
Parity
0 -0.90*** 0.30 N.A.
1 0.00 0.00
2 -1.42*** 0.39 -1.58*** 0.45
3+ -1.80 0.57 -1.88*** 0.65
Agee
15 to 19 1.52**j 0.66 0.09g++ 1.03
20 to 24 1.52**j 0.66 0.09g++ 1.03
25 to 29 1.65*** 0.50 1.72***+ 0.63
30 to 34 1.11**++ 0.46 0.24++ 0.58
35 to 39 0.69+ 0.49 0.55 0.56
40 to 44 0.00 0.00
Highest Level of Education
Bachelors or Higher 1.27*** 0.34 1.81*** 0.51
Year 12 0.65* 0.33 1.17** 0.46
Below Year 12 0.00 0.00
Incomed -0.02++ 0.02 -0.06**+ 0.03
Not Employed 0.58 0.57 0.85 0.80
Birthplace
Australia 0.00 0.00
MES Overseasa 0.11 0.42 -0.68 0.81
Europeb -18.64 8437 -19.00 9785
Asiac -1.56 1.05 -1.21 1.12
Other Overseas 0.45 0.63 1.40* 0.76
Constant -6.09*** 1.32 -8.49*** 2.27
-2 Log Likelihood 467.4 231.4
Table 4 Notes:
Source: HILDA Survey Combined Wave1-Wave 5 Data
a. Main English-Speaking overseas i.e. Canada, Ireland, New Zealand, South Africa, United Kingdom, United States, Falkland Islands, British and New Zealand Antarctic Territories.
b. Excludes Ireland and United Kingdom. Includes French and Norwegian Antarctic Territories. c. Excludes Middle East.
d. Measured in A$10,000.
e. As at start of 12 months before Wave 5 interview.
f. The values of the coefficients of these variables in Model 2 are to be interpreted as extrapolations to the modelled levels when satisfaction with life is zero.
g. 15 to 19 and 20 to 24 merged because of small numbers in 15 to 19. *** p < 0.01, **0.01 ≤ p < 0.05, * 0.05 ≤ p < 0.01
For significance of difference between coefficient for males and coefficient for females +++ p < 0.01, ++0.01 ≤ p < 0.05, + 0.05 ≤ p < 0.01
Women who were not in paid employment at the time of Wave 3 have significantly higher fertility than those who were employed at this time, whereas for men the effect of being employed is not significant (Table 3). The lower fertility of employed women may reflect the prospective “indirect costs” (i.e. loss of income), childcare costs, and time-related pressures which they would incur through having children (Chapman et al. 2001; Breusch and Gray 2004; Craig 2006; Parr et al. 2007; Parr 2009). For both sexes the p-value of the effect of individual income on fertility is just above 0.1, except for partnered men with children. Migrants generally have lower fertility than the Australia-born, with the fertility of women who were born in Asia being significantly lower than that of their Australia-born counterparts (Table 3).
5. Conclusion
The main finding of this paper is that, both for women and for men, an increased level of satisfaction with life is followed by a significantly greater propensity to have children. The title of Kohler et al.’s 2005 paper poses the question; “partner + children = happiness?”. The main finding of this paper, together with the higher fertility of the partnered, the positive interaction effect between being partnered and satisfaction with life, and the higher fertility of those who express higher levels of satisfaction with the partner would seem to support a different equation; partner + happiness = children.
2000; Arck et al. 2001; Wisborg et al. 2008; Zemishlany and Weizman 2008). This study also finds those who are highly satisfied with life (9 or 10 out of 10) have considerably higher than average subsequent rates of fertility. According to McDonald (2002) risk aversion theory posits that men and women may refrain from having additional children, because there is a possibility that doing so may adversely affect their lives. Such risk aversion is epitomised by Ramu’s (1984) summary of the justifications given by voluntarily childless Canadians for their not wanting children as “life has been very good without children: and we don’t even want to find out whether it would have been better or worse without them” (see also Carmichael and Whittaker 2007a). A decline in satisfaction with life would appear to be one of the risks associated with having children, particularly since parenthood has been found to be associated with higher levels of depression among adults (Evenson and Simon 2005). Since there is little or no scope for them to raise their satisfaction with life through having additional children, and considerable scope for reduction, logic would suggest that, were they egocentric, the highly satisfied would have more reason to be averse to risks to their happiness which having (more) children may bring. However the evidence in this paper is that their behaviour is quite the opposite. That highly satisfied people are more likely to subsequently have children may point the importance of an altruistic motive for parenthood, with their biological or social endowment of future children with their traits being a higher priority than any risk that children may be detrimental to their own high pre-child sense of wellbeing. It may point to their confidence in the resilience of these high levels of satisfaction post childbirth. In view of the disproportionate representation of those with very high prior levels of satisfaction with life among those having children, “ceiling effects” may affect the assessment of pre to post child levels of satisfaction.
Some of the raw differences in fertility between people with differing levels of satisfaction with life are attributable to differences in their demographic and socioeconomic characteristics. The more highly satisfied are disproportionately found among certain groups with higher fertility. In particular they are disproportionately drawn from women and men in marital or cohabiting unions, and from men who are employed. As discussed earlier, it is plausible that there is a selection of the happier into partnerships. However it also appears likely that the higher satisfaction resulting from continuing marital or cohabiting partnerships explains part of the correlation between life satisfaction and fertility. It should be noted that not all the groups with higher levels of satisfaction with life also have high fertility. In particular, employed women and both men and women aged 15 to 19 have high levels of satisfaction with life and, also, low fertility.
Some of this is due to the correlations of satisfaction with the partner and with the parents’ relationships with existing children with both satisfaction with life and subsequent fertility. However, particularly for women, significant effects remain after controlling for these factors. It is interesting to note that the strength of the relationships between satisfaction with the partner and with the partner’s relationship with existing children and subsequent fertility are noticeably stronger when reported by male partners about female partners than vice versa. This may reflect that, despite some change over time, the additional domestic work and parental childcare resulting from children continues to be undertaken disproportionately by Australian women (Craig and Bittman 2004; Craig 2005). The statistical association between satisfaction with life and fertility may, of course, also be affected by unmeasured variables, which may affect both satisfaction with life and fertility, for example unmeasured personality and attitudinal traits, and the strength of support from social networks (Ryff 1989; Bühler and Philipov 2005). For this reason, further research which can control for such variables and research focusing on qualitative aspects of men’s perceptions of their partner and their partner’s relationship with her children and how such perceptions affect fertility desires is needed.
6. Acknowledgement
References
Abbey, A., Andrews, F.M., and Halman, J. (1992). Infertility and subjective well-being: The mediating roles of self-esteem, internal control and interpersonal conflict. Journal of Marriage and the Family 54(2): 408-417. doi:10.2307/353072. Arck, P.C., Rose, M., Hertwig, K., Hagen, E., Hildebrandt, M., and Klapp, B.F. (2001).
Stress and immune mediators in miscarriage. Human Reproduction 16(7): 1505-1511. doi:10.1093/humrep/16.7.1505.
Australian Bureau of Statistics (2006). Pregnancy and Employment Transitions, Australia. Canberra: Commonwealth of Australia. (Catalogue Number. 4913.0). http://www.abs.gov.au.
Australian Bureau of Statistics (2008). Births 2007. Canberra: Commonwealth of Australia. (Catalogue Number. 3301.0). http://www.abs.gov.au.
Baird, M. (2005). Who’s rocking the baby? Making the Link 8: 32-38.
Bernadi, F. (2005). Public policies and low fertility: Rationales for public intervention and a diagnosis for the Spanish case. Journal of European Social Policy15(2): 123-138. doi:10.1177/0958928705049160.
Billari, F.C. and Kohler, H.-P. (2009). Fertility and happiness in the XXI century: Institutions, preferences, and their interactions. Paper presented at the XXVI IUSSP International Population Conference in Marrakech, Morocco, 27 September - 2 October, 2009.
Bongaarts, J. and Potter, R.G. (1983). Fertility, Biology and Behavior. New York: Academic Press.
Breusch, T. and Gray, E. (2004). New estimates of mothers’ forgone earnings using HILDA data. Australian Journal of Labour Economics 7(2): 125-150.
Broderick, E. (2008). Small business needs to think big about paid maternity leave. Sydney Morning Herald 18 June 2008: 11.
Bühler, C. and Philipov, D. (2005). Social capital related to fertility: Theoretical foundations and empirical evidence from Bulgaria. Vienna Yearbook of Population Research 2005: 53-81. doi:10.1553/populationyearbook2005s53. Carmichael, G.A. (1998). Things ain’t what they used to be! Demography, mental
Carmichael, G.A. and McDonald, P. (2003). Fertility trends and differentials. In: Khoo, S.E. and McDonald, P. (eds.). The Transformation of Australia's Population: 1970-2030. Sydney: UNSW Press: 40-76.
Carmichael, G.A. and Whittaker, A. (2007a). Choice and circumstance: Qualitative insight into contemporary childlessness in Australia. European Journal of Population 23(2): 111-143. doi:10.1007/s10680-006-9112-4.
Carmichael, G.A. and Whittaker, A. (2007b). Forming relationships in Australia over the generations: Qualitative insights into a process important to human wellbeing. Journal of Population Research 24(1): 23-49.
doi:10.1007/BF03031877.
Carroll, N. (2007). Unemployment and psychological well-being. Economic Record 83(262): 287-302. doi:10.1111/j.1475-4932.2007.00415.x.
Chapman, B., Dunlop, Y., Gray, M., Liu, A., and Mitchell, D. (2001). The impact of children on the lifetime earnings of Australian women: Evidence from the 1990s. Australian Economic Review 34(4): 373-389.
doi:10.1111/1467-8462.00207.
Craig, L. (2005). Does father’s care mean father’s share? Gender and Society 20(2): 259-281. doi:10.1177/0891243205285212.
Craig, L. (2006). How employed mothers in Australia find time for both market work and childcare. Journal of Family and Economic Issues 28(1): 69-87.
doi:10.1007/s10834-006-9047-2.
Craig, L. and Bittman, M. (2004). The effect of children on adult’s time-use: analysis of the incremental time costs of children in Australia. Paper presented at the Conference on Cross National Comparisons of Expenditures on Children at Princeton. New Jersey, USA, 8-9 January, 2004.
Easterlin, R.A. (2006). Life cycle happiness and its sources: Intersections of psychology, economics, and demography. Journal of Economic Psychology 27(4): 463-482. doi:10.1016/j.joep.2006.05.002.
Evans, M.D.R. and Kelley, J. (2004). Effect of family structure on life satisfaction: Australian evidence. Social Indicators Research 69(3): 303-349.
doi:10.1007/s11205-004-5578-9.
Evenson, R.J. and Simon, R.W. (2005). Clarifying the relationship between parenthood and depression. Journal of Health and Social Behavior 46(4): 341-358.
Felson, M. and Solaun, M. (1975). The fertility-inhibiting effect of crowded apartment living in a tight housing market. The American Journal of Sociology 80(6): 1410-1427. doi:10.1086/225997.
Flateau, P., James, I., Watson, R., Wood, G., and Hendershott, P.H. (2007). Leaving the parental home in Australia: Evidence from the Household, Income and Labour Dynamics in Australia (HILDA) Survey. Journal of Population Research 24(1): 51-71. doi:10.1007/BF03031878.
Fowler, J.H. and Christakis, N.A. (2008). Dynamic spread of happiness in a large social network: Longitudinal analysis over 20 years in the Framlington Heart Study. British Medical Journal 337: a2338. doi:10.1136/bmj.a2338.
Hahn, C.S. (2001). Review: Psychosocial well-being of parents and their children born after assisted reproduction. Journal of Pediatric Psychology 26(8): 525-538.
doi:10.1093/jpepsy/26.8.525.
Headey, B., Muffels, R., and Wooden, M. (2008). Money does not buy happiness: Or does it? A reassessment based on the combined effects of wealth, income and consumption. Social Indicators Research 87(1): 65-82.
doi:10.1007/s11205-007-9146-y.
Headey, B. and Wooden, M. (2004). The effects of wealth and income on subjective well-being and ill-being. Economic Record 80(S1): S24-S33.
doi:10.1111/j.1475-4932.2004.00181.x.
Heard, G. (2008). Partnership at the 2006 census: Preliminary findings. People and Place 16(1): 31-39.
Kiernan, K. (1986). Teenage marriage and marital breakdown: A longitudinal study. Population Studies 40(1): 35-54. doi:10.1080/0032472031000141826.
Kippen, R. (2004). Declines in first and second birth rates and their effects on levels of fertility. People and Place 12(1): 27-36.
Kohler, H.-P., Behrman, J.R., and Skytthe, A. (2005). Partner + children = Happiness? The effects of partnerships and fertility on happiness. Population and Development Review 31(3): 407-445. doi:10.1111/j.1728-4457.2005.00078.x. Lesthaeghe, R. (1995). The Second Demographic Transition in Western countries: An
interpretation. In: Mason, K.O. and Jensen, A. (eds.). Gender and family change in industrialized countries. Oxford: Clarendon Press: 17-62
McLanahan, S. and Adams, J. (1987). Parenthood and psychological well-being. Annual Review of Sociology 13(5): 237-257.
doi:10.1146/annurev.so.13.080187.001321.
McLanahan, S. and Adams, J. (1989). The effects of parenthood on adults’ psychological well-being: 1957-1976. Social Forces 68(1): 59-85.
McQuillan, J., Torres Stone, R.A., and Greil, A.L. (2007). Infertility and life satisfaction among women. Journal of Family Issues 28(7): 955-981.
doi:10.1177/0192513X07300710.
Newman, L. (2008). How parenthood experiences influence desire for more children in Australia: A qualitative study. Journal of Population Research 25(1): 1-27.
doi:10.1007/BF03031938.
Olsen, R.J. (1980). Estimating the effect of child mortality on the number of births. Demography 17(4): 429-443. doi:10.2307/2061155.
Parr, N.J. (2005). Family background, schooling and childlessness in Australia. Journal of Biosocial Science 37(2): 229-243. doi:10.1017/S0021932004006546.
Parr, N. (2006). Do children from small families do better? Journal of Population Research 23(1): 1-25. doi:10.1007/BF03031865.
Parr, N. (2007). Which women stop at one child in Australia. Journal of Population Research 24(2): 207-225. doi:10.1007/BF03031931.
Parr, N. (2009). Childlessness among men in Australia. Population Research and Policy Review. doi:10.1007/s11113-009-9142-9.
Parr, N., Ferris, S., and Mahuteau, S. (2007). The impact of children on Australian women’s and men’s superannuation. Economic and Labour Relations Review 18(1): 3-26.
Perelli-Harris, B. (2006). The influence of informal work and subjective well-being on childbearing in post-Soviet Russia. Population and Development Review 32(4): 729-753. doi:10.1111/j.1728-4457.2006.00148.x.
Phillips, R.L. and Slaughter, J.R. (2000). Depression and sexual desire. American Family Physician 62(4): 782-786.
Ryff, C.D. (1989). Happiness is everything or is it? Explorations on the meaning of psychological well-being. Journal of Personality and Social Psychology 57(6): 1069-1081. doi:10.1037/0022-3514.57.6.1069.
Ryff, C.D., Love, G.D., Urry, H.L., Muller, D., Rosenkranz, M.A., Friedman, E.M., Davidson, R.J., and Singer, B. (2006). Psychological well-being and ill-being: Do they have distinct or mirrored biological covariates? Psychotherapy and Psychosomatics 75(2): 85-95. doi:10.1159/000090892.
Sallmén, M., Sandler, D.P., Hoppin, J.A., Blair, A., and Baird, D.D. (2006). Reduced fertility among overweight and obese men. Epidemiology 17(5): 520-523.
doi:10.1097/01.ede.0000229953.76862.e5.
Van de Kaa, D. (1997). Options and sequences: Europe’s demographic patterns. Journal of Population Research 14(1): 1-29. doi:10.1007/BF03029484.
Vikat, A., Thomson, E., and Hoem, J.M. (1999). Stepfamily fertility in contemporary Sweden: The impact of childbearing before the current union. Population Studies 53(2): 211-225. doi:10.1080/00324720308082.
Vikat, A., Thomson, E., and Prskawetz, A. (2004). Childrearing responsibility and stepfamily fertility in Finland and Austria. European Journal of Population 20(1): 1-21. doi:10.1023/B:EUJP.0000014536.56286.41.
Waldfogel, J., Higuchi, Y., and Abe, M. (1999). Family leave policies and women’s retention after childbirth: Evidence from the United States, Britain, and Japan. Journal of Population Economics 12(4): 523-545. doi:10.1007/s001480050112. Watson, N. and Wooden, M. (2002a). The Household, Income and Labour Dynamics
in Australia (HILDA) Survey: Wave 1 survey methodology. (Hilda Project Technical Paper Series No 1/02). http://www.melbourneinstitute.com/hilda/. Watson, N. and Wooden, M. (2002b). Assessing the quality of the HILDA Survey
Wave 1 Data. (Hilda Project Technical Paper Series No 4/02). http://www.melbourneinstitute.com/hilda/.
Westhoff, C., Truman, C., Kalmuss, D., Cushman, L., Davidson, A., Rulin, M., and Heartwell, S. (1998a). Depressive symptoms and Depo-Provera. Contraception 57(4): 237-240. doi:10.1016/S0010-7824(98)00024-9.
Weston, R., Qu, L., Parker, R., and Alexander, R. (2004). It’s not for lack of wanting kids…: A report on the Fertility Decision Making Project. Melbourne: Australian Institute of Family Studies (Research Report No. 11).
Wisborg, K., Barklin, A., Hedegaard, M., and Henriksen, T.B. (2008). Psychological stress during pregnancy and stillbirth: Prospective study. BJOG an International Journal of Obstetrics and Gynaecology 115(7): 882-885.
doi:10.1111/j.1471-0528.2008.01734.x.
Zemishlany, Z. and Weizman, A. (2008). The impact of mental illness on sexual disfunction. Advances in Psychosomatic Medicine 29: 89-106.
doi:10.1159/000126626.