Patron: Her Majesty The Queen Rothamsted Research Harpenden, Herts, AL5 2JQ Telephone: +44 (0)1582 763133 Web: http://www.rothamsted.ac.uk/
Rothamsted Research is a Company Limited by Guarantee Registered Office: as above. Registered in England No. 2393175.
Rothamsted Repository Download
A - Papers appearing in refereed journals
Warren, R. G. and Cooke, G. W. 1962. Comparisons between methods
of measuring soluble phosphorus and potassium in soils used for fertilizer
experiments on sugar beet. The Journal of Agricultural Science. 59 (2),
pp. 269-274.
The publisher's version can be accessed at:
•
https://dx.doi.org/10.1017/S0021859600015306
The output can be accessed at:
https://repository.rothamsted.ac.uk/item/96y48/comparisons-between-methods-of-
measuring-soluble-phosphorus-and-potassium-in-soils-used-for-fertilizer-experiments-on-sugar-beet
.
© Please contact [email protected] for copyright queries.
Printed in Great Britain
269
Comparisons between methods of measuring soluble phosphorus and
potassium in soils used for fertilizer experiments on sugar beet
BY R. G. WARREN AND G. W. COOKE Rothamsted Experimental Station, Harpenden, Herts
(Received 24 April 1962)
Between 1933and 1949thelateDrE.M. Crowther directed a large series of field experiments on manuring of sugar beet. The series was done under the auspices of the Sugar Beet Research and Education Committee; the staff of the British Sugar Corporation did most of the field work. Boyd, Garner & Haines (1957) described the experiments and summarized the effects of the fertilizers on yield. The experiments were also planned to see whether soil analyses could forecast responses of crops to fertilizers. Samples taken from sites before the fertilizers were applied were analysed for 'available' P and K by several methods commonly used when the work began. The relationships between the responses of the crops to fertilizers, and the values for soluble soil P and K, were used by Crowther to find a numerical basis for valuing soil analysis and comparing alternative methods. His results reported to the Sugar Beet Research and Education Committee, but not published, are the basis of this paper. Although the experiments were completed 15 years ago, the way of testing soil analysis and comparing methods developed by Crowther is still relevant and no better basis has been found since.
Extracting soils with conventional solvents rarely dissolves well-defined chemical forms of P and K, and the methods must be checked and cali-brated by field experiments testing fertilizers on crops grown on the soils that are analysed. Until this work on sugar beet began there had not been a set of field experiments in Britain suitable for com-paring alternative methods of analysis; Crowther suggested that so many methods existed because of the lack of an objective way of assessing their efficiencies. Almost all of the common methods of analysis can pick out as 'acutely-deficient' those fields of ploughed-up grass or neglected arable land where crops fail without superphosphate or muriate of potash. Such poor fields are rarely used for sugar beet which is grown on the better arable soils; there-fore the range of soil fertility studied is narrow and chemists' problems are correspondingly difficult. A large series of fertilizer experiments of good design then must be used and even the comparisons may not
be very accurate. On some individual fields, season, or local soil conditions, prevent an expected response, alternatively they may magnify benefits from early improvement in growth from placement effects on soils not particularly deficient in the nutrient tested.
ANALYTICAL METHODS
The following solvents were used to extract P andK:
Hydrochloric acid. 3 g. of soil was shaken with 7 ml. of 0-3N-HC1 (pH 0-5) for 1 min.
Citric acid (a method based on the original method of Dyer (1894)). 10 g. of soil was shaken (end-over-end) with 100 ml. of 1 % citric acid solution (pH 2-2) for 24 hr. When soil with more than 1 % CaCO3 was extracted, 2 mol. of extra citric acid was added per 3 mol. of CaCO3, except in the last few years when an equimolecular amount was added.
Acetic acid. 6-25 g. of soil was leached with 250 ml. of 0-5N acetic acid (pH 2-6).
Water. Dirks & Scheffer's (1928) method used CO2-free water to extract soils of pH 6-4 or less. 30 g. of soil was extracted with 75 ml. of water. For soils with higher pH values 2-5 ml. 0-04M-H2CO3and 0-33 g. CaCO3 were used per gram.
Two methods were used to extract P only: Sulphuric acid (Truog, 1930). 2 g. of soil was shaken for 30 min. with 400 ml. of 0-002 N-H2SO4
containing 3 g. ammonium sulphate per litre; pH was adjusted to 3'0.
Lactate solution (the method developed by Egner, Kohler & Nydahl (1938)). 250 ml. of a mixture of 0-02M calcium lactate with OOIM-HCI atpH 3-7 was shaken with 5 g. of soil for 2 hr. For calcareous soils 1 g. of soil was shaken with 250 ml. of lactate solu-tion and the results were adjusted for the change in soil: solvent ratio with the factor given by Egner et al.
270
R. G. WARREN AND G. W. COOKE Except for the citric acid method, no treatmentwas given to the filtered extract before determining the phosphorus colorimetrically with ammonium molybdate and stannous chloride. For soils from the first four years of the experiments the citric acid in an aliquot of the extract was destroyed by ignition. The residue was extracted with hot dilute sulphuric acid and the phosphorus determined gravimetrically as ammonium phospho-molybdate by the Lorenz method. Subsequently the colori-metric method was used after destroying citric acid. Potassium was determined as cobaltinitrite, except in the citric acid extracts of soils from experi-ments in a few early years when the perchloric acid method was used. The cobaltinitrite precipitates from the citric acid, acetic acid, and Dirks and Scheffer's methods were determined by titrating with potassium permanganate until 1942; later they were measured turbidimetrically with a Spekker absorptiometer. The potassium extracted by the hydrochloric acid method was determined turbidimetrically for all soils by visual comparison with a set of standardized turbidity disks.
SOILS USED
The field experiments were in the sugar-beet growing areas of England and Scotland, mostly in the Eastern Counties. The sites were sampled before fertilizer treatments were applied, and the soils air dried, ground, and sieved; analyses were done on the < 2 mm. fraction. As sugar beet is sensitive to acidity, few soils had pH values (in water) below 6. The comparison of crop responses and soil analyses reported here is for experiments done from 1936 to 1946; sites on peat fens, and on soils with more than
5 % CaCO3, were excluded from the phosphate
comparisons, as interpreting analyses on these kinds of soils is unduly complicated. There were 216 experiments suitable for comparing methods of measuring soluble P, and 248 for examining methods for soluble K.
RESULTS
Crop responses
The experiments had factorial designs and all tested ammonium sulphate, superphosphate and muriate of potash; about half of the whole series (all experiments from 1940 onwards) tested agricultural salt (NaCl), and borax was tested in some of the later experiments. The effects of P and K fertilizers were expressed as the increases in yield given by 1-0 cwt. P2O6 and by 1-2 cwt. K2O/acre respectively
(effects of P stated here were averaged over other treatments; the effects of K listed were measured on plots receiving N but no salt and were averaged over the phosphate test). The sites were representative of
the sugar beet-growing areas, both in kinds of soil and in levels of fertility; there were rich as well as medium and poor soils, and there were negative as well as positive effects from the fertilizers tested. Table 1 shows the frequencies of responses of different sizes through the whole series of experi-ments. The mean increases in yield were 1-7 cwt. sugar/acre from superphosphate, and 3-0 cwt. sugar/acre from muriate of potash. The response to P exceeded 4 cwt./acre of sugar in only 35 of 216 experiments, whereas this level of gain was obtained from K in 70 of 248 experiments.
Average crop responses to fertilizers in groups of experiments arranged by soil analysis
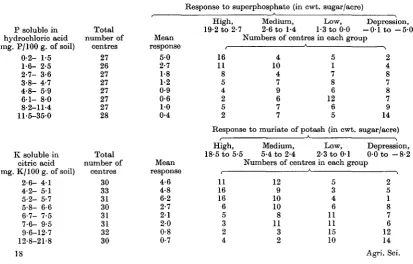
A common way of comparing crop responses with soil analyses is to separate a series of experiments into groups by arbitrarily-chosen ranges of values for soluble P or K; this may be misleading when, as usually happens, the groups contain unequal numbers of soils. Often some groups contain a few experiments only and one or two anomalous soils may lead to bad correlations between analyses and crop responses. The treatment used here avoids this difficulty by arranging the experiments by soil analyses in groups of similar numbers. The responses to P and K were divided into four equally frequent groups; Table 2 gives examples of the results; the frequency tables show numbers of centres in each response group for each soil analysis group, the hydrochloric acid method for P and the citric acid method for K were chosen. The ' sharpness' of the groups (i.e. the absence of many highly responsive centres with 'high' analytical values, and of many centres with 'low' analytical values where no responses were obtained) values the analytical methods qualitatively. The tables divide into three main regions; at the extremes, with ' low' and' high' analytical values, there are clear selections of
Table 1. The frequencies of the effects of phosphorus
and potassium fertilizers on yields of sugar beet
Numbers of effects Size of response
(cwt. of sugar/acre)
Over 8 1 8-0-41 4-0-01
0 0 - 3-9 4-0- 7-9 8-0-11-9 12-0-15-9 16-0 and over Total numbers of
experiments
From phosphate Depressions
0 2 57
Increases
122 26 5 2 2 216
From potash
1 11 65
101.
responsive and unresponsive sites respectively, but the middle regions of the tables contain many centres where the responses were of all sizes. The most successful methods have fewest centres in the middle region of the table. Inspecting the whole series of frequency tables (of which Table 2 is only a small part), showed that all methods selected many of the responsive and unresponsive centres, but the ' best' methods could not be distinguished by any numerical process. *
The first two lines in Table 2 represent the soils with least soluble P and contain 73 centres alto-gether; at 41 of these, manuring with superphos-phate would have paid at 1946 prices and there were only 12 where the phosphate would have been wasted. The soils richest in soluble P are in the two lowest lines of Table 2; out of these 55 centres super-phosphate manuring was unprofitable on 34 soils, on 14 soils it gave a small profit, and on 7 other fields that were 'rich' in HCl-soluble P superphosphate gave large and very profitable increases in yield. When this method of soil analysis was used to recommend phosphate manuring, within the group of soils with 'low' soluble-P there was a 41 to 12 (roughly 7 to 2) chance of making a profit from using superphosphate; but within the group with 'high' soluble P was a 21 to 34 (or 3 to 5) chance of making a loss by using analysis to recommend that no P fertilizer should be used. Every method of analysis showed as ' deficient' some soils where beet
failed to respond to superphosphate, and also gave a group of soils 'high' in soluble P containing some centres where superphosphate manuring was very profitable. The crop responses were usually asso-ciated with standard errors of about 2 cwt./acre of sugar; many of the smaller responses were therefore significant at the levels of probability generally accepted. An occasional high response may have arisen entirely by chance but even when the inevi-table errors associated with field experiments, and with soil sampling, are allowed for, each of the methods of soil analysis was badly misleading in a small proportion of the fields used. In practice most sugar beet receives phosphate and the total gains from using the analytical methods tested here to select fields for P manuring would not be great. In groups of soils with 'high' soluble P (or K), the recommendation to withhold fertilizer saves the cost of the dressing on most fields, but these gains are largely offset by the much larger losses (per acre) that result from not giving fertilizer to crops on the few sites where big responses would have been obtained.
This discussion is mainly of phosphorus manuring, but the same considerations apply to using values for soluble soil K for recommending potassium manuring. The better methods of measuring soluble K picked out the highly responsive soils; the rela-tionships between analyses and K responses were improved by grouping the centres further by soil
Table 2. The frequencies of responses to phosphorus and potassium fertilizers in
groups of experiments arranged by soil analyses
Response to superphosphate (in cwt. sugar/acre)
P soluble in hydrochloric acid (rag. P/lOOg. of soil)
0-2- 1-5 1-6- 2-5 2-7- 3-6 3-8- 4-7 4- 8- 5-9 6-1- 8 0 8-2-11-4 11-5-35-0
K soluble in citric acid (mg. K/lOOg. of soil)
2-6- 4-1 4-2- 5-1 5-2- 5-7 5-8- 6-6 6-7- 7-5 7-6- 9-5 9-6-12-7 12-8-21-8
Total number of
centres 27
26 27 27 27 27 27 28
Total number of
centres
30 33 31 30 31 31 32 30
Mean response
5 0
2-7 1-8 1-2 0-9
0-6
1-0 0-4
Mean response
4-6 4-8 6-2 2-7 2 1 2-0 0-8 0-7
High, Medium, Low, Depression, 19-2 to 2-7 2-6 to 1-4 1-3 to 0 0 - 0 - 1 to -5-0
Numbers of centres in each group
16 11 8 5 4 2 5 2
4 10 4 7 9 6 7 7
5 1 7 8 6 12 6 5
2 4 8 7 8 7 9 14 Response to muriate of potash (in cwt. sugar/acre) High, Medium, Low, Depression, 18-5 to 5-5 5-4 to 2-4 2-3 to 0-1 0-0 to -8-2
Numbers of centres in each group
11 16 16 6 5 3 2 4
12 9 10 10 8 11 3 2
5 3 4 6 11 11 15
10 1214
272
R. G. WARREN AND G. W. COOKE texture; but no refinements, either of analyticalmethods or of ways of treating the results, removed many of the anomalous soils present in both the 'rich' and 'poor' groups.
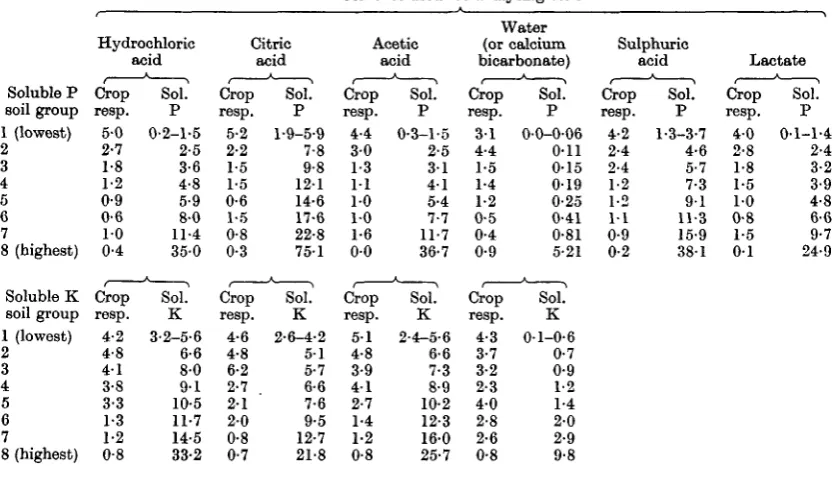
Table 3 summarizes average relationships between crop responses and all methods of measuring soluble P and K in soils. Mean responses to P and K fertilizers for the various analytical methods were calculated after dividing the centres into roughly equal groups, there were about 27 soils for each group of P values and 31 for K values, the mean values for soluble P and soluble K by different methods for each soil group are also shown.
Comparing soil analysis methods for advising on fertilizing
The practical value of a method of soil analysis is the financial gain from selective manuring, decided by the results of analysis, compared with the profit from using the same total quantity of superphosphate, but applying it uniformly over all fields. In 1946
1-4 cwt. of sugar was needed to pay for the
super-phosphate tested (at 1-0 cwt. P2O6/acre). In 1962,
1-9 cwt. of sugar is needed to buy this amount of
superphosphate at unsubsidized prices, but only
1-1 cwt. of sugar is needed when the current
phos-phate subsidy is deducted. In both 1946 and 1962 an increase of 1-1 cwt. of sugar/acre was needed to
buy the 1-2 cwt. K2O/acre tested (as muriate of
potash). Changes in crop and fertilizer prices affect the profitability of fertilizers but do not alter con-clusions on comparisons between methods of soil analysis; these were originally calculated at 1946 prices and this basis is used here because the cost of superphosphate in 1946 (in terms of sugar prices) was between the subsidized and unsubsidized cost in 1962 and the price ratio of muriate of potash and sugar has not altered.
In comparing the profits resulting from using different methods of soil analysis to advise on using fertilizers decisions must be made on the number of groups of fields to receive different manuring, and on the levels of manuring. Two examples of possible decisions are used here to compare the efficiencies of the methods of soil analysis. In the first example, a low average rate of manuring (0-25 cwt. P2O6/acre),
applied to all soils, was compared with selecting one-quarter of the soils to receive 1-0 cwt. P2O6 and the
rest to have none. In the second example used, one-quarter of the fields received 1-0 cwt. P2O5/acre,
a second quarter received 0-5 cwt. P2O6/acre and
half of the fields received no phosphate; these returns were compared with the return from 0-375 cwt. P2O5/acre applied to all fields, this amount
is near to the present average optimum dressing (Boyd, Garner & Haines 1957). The profit made by
Table 3. Relationships between average values for soluble phosphorus and soluble potassium
in soils and average responses to phosphorus and potassium fertilizers
(Crop responses to dressings of P and K fertilizers are in cwt. of sugar/acre. Soluble P and K extracted from soils are in mg. P and K/100 g. of soil; the values stated are the higher ones in the range for each group (except in the lowest group where the range is given).
Solvents used for analysing soils
Soluble P soil group 1 (lowest) 2 3 4 5 6 7 8 (highest) Soluble K soil group 1 (lowest) 2 3 4 5 6 7 8 (highest) Hydrochloric acid Crop resp. 5-0 2-7 1-8 1-2 0-9 0-6 1-0 0-4 t Crop resp. 4-2 4-8 4 1 3-8 3 3 1-3 1-2 0-8 Sol. P 0-2-1-5 2-5 3-6 4-8 5-9 8-0 11-4 35-0 -* < Sol. K 3-2-5-6 6-6 8-0 9-1 10-5 11-7 14-5 33-2 Citric acid K / Crop resp. 5-2 2-2 1-5 1-5 0-6 1-5 0-8 0-3 r Crop resp. 4-6 4-8 6-2 2-7 2-1 2-0 0-8 0-7 Sol. P 1-9-5-9 7-8 9-8 12-1 14-6 17-6 22-8 75-1 •+ , Sol. K 2-6-4-2 5 1 5-7 6-6 7-6 9-5 12-7 21-8 Acetic acid
, K
t Crop resp. 4-4 3 0 1-3 1 1 1 0 1 0 1-6 0-0 i Crop resp. 5 1 4-8 3-9 4 1 2-7 1-4 1-2 0-8 Sol. P 0-3-1-5 2-5 3 1 4-1 5-4 7-7 11-7 36-7 ^ * Sol. K 2-4-5-6 6-6 7-3 8-9 10-2 12-3 16-0 25-7 Water (or (calcium bicarbonate) Crop resp. 3 1 4-4 1-5 1-4 1-2 0-5 0-4 0-9 i Crop resp. 4-3 3-7 3-2 2-3 4-0 2-8 2-6 0-8 Sol. P 00-0-06 0-11 0-15
0 1 9
0-25 0-41 0-81 5-21 -* ^ Sol. K 0-1-0-6 0-7 0-9 1-2 1-4 2-0 2-9 9-8 Sulphuric acid r~ Crop resp. 4-2 2-4 2-4 1-2 1-2 1 1 0-9 0-2 Sol. P 1-3-3-7 4-6 5-7 7-3 9 1 1 1 3
using analyses to decide where superphosphate should be given was obtained by summing average responses on the manured groups of soils; the response curves of Crowther & Yates (1941) were used to calculate responses to dressings smaller than those tested in the experiments. Profit from the manured sites was then expressed as an average for the whole area (including unmanured sites).
Table 4 compares the profit made by using soil analysis to decide manuring with the profit from a uniform dressing to all fields, using the same total amount of phosphate or potash. Selecting a pro-portion of the fields for phosphate manuring by any of the soil analysis methods was more profitable than manuring uniformly. In both examples of selective manuring with phosphate, the best solvent for extracting soil P was hydrochloric acid; water and citric acid were only a little less efficient. Sulphuric or acetic acid, or lactate solution, were less useful. But any of the methods would have helped farmers as a whole to save money by decreasing dressings on soils that were high in soluble P.
Similar comparisons for potassium manuring are also in Table 4. The proportion of the soils used that showed profitable crop responses was much higher than in the phosphate tests, larger proportions of the fields were therefore selected for manuring in the examples chosen to compare methods of measuring soluble K. At the low average rate of dressing, selecting fields for manuring by extracting soil K with citric, acetic, or hydrochloric acids was more profitable than uniform manuring with the same total quantity of KaO, but using water-soluble K was little better than giving uniform dressings. At the higher rate of manuring, using the citric and acetic acid methods was better than applying a uniform dressing, using the hydrochloric acid method was little better than uniform manuring, and the water-solubility method was much worse. If this last method (which was widely used in European countries before 1940) had been used to advise farmers to select a proportion of their fields for K-manuring it would have caused serious loss where heavy dressings were normally given, and with light dressings it would have had little advantage over uniform manuring. (The water-soluble K method gave better results when it was adjusted to allow for soil texture.)
Analysing soils for soluble P and K to select a proportion of fields for manuring is of most value when: (i) the nutrient under test increases yields on only a small proportion of the soils used; (ii) the total quantity of fertilizer available is restricted; and (iii) fertilizers are expensive relative to crop prices. The most important use of soil analysis is to pick out very deficient soils where all crops must have the appropriate fertilizer. Using soil tests is parti-cularly profitable for advising on the manuring of
crops that give little average return from fertilizer, and normally receive little or none; peas grown in the arable areas of England are an example of such crops, and Crowther, Reynolds & Shorrock (1952) showed how useful soil analysis was for detecting the few sites that justified fertilizing. Where it is the general custom to fertilize a crop heavily, the main value of soil analysis is to indicate fields where responses are unlikely and where the normally recommended heavy dressing would probably be unprofitable; on such fields a dressing that is only one-third or one-half of normal will be enough to secure much of the maximum possible response should the analytical prediction that the soil is 'rich' be incorrect.
Table 4. Total profits (in curt, sugar/acre) from
selective manuring of sugar beet by soil analysis, compared with profits from uniform manuring
For phosphorus
Low average Higher average Dressings on rate/acre rate/acre manured fields (0-25 cwt. (0-375 cwt. (cwt. PaO5/acre) P2O5) Ps,O6)
Proportion of fields dressed
1-0 One-quarter One-quarter 0-5 — One-quarter 0-0 Three-quarters One-half Profit from manuring by analysis Analytical method
Hydrochloric acid 0-61 . 0-70 Water 0-59 0-68 Citric acid 0-56 0-66 Acetic acid 0-57 061 Lactate 0-50 062
Sulphuric acid 0-48 0-62 Profit from uniform manuring with same total
amount of P2O5
0-39 0-48
For potassium
Low average Higher average Dressing on rate/acre rate/acre manured fields (0-375 cwt. (0-75 cwt. (cwt. KjO/acre) K2O) Ka0)
1-2 0-6 0-3 0-0
Proportion of fields dressed
One-half One-quarter One-quarter
One-half One-quarter
One-quarter
Profit from manuring by analysis Analytical method
Citric acid 1-61 1-98 Acetic acid 1-57 1-92 Hydrochloric acid 1-51 1-85 Water 1-33 1-64
Profit from uniform manuring with same total amount of K2O
1-23 1-82
274
R. G. WARREN AND G. W. COOKESUMMARY
Eleven years of field experiments on manuring sugar beet were used by the late E. M. Crowther to compare methods of analysing soils for soluble P and K; this paper reports his work.
The experiments were divided by soil analyses into groups of equal numbers of sites; average crop responses were used to value the analytical methods. Such tables of average data overvalue soil analyses because each method was misleading in a small proportion of the fields used. A quantitative way was developed of assessing the gains from using soil analysis in planning fertilizing and of comparing analytical methods. The total profit from uniformly manuring all the soils examined was compared with the profit made by using analyses to select a pro-portion only of the soils to be manured; the total amount of fertilizer used was the same with each way of planning manuring. The most efficient analytical method gave the most profit.
For phosphate, differential manuring of sites selected by soil analysis was more profitable than uniform manuring, with all the methods of measuring
soluble P that were tested. The best method used a rapid extraction with dilute hydrochloric acid, but extracting with water (calcium bicarbonate solution was used for calcareous soils), or with citric acid solution, was nearly as effective. These three methods, using little solvent relative to soil, were more useful than methods using larger volumes of dilute sulphuric acid, dilute acetic acid, and a lactate solution.
The sugar beet responded more often to K than to P manuring, so there was less chance of making extra profit by using analyses to detect the richer soils where either no K fertilizer, or small dressings only, should have been given. Using the citric acid method of measuring soluble-K to separate the soils into groups for differental manuring was more profitable than giving uniform dessings to all fields; acetic acid was less effective than citric acid, and the hydrochloric acid method gave no advantage over uniform manuring with the heavier rate of potas-sium. Water-soluble K measurements were worse than acid-soluble values; using them to predict responses and manuring would have given less profit than uniform manuring at the heavier rate used.
REFERENCES
BOYD, D. A., GARNER, H. V. & HAINES, W. B. (1957). J. Agric. Sci. 48, 464.
CROWTHER, E. M., REYNOLDS, J. D. & SHORROCK, R. W. (1952). Agriculture, hand. 58, 584.
CROWTHER, E. M. & YATES, F. (1941). Emp. J. Exp. Agric. 9, 77.
DIRKS, B. & SCHEFFER, F. (1928). Landw. Jrb. 67, 779.
DYER, B. (1894). J. Chem. Soc. 65, 115.
EGNER, H., KOHLER, G. & NYDAHL, F. (1938). Ann. Ziandw. Hochschule Schwedens, 6, 253.