Creating a questionnaire for a scientific study
Valli, Raine
Kokkola University Consortium Chydenius, Finland ([email protected])
Received: 14 July 2016 Revised: 30 September 2016 Accepted: 3 October 2016
Available Online: 2 November 2016 DOI: 10.5861/ijrse.2016.1584 ISSN: 2243-7703
Online ISSN: 2243-7711 OPEN ACCESS
Abstract
Using questionnaires has become a permanent part of collecting data in scientific studies
within the sphere of human sciences as well as other disciplines. It has been utilized already
for nearly a century in collecting data. The first questionnaires were carried out on paper but
nowadays there are e-questionnaires alongside it which can be carried out through e-mail or
published on a social media platform (for example, Facebook). An often used method is also a
survey which is carried out with a research project's own web page, association or company
etc. A questionnaire has been considered as an actual scientific method of data collection since
1930s. However, it was already used a little earlier in research after the utilization of
statistical methods in the analysis of research results became common in 1920s. In human
sciences, such as pedagogics, the use of the questionnaire during the last few decades has
been lesser than in the field of natural science, technology and economics where it is a more
prevalent way to conduct a research study. In pedagogics the qualitative study and so-called
softer methods have dominated the field of research. At the moment we in Finland, as in the
wider world, lack adequate knowledge for the thesis supervisors so that the problems in
research would be directed according to the purpose towards the writing of the quantitative
thesis and to solving of research problems.
Valli, R.
Creating a questionnaire for a scientific study
1. Introduction
So a questionnaire does not mean just a questionnaire, which comes in the post and should be answered and returned back in the answer envelope that has been reserved for it. There is also variation in the form of the questionnaire according to the purpose and to the target group. Sometimes the researcher is working as a test administrator at the location in the data collection and sometimes the test administrator can be, for example, a class teacher who supervises the data collection from the pupils. Sometimes there is no administrator at all, as in mail survey. Then the interviewee acts independently according to the given instructions. There can be variation also in whether it takes place one at a time, such as in connection with the mail questionnaire or whether the data is collected simultaneously, for example, by school class. Sometimes the alternative is to ask the respondents for a group answer, in which case more people discuss and produce a common view on the matter. In quantitative studies this, however, is seldom used because often it is important to get as wide a general understanding as possible produced by several people with the individual people's variation included. In the group answers there also is a danger that everyone’s voice is not heard, but only the opinion of the so-called loudest members of the group.
In order to guarantee a final result, which corresponds with the reality, one must be careful in making and shaping the questions because the questions create the foundation for the success of the study. The form of the questions indeed causes most mistakes in the research results because if the interviewee does not think in the same way as the researcher has intended a question, the results are distorted. One has to be exact with the wording: they cannot be vague or indefinite. The questions have to be also unambiguous and they must not be leading. The construction of the questions is always based on the objectives and research problems of the study. One must indeed start the data collecting only when the research problems have been specified because then it is known what kind of information an attempt is made to find with the data collecting. This way unnecessary question is avoided and above all the essential questions remembered. Often a novice researcher starts collecting data for a study too fast – one should not hurry.
When creating a questionnaire, the researcher often gets into a situation in which the matter is not in the form to be measured, and there is no indicator available that has been tested earlier. Then the researcher has to operationalize the used concepts as the indicators (the questions). For example, the measuring of sociability can be built on concepts which rise from the definitions of sociability. The building of the indicator should start from the theory, in other words, the researcher becomes acquainted with the phenomenon to be measured with the help of earlier studies. There is only a short step to the creation of the indicator if it is possible to find the central concepts based on the theory. So it is important always to study the theory before the survey. After that comes studying of the methods, and the base for the framework of the questions is found from there.
2. The order and the form of the questions
few questions which can be answered easily.
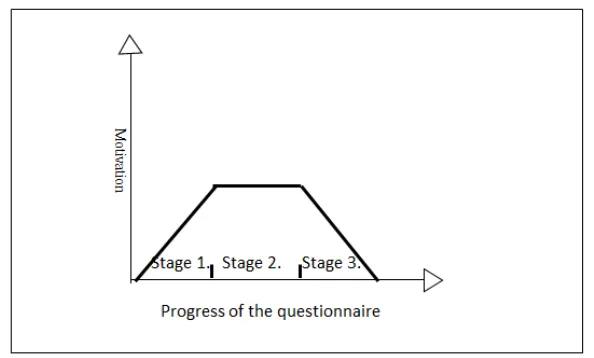
Another alternative is to build the order of the questionnaire so that the background questions are placed in the end of the form. This alternative comes into question when the form is long and the fear is that the interviewee's motivation and stamina can deteriorate. The background questions, such as age, are in this case easy to answer even if the senses are not anymore at their sharpest. This way the reliability of the questionnaire remains high.
Figure 1. The interviewee's level of motivation as the questionnaire proceeds
With the help of the questions that have been asked in the first stage of the survey (see figure 1 above) and of the answer instruction the intention is to create a confidential relationship between the respondent and the researcher. It must be possible to show the importance and meaningfulness of the survey in the questionnaire form before one proceeds to the questions and subject matters which are essential from the point of view of the research study. During the second stage even the little sensitive questions can be brought out and finally the background questions or the questions which can otherwise be answered easily.
The length of the questionnaire form is always worth carefully thinking about because too long a form makes the interviewee give up answering before they even become acquainted with it. According to the target group, the maximum length of the form varies: attention must be paid, among others, to the interviewees' reading ability but also to the subject matter of the survey and the significance of the subject for the interviewee which affect the eagerness to answer. As a general guideline, regarding the length of the form two pages for primary age children (7-13 year olds) and five pages for adults can be considered. If a longer form is necessary, it must be attractive. Here it is good to point out that these are only instructions giving direction, so the time used by the interviewee on the form must always be considered. At the same time one has to think how long the interviewee has the stamina to concentrate on the questionnaire form in the way required. The response time which is used for the questionnaire must not be too long. As a general rule it can be said that answering should not take more than 15 minutes but the time must be always examined case by case and it must be flexible. When a form is too long, the last questions are easily answered without thorough consideration in which case the reliability of the study can suffer. The more general the subject is to the interviewee, the shorter the questionnaire has to be and the more personal the subject, the longer the questionnaire can be. As well as a long form, cramped pages create the image of long and heavy work and if answering is not compulsory, it is easy to give up.
Valli, R.
which case the questions can be answered with reserve, for example, by leaving out some of the more sensitive information. It is always good to change the questions and answer alternatives into a personal form for the interviewee. It is a small but important point in planning the questions (cf. following).
Compare the following forms:
My gender is 1. female 2. male Gender 1. female 2. male
In the first alternative of the form the answering seems more natural and personal. In the second alternative the interviewees regards themselves easily as objective in which case a doubt is awakened, are they even interested in me in the questionnaire.
In connection with the building of questions it is also good to think in advance about inputting the answers (coding) in a statistics program. The ready answer alternatives are worth numbering and also otherwise one must think how the answers can be fed in to the machine in the most reasonable and easy way and also what and how are they going to be analyzed. So-called typing mistakes are reduced by good anticipation, inputting is made easier and above all the answers are obtained to the set research problems.
3. Alternative administration methods of questionnaires
3.1 Mail or letter survey
The mail survey is the most traditional and most used method of data collection when utilization of a questionnaire in the data collection is examined. In the mail survey the responsibility for the carrying out of the survey is left to the interviewee according to the instructions given by the researcher. The researcher usually encloses the instructions with the questionnaire they hope that the interviewee is reading before filling in the questionnaire. As a general rule it is good to think that the instructions have to be as concise as possible and the questions must be clear also without the instructions because unfortunately people do not always read the instructions especially if they are long. Some of the interviewees felt that “they do not need them in order to
know how to answer”.
One risk of the mail survey from the point of view of the study's success is that it is not always known who has answered the questionnaire in reality. This problem arises especially with people who are busy. So, for example, the leaders of big companies are difficult to get to answer the surveys. The interviewee of the questionnaire that has been sent to them can be an assistant or a secretary. It can be the same with a child's parents; the one answering can be a mother even if the answers for the questionnaire were particularly meant for the father. Fortunately this is only a marginal phenomenon but in the planning of a research and a survey attention has to be paid to it. Another weakness of the mail survey is often the low response percentage. It is easy to throw the questionnaire in the bin because there is no real contact with the researcher and the researcher is not a real person to the interviewee, a human being known by them. Often the interviewee has not even seen the researcher. However, this can be reduced by careful preparation (with good questionnaire instructions) or even by being in contact with the interviewees beforehand.
3.2 Simultaneous large group survey administered by the researcher
The data can be collected by carrying out the survey at the same time to a big group. This has been utilized in the human sciences when the target group is assembled somewhere such as in the schools, in the classrooms. In that case the researcher goes to school and collects research material simultaneously from all the pupils in the class. In the same way other ready structures can be used to collect data, for example, in the assembling of sports clubs or in a meeting or at education events. If the data collection has been well designed and it is efficient, the data can also be collected at the same time for several research studies. This is fairly rare but, for example, market research data can be collected like this. It is important, however, to remember that data collection must not take too much of the interviewees' time or tire them because then the reliability of the study suffers.
One clear advantage to this kind of form of data collection is that the researcher who is administering can control the interviewees' behavior and focus questions if they notice that the interviewees do not understand a question correctly or are totally leaving out answers. Correspondingly the interviewees can also ask if they do not understand the design of the question and answer alternatives. However, one must always remember that not everyone asks even when they don't understand. The form should indeed be already unambiguous and all the possibilities for misunderstanding must be removed from it. One can and should test the intelligibility of the form before an actual study situation by showing the form, for example, to an acquaintance who has not studied the field of research in question. If they do not understand something, the interviewees are not necessarily going to understand either. It is good to carry out the pretesting in as similar a situation as possible as the actual research subject (similar age group, professional background and many others.) by paying attention to all the important background variables to which attention is also paid in the sampling.
In this kind of a method of data collection the response percentage is high and the costs remain lower than in most other data collection methods because the researcher reaches several interviewees in one go. This way the amount of travelling decreases. The researcher is also able to observe interviewees and is able to make supplementary material if they so desire and if there is an advantage in doing so.
3.3 Simultaneous large group survey without the researcher present as administrator
One of the most cost-effective ways to collect data is to administer the survey simultaneously to a large group but so that the researcher is not present. Then the researcher does not need to travel because of the data collecting, they can deliver several questionnaires in the same envelope and the answers are returned in one answer envelope. It also is a quick way to collect research material and often it is also possible to follow fairly easily who has answered and who has not. In that case, if necessary, it is easy to remind those who have not answered with the repeat questionnaire. It improves response percentage and at the same time also improves the reliability of the study. The response percentage in the studies that have been collected this way is always fairly high even without the reminders, especially if data collection has been agreed upon in advance, for example, by telephone with the ones which participate in the survey. It is worthwhile to operate like this, for example, when collecting data with the school classes. As one call always applies at least to a school class of pupils, it does not take much time and resources from other work either. This facilitates arranging of the repeat survey in the material collecting and saves expenses.
When a researcher is not present as an administrator, the instructions of the study form into the factor which is important from the point of view of the success of the survey. The instructions should be presented to each interviewee in the same form and therefore the very exact answer instructions indeed are necessary. However, they have to be short and apt. In the following there is an example of the instruction:
To the teacher
Valli, R.
Read this text to your pupils before you distribute the questionnaires. Some parts of the text are in bold and I hope that you emphasize those sections.
This study surveys the drinking habits of adolescents and the adequacy of the alcohol education for the needs of the adolescents. In my opinion, the starting point for the alcohol education must be in exact accordance with the needs of young people.
A name does not need to be entered in the answer forms, you may answer anonymously. The answers of individual respondents in other words your answers, will only be processed by the researcher Raine Valli.
Do not let your friends influence the answers but answer by yourself. This way we get the best information about what young people know about alcohol and above all
what they want to know more about. After the research study is completed I will give the research results to all the schools in your town for them to use them in their work, so these results also hopefully benefit the education received by you.
When the studies are directed at schools, the teachers are good research assistants. They usually know their own pupils fairly well and therefore know the different pupils' abilities and possibilities to answer the survey. They act as the survey administrators conscientiously, control the data collecting so it is carried out according to the instructions, help the interviewees when needed and deliver the answer forms in time. If the researcher is not able to supervise data collection in person, then – if possible – using teachers as survey administrators is a recommended alternative. However, it is always worth carefully considering the survey administrator's role and the different persons' suitability for it. Many others than just teachers are surely suitable for this role but the suitability must be always considered, case-by-case.
3.4 Survey in the form of an interview
In this kind of data collecting the material is collected according to the questionnaire question by question but the researcher reads aloud the questions and answer alternatives to the ones to be examined and who answer orally. This kind of method is used, for example, in studies directed at the illiterate but also in market research, for example, the interviewer at the door of a shop or a telephone interviewer operates in this way. In this way some words can be consciously emphasized in the questions and their significance rises. If the stresses have not been thought about in advance, they may affect the results without the researcher understanding their significance. This happens especially if several people participate in collecting the data. When the other emphasizes the beginning of the sentence and another the end, the significance of the sentence can change as the judgment in the courtroom: “Guilty, no mercy” or “Guilty no, mercy”.
collectors creates its own problems and risks as stated earlier.
3.5 Telephone surveys
The advantage of the telephone survey compared to another type of oral interview is that the researcher does not need to travel to the ones to be examined or does not need to be physically present. This saves time so collecting even a relatively large amount of data is possible. However, it takes more time compared to the mail survey. Therefore, several data collectors often participate in the telephone surveys. The typical telephone surveys are, for example, the presidential and other Gallup-type surveys for elections.
Usually the telephone surveys are shorter than the mail surveys. The telephone surveys take a long time when the questions are orally presented and therefore it is not sensible to carry out long surveys. Attention must be paid to the resources of the interviewees and to the trouble they go through as the interviewees. Interviewees must not be strained too much so that they have the stamina to answer carefully. The telephone surveys are no more expensive than the mail surveys if the traditional mail questionnaire is administered one at a time and not by using cluster sampling. In some cases the telephone survey may even prove to be cheaper.
Compared to the mail survey the advantage of the telephone survey is an opportunity for both the interviewee and the questioner for more specified questions and giving explanations. When a question is unclear, the interviewees can tell that they do not completely understand a question. This way the maker of the questionnaire can explain further what the question is used to find out or what is meant by it. If there are several data collectors, the understanding of the aims of the contents of the questionnaire and of the research study require training.
In the telephone survey both positive and negative sides are simultaneously connected to reaching the interviewee. It is negative that the researcher must reach the interviewee personally and must go through on the whole the questionnaire together. This usually takes more time than for example posting a letter. In the mail survey the researcher is not present when the interviewee fills in the questionnaire. It is positive, in turn, that the researcher really knows that he has reached the interviewee and this way the repeat questionnaires are not needed.
3.6 E-mail and Internet surveys
Information technology has quickly reached all our everyday activities, also the research use. Still a lot of traditional questionnaires that have been printed on the paper are used, of course, in the research; they still drop into the post box fairly often. During the last few decades the response percentage in the mail surveys has decreased but correspondingly in the web-based surveys it has risen. The e-surveys have expanded their popularity especially in commercial purposes, but also in the research use. One of their strengths is visuality. They can be built versatile in appearance and they can be made as pleasing as possible. Voice and video files, video-clips, can be quite easily added to them to clarify questions unlike in a paper questionnaire. When however, there are such nearly limitless possibilities, one must always remember when creating a questionnaire whom it is made for, what is the target group and is it built from their point of view. It also is good to remember that what pleases one person does not necessarily please another; therefore it is worthwhile to keep visual design within reason.
A second advantage, perhaps the biggest, is its speed both in regards to sending and returning the questionnaire. Of course, sometimes one has to prepare in advance when planning how the target group is reached. The third advantage of the e-survey is its economy. There are hardly any expenses in the data collecting stage, not even if the interviewee lived on the other side of the world. So there are no geographical obstacles for collecting even large amounts of data from a wide area.
Valli, R.
computers. When the questionnaire is created, the fact that an interviewee may use these devices for answering must be taken into consideration. The questionnaire should function in all the devices and the answers should be easy to input in spite of the device. It has to be easy to use on a touch screen as well as on a traditional computer screen. At the same time the so-called swipe has affected the appearance and also the length of questionnaires. It is good to think about what kind of questionnaire is pleasant to answer with them and to deal with. In the surveys directed in particular at pupils and young people (who use smart phones a lot) the utilizing of this alternative is worthy of consideration.
In the surveys where data has been collected in the e-surveys or otherwise in social media, the researcher's own work stages decrease. The material does not need to be inputted separately or transcribed when it is already in an electric form and above all in that form that the interviewee has answered in. The study questionnaires can be collected, for example, into a Google Drive – program where a data collection file is created for it. What is also good about this is the fact that the typing mistakes or other such mistakes that are possible in data inputting/transcription stages are totally eliminated in which case the research material is even more reliable than before. When creating an e-questionnaire, it is worthwhile studying the literature in connection by Valli and Perkkilä (2015, pp. 109-120) as well as Laaksonen, Matikainen, and Tikkanen (2013).
4. Designing the questions
In the questionnaire questions can be asked in many different ways: amongst others, open questions, ready answer alternatives or by using ordinal scale (measuring the intensiveness) indicators. The form of the individual question determines of what scale is in question at a given time and how the data collected in this way can be analyzed. I will first present the ordinal scale indicators in this article. Likert scale, semantic differential, graphic rating scale, VAS scales (Visual Analogue Scale) and the one-direction intensity scale are ways of measuring with similar basic logic and their structures are based on the same solutions. Other indicators like them also exist, either derivatives developed from the above mentioned, or measurement methods that have totally been built from a brand new starting point. These all are indicators with ordinal scale at least in principle, even though they are often used in the manner of the interval scale indicators. In this article I will concentrate on them next.
4.1 Likert scale
When it is a question of the measuring attitudes or opinions, one of the most used and suitable alternatives is Likert scale (Gall, Gall, & Borg, 2003, pp. 228–229). The first steps of the indicator are placed in the year 1932 when Rensis Likert presented the indicator (Nardi, 2003, pp. 66–67). When the indicator was originally developed, there were seven answer alternatives but nowadays in surveys also five and nine point scales are used, most often the five point scale. The idea of the uneven number of points guarantees a possibility to not have an opinion on the matter to the interviewee and therefore the neutral “I cannot say”, alternative is placed in the middle of the scale. In basic principle the Likert scale indicator indeed should contain an odd number of answer alternatives (see Table 2). Usually the answer alternatives (for example 1 –5) are named as follows: 1 = strongly agree and 5 = strongly disagree. However, it is not always like this. The following table reflects well how the answer alternatives have to be always picked from the contents of the research subject and not from the ready indicators. Also notice that the “I cannot say” category is missing from the ones underneath. In my opinion, it is not at all always necessary, because if an interviewee does not have an opinion, it is possible to choose not to answer.
interviewees are better at having an opinion when there is no “I cannot say” alternative available is connected to the reasons behind the choice. If an interviewee cannot say, they can always opt not to answer. The argument sound good and this really has an effect on the answering behavior as presented. However, it is a little questionable to interpret results or at least to compare them with another study in which there have been an odd number of the alternatives. I indeed always recommend using an odd number of the answer alternatives. The form of a question could be the following:
Choose of the following alternatives:
1 = totally agree 2 = mostly agree 3 = I cannot say 4 = mostly disagree 5 = totally disagree
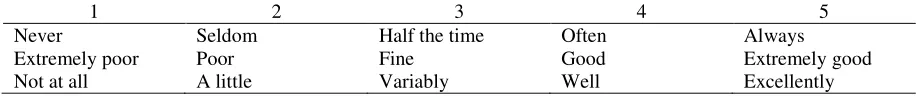
Table 1
Some alternatives for naming the answer alternatives on the Likert scale
1 2 3 4 5
Never Seldom Half the time Often Always
Extremely poor Poor Fine Good Extremely good
Not at all A little Variably Well Excellently
Source. Punch (2003, p. 59) and (Czaja & Blair, 2005, pp. 74–75 & 79)
Table 2
Example of the Likert scale variable
Items
Takes others’ opinion into consideration 1 2 3 4 5
Can cooperate well with others 1 2 3 4 5
Break the school rules 1 2 3 4 5
In the previous example the numbers have been placed inside every box. It brings reliability but if there are a lot of questions, the excessive information can cause a tangled impression. One of the weaknesses of the Likert scale is that there are people who do not like to have an opinion on the matters but use plenty of middle alternatives. Another typical phenomenon is that the extremes are left without consideration and the interviewees are contented with choosing the alternatives “mostly agree” and “mostly disagree”. So in reality the researcher often, in particular, with the small samples of data joins these categories at the analysis stage.
4.2 Semantic differential
The semantic differential is called in some connections also by the name the Osgood scale because Charles Osgood who developed this measuring method in 1957 is considered as its father. He adapted the Likert scale as a basis for the method. He used several years for developing and testing the method. Usually semantic differential has a seven point indicator which consists of the comparison of adjective pairs and where the middle alternative is neutral as in the Likert scale. Adjective pairs are properties which are opposites of each other (Osgood, 1969, pp. 18–30; Snider & Osgood, 1969, pp. 6–8.). The original purpose of the use of semantic differential was in the measuring of attitudes but later on it has been used, among others, in measuring similarity and range (Eskola, 1975, pp. 252–253).
Valli, R.
Table 3 it can be perceived how the positive property is placed first, in other words on the left side in the first question and in the second question it is as the latter alternative, in other words on the right side. If these are not randomly varied, the interviewees' opinions are already very quickly directed towards the positive properties. One needs to act correspondingly with the Likert scale as well as also with the other indicators in collecting data.
Mark with a cross in which section your opinion is placed.
This article is:
Table 3
Example of the semantic differential
Interesting Boring
Poor Good
4.3 Flechen scale
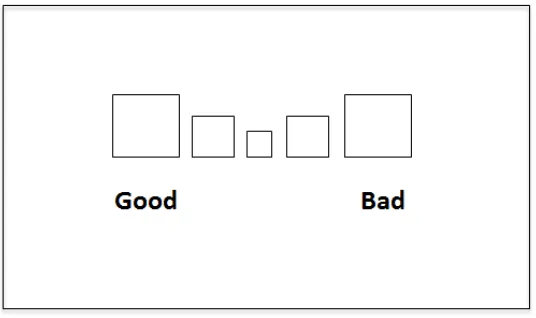
Also a definition graphic rating scale is used to describe the Flechen scale (see Figure 2). It has the same basic principle as the semantic differential and Likert scale but in addition to the two it is suitable to be used as a form of data collection also if the interviewees are illiterate, for which purpose it was originally developed. Two visually different and commonly used alternatives of the Flechen scale are: squares with their relative size expressing the opinion or “faces” in which the position of the mouth (smiley or sad) tells the interviewee's opinion. One has to be a little careful with the proportioned squares because by offering the big squares on the edges of the scale they are made to seem as more recommended alternative and the middle alternative is almost excluded because of its small size – there is no room in it to even draw a cross. This happens especially if the interviewees are small children. So the possible effect of the square alternative on the results must be thought about in advance but also during the analysis. A similar problem does not appear in connection with the use of smiley and dissatisfied face images because they are usually the same size. At the same time they are more visual and their use is also considerably more common. I myself recommend just the use of face images instead of the squares.
Figure 2. Example of the Flechen scale (a graphic rating scale)
4.4 Vas-indicator
typical a 10 cm segment of a line and the interviewees tick the opinion they consider the best between the ends of the section. So the interviewees do not need to think between different categories unlike with the Likert scale, which to choose but they may place their opinion in the wanted section they carefully select. In that case the information is more exact when the scale is finer. On the other hand, it is also coarser when verbal or digital symbols are not there to help in the answering (Metsämuuronen, 2000, p. 48).
If the interviewees are exact and analytical, Vas-indicator is surely considerably better a measuring tool than, for example, the Likert scale. Instead, if the interviewees are very broad-minded people or small children Vas-indicator does not work. The use of the indicator is therefore worth considering carefully and pretesting its suitability on the group which corresponds to the future target group. The analysis is namely based on an exact measurement with the help of the ruler. The researcher measures how far from the beginning of the indicator the cross is placed. It could be for example 3.4 cm. In reality such an exact measurement result is not worth using in the analysis because one cannot be sure, if the interviewee has, in particular, meant that the value in question or could it be something between the values of 3.2 and 3.6. So in practice the researcher always has to classify and group the answers into groups and then the process moves closer to the indicators that have been presented. Vas-indicator is the most rarely used indicator of the ones that have been presented. There are examples of adapting it in practice in several articles of Piispanen, Valli, and Meriläinen (2014) where they investigate the effect of the further education course on the teachers' attitudes before and after the education. It is indeed well suited for clarifying the change.
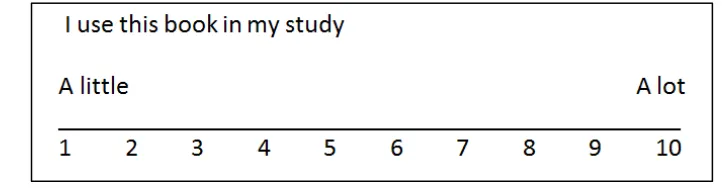
Evaluate your own understanding before and after the education by drawing a vertical line on the straight line below.
Figure 3. Example of the Vas-indicator
In my opinion, one of the more sophisticated forms of Vas-indicator is “a one-way intensity scale”. It consists of a uniform line and verbalizing of the end indicators. Furthermore, the numbers have been set for the line as the interviewee's help. In that case the researcher will get an exact number with whole numbers which are located where the interviewee's opinion is. The ten point alternative of this option is in common research use and furthermore, the seven point scale. In this indicator, a key scale is created by verbalizing the polar opposites for the interviewees as is done with Vas-indicator, in which case it remains for the interviewee to perceive and to interpret the scale in regard to their own view (Nardi, 2003, pp. 66–67). It is good to use the conscious translating of the material in also this indicator so that the external factors of the indicator are not influencing the answer. So in the scale 1 can be both positive (to aim for) and negative property.
Valli, R.
So the scale is an ordinal scale alike the previous indicators and it uses only whole numbers. In this indicator the mutual understanding between the researcher and the interviewee of the used scale is positive but at the same time some measuring exactness is lost compared to an original Vas-indicator. However, the scale that has been measured with the accuracy of one-tenth can also be used, also in my opinion, as a simple intensity scale when the interviewees are aware and well informed about the use of the scale in question and about its details. Then their exact location needs to be marked in addition to the whole numbers on the line. It helps the interviewee to use the scale between the whole numbers. In the study use I have never seen it being used in this way before. This is a good example of how the further use and development of indicators can be refined when necessary. So this method of analysis can be named in a new way and in this context a definition is Valli's analysis method of intensity scale. In this context a stand must be taken also regarding the length of the scale from the point of view of the odd/even matter. Here the even number is a better alternative because often when the material is encoded in VAS- and intensity scales the answer alternatives are condensed in the following way: 0-2.0, 2.1-4.0, 4.1-6.0, 6.1-8.0 and 8.1-10., in which case the even intervals of classes can be formed most easily.
5. Forming sums of variables
The analysis of research results is seldom based on only one question that has been asked above. Often there are several questions and the solution to the research subject is searched from them, for example, in an attempt to evaluate the respondent's sociability or the level of it. In that case the sums of variables are formed from these indicator scales mentioned above. The sums of variables are joined to make up one indicator (for example, when the areas of the sociability have been measured with a semantic differential: to help others, the cooperation succeeds well, takes the opinions of the others into consideration and many others.).
When there are a lot of statements, they are usually divided into more than one group in which case the indicator contains several different properties to be measured, for example, the questionnaire can measure affective development also in addition to the social development the same time. In that case it is important to be able to separate the factors which measure the same properties into their own groups. Principal component analysis (see Valli, 2015, pp. 121-127), which is related to factor analysis is often used as help for grouping in these situations. With its help it can be found out which variables measure properties with the same contents, either social or affective development. This is a good way to check the accuracy of the preconceptions and the theories separately in each group of data. After forming the sums of variables they can be analyzed, as can be done with any kind of individual variable.
5.1 Ready answer alternatives
One alternative to forming the question is to create the ready answer alternatives based on the imagined answers. Then the researcher needs to know in advance what kind of answers the interviewees will give in response to the questions – the researcher must have an image of the answer alternatives. For clarifying the background information (see the following example) the questions of this kind are most applicable and most used but of course, they are also suitable for other purposes.
Example of asking the background information based on ready answer alternatives:
What school are you in? 1. Comprehensive school 2. Upper secondary school 3. Vocational college
4. Other, what _________________?
interviewee. This way the analysis and the interpretation are considerably simpler and easier.
5.2 Open questions
The answers given to open questions can be analyzed also with statistical methods contrary to what is often thought. The answers have to be then classified into the groups. When the classification is made, the researcher must think beforehand and must examine received answers so that it is possible to find out what kind of categories the answers are divided into. First it does not pay to be too restricting but it is better to use a lot of categories which contain even the small differences or shades because the material can still be condensed afterwards by joining near categories but it is not possible to do it the other way round. Another alternative for analyzing open questions is a qualitative examination. In this article I do not delve, however, into that or to the other methods of analysis in qualitative research.
An advantage in the form of the open questions is that among the answers there can be good ideas. Another positive aspect is an opportunity to find out the interviewee's opinion from many sides and more thoroughly. A possibility to classify research material in many ways is also an advantage. The disadvantage of open questions is that they are easily not answered and the answers are summarizing or inaccurate. The interviewee does not always answer directly to the question either but around it instead. In that case the answers are unproductive. The open questions are laborious to analyze because the classification of answers and the calculation of results takes considerably more time than the interpretation of ready alternatives.
The questionnaire that is carefully planned and drawn up is an excellent tool for data collection in quantitative study. Extensive research knowledge that is fit for generalization is obtained effectively and reliably from such questionnaire regarding the research phenomenon and research problems. Many subjects can be found for it in the area of scientific study.
6. References
Czaja, R., & Blair, J. (2005). Designing surveys. A guide to decisions and procedures. London: Pine Force Press. https://doi.org/10.4135/9781412983877
Eskola, A. (1975). Research methods in Sociology II. Porvoo: WSOY.
Gall, M. D., Gall, J. P., & Borg, W. R. (2003). Educational research. An introduction. Boston: Allyn & Bacon. Laaksonen, S.-L., Matikainen, J., & Tikkanen, M. (Eds.) (2013). Excerpts from the net. Research methods in the
internet and social media. Tampere: Vastapaino.
Metsämuuronen, J. (2000). The basics of methodology in human sciences. Methodology-series 1. Helsinki: International Methelp.
Nardi, P. M. (2003). Doing survey research. A guide to quantitative methods. Boston: Allyn & Bacon.
Osgood, C. E. (1969). The nature and measurement of meaning. In J. G. Snider & C. E. Osgood (Eds.), Semantic differential technique. A sourcebook (pp. 18-30). Chicago: Aldine Publishing Company.
Piispanen, M., Valli, R. & Meriläinen, M. (2014). The teachers' expertise should already be utilized at the planning stage of school building. In L. Gómez Chova, A. López Martínez, & I. C. Torres (Eds.), ICERI 2014 Proceedings of international conference of education, research and innovation (pp. 5574-5581). Spain: Sevilla.
Punch, K. F. (2003). Survey research the basics. London: Sage. https://doi.org/10.4135/9781849209984 Valli, R. (2015). Introduction to statistical research (pp. 121-127). Jyväkylä: PS-kustannus.