0 INTRODUCTION
Image analysis plays a vital role in modern computer-aided systems. Images can be obtained from different modalities, such as cone beam computed tomography (CBCT), magnetic resonance imaging (MRI), positron emission tomography (PET), single-photon emission computed tomography (SPECT), ultrasound, etc. These can provide three-dimensional (3D) image datasets that contain accurate information for the generation of surface 3D models, even when compared to optical 3D digitizing methods [1]. Surface 3D models are a very useful resource for accurate diagnosis, but also for further action such as preparation of surgeries, designing different types of implants, etc. The most critical step for the generation of a surface 3D model is the accurate segmentation for extracting objects of interest from the surroundings, thus enabling 3D surface reconstruction [2] and [3].
Information acquired from medical images has a significant impact on proper diagnosis and treatment. For this purpose, the segmentation of medical images is performed, which can be either manual or automatic [4]. Nowadays, due to the large amount of data obtained
using medical imaging systems, methods used for semi-automatic or fully automatic segmentation are more favourable but still refer to manual results for verification and training purposes [5]. When a 2D image is acquired, some information may be lost, and this information loss degrades the image quality, and more importantly affects the accuracy of segmentation and geometry reconstruction, eventually endangering proper diagnosis. Therefore, accurate reconstruction of geometry is required and depends on several factors, including spatial resolution, which is determined by the layer thickness [6], and slice thickness, which affects loss of resolution quality on the reconstructed data [7]. Without some form of image enhancement, segmentation of medical images becomes very difficult and sometimes does not provide accurate results. This occurs as a result of the vague structures in poorly displayed medical images, or with the presence of homogenous surrounding structures. Thus, to improve the segmentation accuracy, it is necessary to preprocess image and to enhance its quality. With the breakthrough of additive manufacturing (AM) technologies in the medical field, it enabled physical fabrication of anatomical structures, which strongly
Fuzzy Hybrid Method for the Reconstruction
of 3D Models Based on CT/MRI Data
Sokac, M – Vukelic, D. – Jakovljevic, Z. – Santosi, Z. – Hadzistevic, M. – Budak, I.
Mario Sokac1 – Djordje Vukelic1,* – Zivana Jakovljevic2 – Zeljko Santosi1 – Miodrag Hadzistevic1 – Igor Budak1 1University of Novi Sad, Faculty of Technical Sciences, Serbia
2University of Belgrade, Faculty of Mechanical Engineering, Serbia
This research proposes a hybrid method for improving the segmentation accuracy of reconstructed 3D models from computed tomography/ magnetic resonance imaging (CT/MRI) data. A semi-automatic hybrid method based on combination of Fuzzy C-Means clustering (FCM) and region growing (RG) is proposed. In this approach, FCM is used in the first stage as a preprocessing step in order to classify and improve images by assigning pixels to the clusters for which they have the maximum membership, and manual selection of the membership intensity map with the best contrast separation. Afterwards, automatic seed selection is performed for RG, for which a new parameter standard deviation (STD) of pixel intensities, is included. It is based on the selection of an initial seed inside a region with maximum value of STD. To evaluate the performance of the proposed method, it was compared to several other segmentation methods. Experimental results show that the proposed method overall provides better results compared to other methods in terms of accuracy. The average sensitivity and accuracy rates for cone-beam computed tomography CBCT 1 and CBCT 2 datasets are 99 %, 98.4 %, 47.2 % and 89.9 %, respectively. For MRI 1 and MRI 2 datasets, the average sensitivity and accuracy values are 99.1 %, 100 %, 75.6 % and 99.6 %, respectively. The average values for the Dice coefficient and Jaccard index for the CBCT 1 and CBCT 2 datasets are 95.88, 0.88, 0.6, and 0.51, respectively, while for MRI 1 and MRI 2 datasets, average values are 0.96, 0.93, 0.81 and 0.7, respectively, which confirms the high accuracy of the proposed method.
Keywords: fuzzy C-means clustering, region growing, image segmentation, surface 3D model
Highlights
• A hybrid method is proposed for accurate segmentation of CT/MRI data. • A new seed selection approach for the region growing method is developed. • Experimental results show good accuracy and robustness.
depends on the input data. The development of medical imaging and especially imaging software has made it possible to create various kinds of 3D models from medical images [8]. The entire process can, into three steps, which are data acquisition, image processing, and model manufacturing [9]. This integration propelled the barriers and possibilities for applications of medical implants used for different types of trauma, disease, bone damage and defects which need to be reconstructed [10]. Therefore, adequate image segmentation and reconstruction of 3D models is vital for their applications in this field.
There are several methods used for image enhancement, and one of the most commonly used for contrast enhancement of medical images is histogram equalization [11]. Besides this, other improved methods for histogram equalization such as Type II fuzzy set theory [12] or bi-histogram equalization with a plateau level [13] are presented, thus improving quality and reducing the time required for image enhancement. However, with the further development of computer technologies, intelligent systems employing genetic algorithms, fuzzy logic, machine learning, neural networks, and swarm intelligence are finding their place and are applied in different scenarios and in different fields [14] to [17]. Many researchers have combined different methods to maximize their advantages and to solve current drawbacks regarding segmentation of CT images, even going as far as implementing 4D architecture for motion estimation [18], thus improving performance. A combination of different methods can improve data extraction from CT images, as seen in [19] by implementing a deep learning model or by combining spatial fuzzy clustering and level-set methods [20]. For the segmentation of MRI images, the authors in [21] proposed a new method for joint bias field estimation and segmentation of MRI images.
Regarding common drawbacks of thresholding methods where images are corrupted with artefacts and noise, the authors in [22] proposed a new multi-region thresholding methodology by using fuzzy sets. Concerning the various implementations of the fuzzy C-means clustering (FCM) method, many researchers have combined this method with other methods such as region-based active contour [23], the level set method [24], self-organizing maps [25], region growing and particle swarm optimization method [26]. The main goal of their implementation was to improve segmentation accuracy in each of these fields.
In contrast to previous investigations, the present paper proposes a hybrid method that combines fuzzy C-means clustering and automated region growing
methods to enhance and segment medical 3D image datasets with higher accuracy. The novelty in this paper is in the newly developed method for automatic initial seed selection for region growing, which incorporates the value of standard deviation (STD) as a measure for seed selection. This, in combination with image enhancement based on FCM, completes the entire process for the segmentation of 3D image datasets. The presented method focuses on the enhancement of poorly visible structures present on CBCT and MRI datasets, which will improve segmentation and surface extraction. Two CBCT 3D image datasets and two MRI 3D image datasets were used for testing purposes and analysis of the proposed method.
1 METHODS
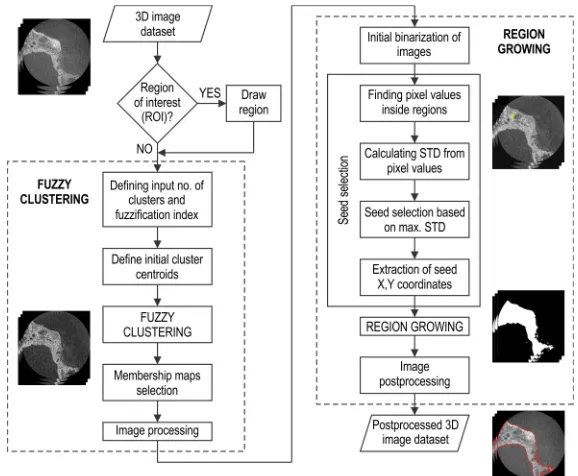
The approach is based on incorporating two methods that are used in image processing: FCM and the region-growing (RG) method. Their integration leads to the segmentation that consists of two stages. In the first stage, FCM is used as a tool for the enhancement of input 3D image datasets by making the borders of the vague areas more pronounced. This stage is especially crucial for corrupted CBCT images in which the vague areas are common. In the second stage, we introduce the automatic RG method based on a new principle of finding initial seed using calculated STD of pixel intensity inside regions that are present on images. The flowchart is illustrated in Fig. 1.
Besides the previously mentioned two stages, the flowchart contains an optional step that refers to the definition of region of interest (ROI). Namely, to accelerate the segmentation process, in some cases it is convenient to localize the area of interest for image segmentation on large 3D image datasets. For these purposes, a user can opt to utilize a specially designed tool for manually defining ROI and for localizing the area on image for segmentation.
1.1 Image Enhancement Based on Fuzzy Clustering
Fuzzy C-means is one of the most popular fuzzy clustering techniques because it is easy to implement, as well as being efficient and straightforward. FCM clustering generates fuzzy partitions for any set of numerical data, allowing one piece of data to belong to two or more clusters simultaneously [27].
we use the histogram of pixel intensities during the clustering process instead of the raw image data.
The working principle of the proposed FCM method for image enhancement consists of the following steps:
Step 1: Read the input set of images named im
and define input parameters: c (no. of clusters) and q
(fuzzification index).
Step 2: Calculate the maximum (Imax) and
minimum intensity (Imin) of each image in image set
im and arrange the overall intensity in ascending order as shown in Eq. (1):
I =
(
Imin →Imax)
. (1)Step 3: Find the size of I and assign it to a variable named si. Calculate the histogram (H) of the image set im.
Step 4: Generate the initial cluster segmentation size or class gap (dl) using Eq. (2):
dl I I
c =
(
max− min)
. (2)
Step 5: Generate the initial cluster’s centroids
C(i) using Eq. (3). These centroids are equidistantly distributed along intensities present in the image:
C i I dl dl
j i ( )= min + + ,
= ∑
2 1 (3)
where Eq. (3) provides centroid points with: Start>>>>Class_gap>>>>End.
Step 6: Set the initial error dC = infinity.
Step 7: Repeat the Steps (8) to Step (14) until dC
< 0.000001.
Step 8: Set initial centroid matrix C0=[C(i)].
Step 9: Calculate the distance D between each centroid and each pixel’s intensity of image using Eqs. (4) and (5):
D j i( , )= I j C i( )− ( ), (4)
D j i( , )=D j i( , )2/(q−1), (5)
here i = 1, 2,…, c, and j = 1, 2, …, si.
Step 10: Calculate the fuzzy membership of each pixel’s intensity to each cluster using Eq. (6):
U j i
D j i D j i
i c
( , )
( , ) ( , )
. =
∑ = 1
1 1
(6)
Step 11: Calculate the membership-histogram matrix UH using Eq. (7):
UH j i( , )=U j i( , )q⋅H j( ). (7) Step 12: Calculate new centroid location C of each cluster using Eq. (8):
C i
UH j i I j UH j i j
si
j si ( )
( , ) ( ) ( , )
, =
⋅ ∑
∑ =
= 1
1
(8)
here i = 1, 2, …, c.
Step 13: Calculate the maximum difference error (dC) between new and old clusters using Eq. (9).
dC=max
(
C C0−)
, (9)here i = 1, 2,…, c.
Step 14: Go to Step (7).
Several stopping rules can be used. One is to terminate the algorithm when the relative change in the centroid values becomes small, or when the objective function can no longer be minimized. After that, defuzzification is performed by assigning the pixels to the clusters, for which those pixels have the maximum membership. A membership intensity map for each cluster is generated, and the most suitable cluster is selected for the next stage of the process: RG method implementation. The selection is carried out manually by a user who has to consider that the selected class membership should have the best contrast separation between the borders of the object and the background on the image. This will contribute to better segmentation using the RG method later.
Fig. 2 shows an example of the result of image enhancement. The input parameters for this example were number of clusters c = 3and fuzzification index
q = 6. From this example, cluster no. 3 was selected, as it represents the best contrast separation between the borders of the object and the background on the image (decision of operator based on visual impression).
Fig. 2. Manual selection of membership intensity map for three clusters (c = 3); in this case the best contrast
separation is shown in cluster no. 3
After images have been enhanced using FCM, their pixels’ intensities vary between 0 and 1, and need to be normalized in the range [0, 255]. The median filtering was also performed on the enhanced images using the default 3-by-3 neighbourhood, i.e., each output pixel obtains the median value of its 3-by-3 neighbourhood. This nonlinear filtering technique was used to reduce any noise present on images; it is a widely used technique that is very effective in removing noise while preserving edges [28].
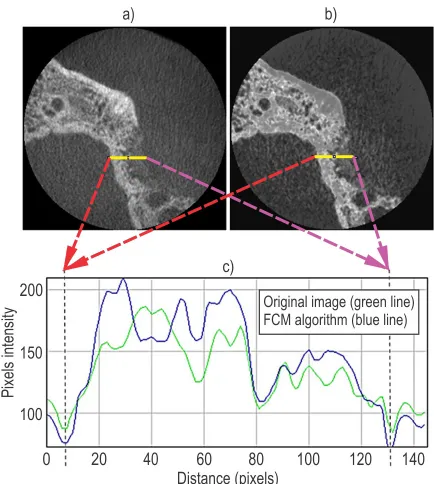
To verify the performances of the proposed enhancement of images using the FCM method, we have selected pixels along a 2D profile line that is arbitrarily drawn at the same location over an image before (Fig. 3a) and after enhancement (Fig. 3b). Intensities of pixels along these lines are compared to determine the differences between two images. The comparison from Fig. 3c shows that the enhancement procedure leads to the: 1) normalization of pixel intensities, 2) higher values of pixel intensities in the transition between low and high-intensity areas. The latter is a critical property since it will contribute to easier and better segmentation using the RG method that will follow.
Fig. 3. 2D profile line measurement on a) original image, b) enhanced image, c) graph showing the intensity of pixels on original image (green line) and after the improvement using FCM
(blue line)
1.2 Region Growing
Region growing (RG) is a method that has been widely used for image segmentation [29]. RG is a segmentation method where each region starts as a single seed element. At each iteration, the surrounding pixels are taken into account in order to determine whether the region should be expanded to include them or not, and this is controlled by a tolerance parameter t [29]. Various metrics can be used as a basis for region growing, and we have opted to employ
pixel’s intensity. The value of tolerance parameter t
image, it varies with each input image or 3D image dataset, and it is left for the user to define. However, the selection of initial seed for the segmentation also has a deep influence on the end results. How to assign initial seeds represents a major issue when it comes to application of the RG method [30]. To improve the accuracy of the RG method, we propose a method for seed selection that is based on the STD of pixels’ intensities in the regions. Specifically, the seed is selected from the region with the highest standard deviation of pixels’ intensities.
1.2.1 Initial Segmentation and Standard Deviation of Pixels’ Intensities
Seed selection procedure starts from initial, coarse, segmentation of the enhanced image. Initially segmented regions in the enhanced image are acquired via global image thresholding, which was performed using Otsu’s method [31] in which a global
threshold T was computed from image and in which
Otsu’s method chooses a threshold that minimizes the intraclass variance of the thresholded black and
white pixels. As a result, an initially binarized image is obtained which contains segmented regions. These regions are then applied as a mask to the enhanced image, and the STD of pixels’ intensities is calculated for each of them. In the subsequent steps, the seed will be selected from the region with the highest value of STD. This procedure is repetitive, and the initial seed is defined for each image separately.
The rationale behind this kind of selection of region where the seed will be placed is as follows. A large scattering of pixel intensities is typically encountered in the objects that need to be extracted from image, while the scattering of pixel intensities in surrounding tissue (which is, as a rule, homogeneous) is smaller. Since all pixels inside a region have different intensity values, the larger the deviations in pixel intensities are, the STD value will be larger.
For a random variable vector A (in this case pixel intensity vector) made up of N scalar observations, the standard deviation is defined according to Eq. (10):
σ = − ∑ −µ
= 1
1
2
1 N i Ai
N
( ) , (10)
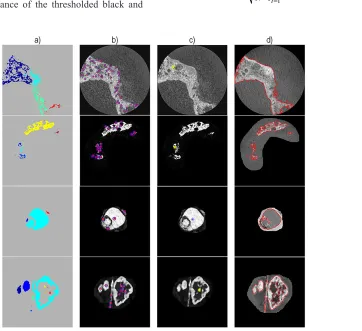
Fig. 4 The principle of proposed RG method for image no. 13 from CBCT 1, CBCT 2, MRI 1 and MRI 2 3D image dataset showing a) initial segmentation, b) location of all regions on an image, c) selected region with its initial seed for RG method,
where μ is the average value of vector A, as shown in Eq. (11):
µ = ∑
= 1
1 Ni Ai
N
. (11)
The proposed approach for coarse placement of seed has positive effect on the subsequent selection of initial seed and reduces the possibility for its mis-selection. Specifically, using the proposed procedure, the size of region does not affect the result. In addition, it is worth noting that regions within images that have been enhanced using FCM will have a larger value of STD due to scaled pixels’ intensities inside them; this will be helpful for better selection of initial seed because values of STD inside those regions will be more distinct. Following the definition of the initial
seed for each image, the tolerance parameter t which
will enable segmentation using RG method must be defined.
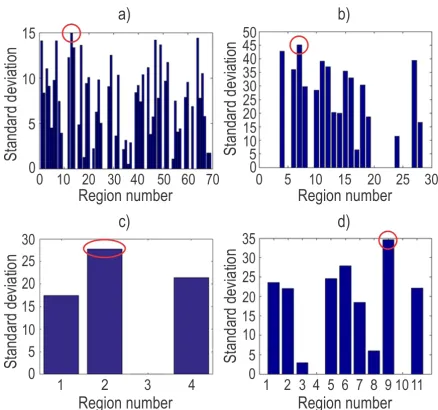
The results of the application of the proposed procedure for region selection and initial seed extraction are presented using relevant examples in Fig. 4. The plots of STD of pixel intensities in initially segmented regions, using image no. 13 as an example from all four image datasets, are presented in Fig. 5.
Fig. 5. STD plot of regions in image no. 13 from all image datasets (region with highest value of STD is marked red): a) CBCT 1 dataset (region no. 13), b) CBCT 2 dataset (region no. 7), c) MRI 1 dataset
(region no.2), d) MRI 2 dataset (region no. 9)
Since the FCM method enhances the boundaries of objects very well, the automated RG method can successfully segment the objects of interest from the enhanced images in order to obtain more accurate binary 2D images needed for 3D reconstruction. The
results of the real-world image segmentation carried out by RG based on pixel intensities are presented in Fig. 4d. As a final step after the images have been segmented, some minor postprocessing is required in order to remove the small pixels surrounding the segmented object of interest with the use of morphological operations (dilation and erosion).
1.2.2 Seed Selection
When the region with the highest STD has been determined, it would be convenient to select its centre as the initial seed for the RG method. However, since regions can vary from simple shape to a very complex and irregular shape, the centre can be placed outside the region. To assure that the initial seed remains inside the region with the highest STD, we have developed a new method.
In this method, the basic principle is the skeletonization or thinning [32] of the region with the highest STD. As a result, the thinned skeleton (or lines) of the region is generated; it consists of many consecutive points with their (X,Y) coordinates. By extracting the middle pair of coordinates, the coordinates for the initial seed are determined. In this way, it is guaranteed that the selected seed remains inside the defined region with the maximum STD, which allows a proper segmentation using the RG method.
Fig. 6. Proposed method on seed selection showing a) original image, b) skeletonization of regions using the proposed
approach for seed selection, c) locations of seeds of all regions present on image shown in red (centre of mass-based)
and blue (proposed approach)
From Fig. 6c it can be seen that the red shows incorrectly defined seeds that are outside of the regions. In some specific applications, centre of mass-based seed selection presents an acceptable solution but regarding more complex and irregular shapes, it will not provide acceptable results. When the proposed skeletonization based approach is employed, the complexity of shapes does not represent an issue (shown in blue), which additionally contributes to the overall accuracy and stability of the presented approach.
2 EXPERIMENTAL
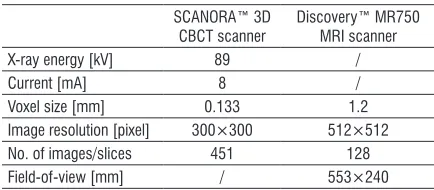
Performance evaluation of the proposed method was carried on two CBCT 3D image datasets and two MRI 3D image datasets. Datasets used in this study were acquired anonymously, where all patient information was erased. The CBCT datasets are collected from the Department of Dentistry, Medical Faculty, University of Novi Sad, using a SCANORA™ 3D medical imaging device from Soredex, while MRI datasets were collected from the Department of Radiology, Medical Faculty, University of Novi Sad, using a Discovery™ MR750 medical imaging system from GE Healthcare. Acquisition parameters are shown in Table 1.
Table 1. Acquisition parameters used for the presented case studies on CBCT and MRI imaging scanners
SCANORA™ 3D
CBCT scanner Discovery™ MR750MRI scanner
X-ray energy [kV] 89 /
Current [mA] 8 /
Voxel size [mm] 0.133 1.2
Image resolution [pixel] 300×300 512×512
No. of images/slices 451 128
Field-of-view [mm] / 553×240
CBCT and MRI imaging systems were selected for this study due to their availability at the radiology department at the local clinical centre. While MRI datasets have perhaps more trivial and relatively distinct boundaries, two CBCT image datasets have more generally weak and indistinct boundaries due to the porosity of the maxilla bone.
After sifting through all the images related to each patient, only corrupted images on CBCT 3D image datasets and images containing tumour on MRI 3D image datasets were used for experimental analysis. A radiologist with over ten years of experience and who is responsible for interpreting medical records at the local clinical centre performed manual segmentation
of all medical images using commercial medical image processing software 3D-DOCTOR v4.0 from Able Software Corp. Results of this manual segmentation provided binary segmented images that will be used as a foundation for evaluation. The proposed method was implemented in the R2018b version of MATLAB (Mathworks, Inc., Natick, MA, USA) on a PC (FUJITSU CELSIUS M470-2) with Intel(R) Xeon(R) CPU E5645, 2.40 GHz processor, and 16 GB RAM. The operating system used was Windows 7 (64-bit).
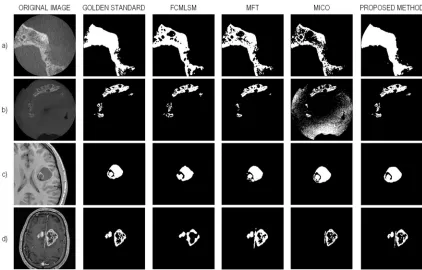
The segmented images obtained using the proposed method and other segmentation methods; fuzzy clustering method with level set method (FCMLSM) from [20], multi-region fuzzy thresholding method (MFT) from [22] and multiplicative intrinsic component optimization (MICO) from [21] were all individually compared against their corresponding manually segmented images obtained from the radiologist, in order to test the segmentation accuracy. As a result, performance measures, such as Dice coefficient, Jaccard index, sensitivity, and accuracy, are calculated. The proposed method and other methods were tested on all four 3D image datasets.
Fig. 7 shows the results of compared segmentation techniques, i.e. the final contours of the bone from CBCT 1 (Fig. 7a), CBCT 2 (Fig. 7b), MRI 1 (Fig. 7c) and MRI 2 (Fig. 7d) 3D image dataset on one image from each 3D image dataset. Two CBCT 3D image datasets were especially important for segmentation since the CBCT systems are prone to noise [33] and [34] and successful analysis of CBCT acquired images is of great importance. The two CBCT datasets contain the images of the upper maxilla, frequently used in the field of oral surgery and for other applications in dentistry, such as designing and fabrication of patient-specific bone grafts [35] where accurate segmentation and extraction of initial 3D models is extremely important. These two 3D image datasets were also important for the analysis since the bone structure of the maxilla is porous and is difficult to properly acquire its bone structure by CBCT systems.
Fig. 7 shows the results of compared segmentation techniques, i.e. the final contours of a tumour on brain MRI images. MRI 1 and MRI 2 3D image datasets were used and, for this purpose, an ROI tool was used to localize the tumour. All four segmentation methods, including the proposed method, were used to segment the two image datasets.
2.1 Performance Analysis of Seed Selection of RG Method
image datasets. A performance analysis of the seed selection method using CBCT and MRI 3D image datasets is presented in Table 2.
Table 2. Performance analysis for seed selection on all four 3D image datasets
Dataset Total no. of images imagesUsed correctly detectedInitial seed Accuracy[%]
CBCT 1 303 16 16 100
CBCT 2 57 57 52 91.22
MRI 1 49 30 29 96.67
MRI 2 47 47 40 85.11
In the CBCT 1 dataset, all initial seeds were accurately detected inside a bone structure for all images, while in the CBCT 2 dataset the initial seed for RG method was not properly defined for the first five images. For MRI 1 dataset the initial seed was not selected properly only for the first image. This was also the case for MRI 2 dataset where on the first seven images the beginning of the tumour and the region is too small compared to the surrounding tissue for method to accurately define the initial seed. However, this did not further influence the 3D reconstruction process, and it will be dealt with in future research to overcome this issue.
2.2 Classification Performance
The performance of the proposed method and other segmentation methods was evaluated using two metrics: sensitivity and accuracy.
The sensitivity (S) is defined as the percentage
of pixels correctly classified with respect to the number of pixels in the foundation for evaluation. The accuracy (A) is defined as the ratio of the correctly classified pixels and incorrectly classified pixels to the total number of pixels, as shown in Eqs. (12) and (13):
S TP
TP FN =
+ , (12)
A TP TN
TP FN TN FP
= +
+ + + , (13)
where TP (true positive) represents the number of
pixels that were correctly detected and TN (true
negative) represents the number of background pixels.
FN (false negative) denotes the pixels belonging
to the segmented region, but wrongly classified as
the background pixels, and FP (false positive) is
the number of pixels incorrectly classified as the segmented region.
Fig. 7 Results of compared segmentation techniques for image no. 13 from a) CBCT 1, b) CBCT 2, c) MRI 1 and d) MRI 2 3D image dataset for FCMLSM [20], MFT [22], MICO [21], and proposed method (for CBCT 1: C=3, q=6, t=25, for CBCT 2: C=3, q=2, t=40, for MRI 1: C=3, q=2,
Fig. 8 presents the results of the comparative analysis of the proposed method, FCMLSM [20],
MFT [22] and MICO [21] when compared to images
from the foundation for evaluation. They were tested for sensitivity and accuracy performance. These two metrics were evaluated for all four 3D image datasets.
For the CBCT 1 image dataset (Fig. 8a), it can be noted that the proposed method outperforms all other methods in terms of sensitivity and accuracy. In the CBCT 2 image dataset (Fig. 8b), it can also be observed that the proposed method excels when compared with other methods for sensitivity. For accuracy performance, the FCMLSM method [20] performs better.
For analysis of the MRI 1 image dataset (Fig. 8c), the MFT [22] method was not taken into account due to its having the lowest performance results when compared to the other methods. The proposed method outperforms the FCMLSM [20] and MICO [21] segmentation methods for the MRI 1 image dataset, both for sensitivity and accuracy.
In the MRI 2 image dataset (Fig. 8d), it can be seen that FCMLSM [20] outperforms the proposed method in terms of sensitivity, while with regard to accuracy, the proposed method shows better results than other segmentation methods.
Table 3 summarizes the evaluation results of the proposed method and other segmentation methods. It can be observed that, overall, the proposed method shows better results regarding the accuracy performance in comparison to other methods, except for the CBCT 2 image dataset for which the FCMLSM
method [20] excels with results of 95.69. Regarding
the sensitivity, the proposed method also shows good results, except for the MRI 2 image dataset for which the MICO method [21] obtained higher results of 88.93.
Table 3. The average value of the classification performance metrics using the FCMLSM [20], MFT [22], MICO [21] and the proposed method
Image set
FCMLSM [%]
MFT [%]
MICO [%]
Proposed method [%]
S A S A S A S A
CBCT 1 87.1 97.4 93.8 77.7 48.2 90.1 99 98.4
CBCT 2 32.6 95.7 45.5 89.3 41.8 76.4 47.2 89.9
MRI 1 94.2 99.9 51.2 99.8 98.6 99.9 99.1 100
MRI 2 80.1 99.4 53.4 99.4 88.9 97.2 75.6 99.6
2.3 Segmentation Performance
To determine the segmentation accuracy and to measure the segmentation performance of the proposed method and three other methods against the foundational images, Dice coefficient and Jaccard index were used.
The mean values of Dice coefficient and Jaccard index for all four datasets and tested methods are listed in Table 4.The mean values of Dice and Jaccard for the CBCT 1 and CBCT 2 3D image dataset for the proposed method are 0.95, 0.88, and 0.60, 0.51, respectively, while for the MRI 1 and MRI 2 3D image dataset those values are 0.96, 0.93 and 0.81, 0.70, respectively. It can be seen from Table 4 that the proposed method significantly improves both
bone and soft tissue detection (brain tumour), based on all similarity indices, and it outperforms all other segmentation methods for all four image datasets. This indicates that the proposed method extracts the defined regions from both CBCT and MRI image datasets with higher accuracy.
Table 4. The average value of the segmentation performance metrics (Dice coefficient and Jaccard index) using the FCMLSM
[20], MFT [22], MICO [21] and the proposed method
Image set
FCMLSM MFT MICO Proposed
method
DC JI DC JI DC JI DC JI
CBCT 1 0.91 0.85 0.84 0.73 0.62 0.45 0.95 0.88 CBCT 2 0.58 0.48 0.59 0.46 0.30 0.19 0.60 0.51
MRI 1 0.90 0.85 0.77 0.69 0.91 0.85 0.96 0.93
MRI 2 0.77 0.65 0.80 0.69 0.80 0.69 0.81 0.70
2.4 CAD-Inspection
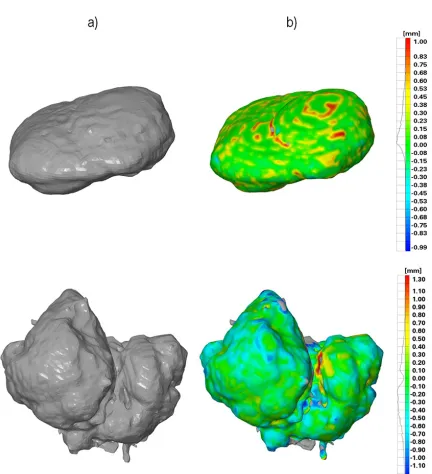
CAD-Inspection has shown to be a valuable tool in current applications with regard to the dimensional inspection of 3D models. Since the proposed method can segment the 3D image dataset, MATLAB was used for the reconstruction of 3D models of a tumour located in the MRI 1 and MRI 2 3D image datasets. Reconstructed 3D models were then exported in STL file format (Fig. 9a). A 3D model from ground truth images was generated using software 3D-DOCTOR. For CAD-Inspection, GOM
Inspect v2016software was used (Fig. 9b); the results
of the inspection are presented in Table 5.
From the results presented in Fig. 9 and Table 5, it can be observed that the deviations for 3D model generated from the MRI 1 image dataset are distributed in the range from –0.15 mm up to +0.52 mm, and the majority of deviations are located around +0.05 mm. Small values of standard deviation of +0.23 and mean distance of +0.16 show good accuracy of the overlapped 3D model with the foundational 3D model with the distance of ±0.99 mm. For the MRI 2 image dataset, deviations are in the range from -0.75 mm to +0.45 mm, with the majority of deviations located at the –0.15 mm mark. Standard deviation and mean value have smaller values, and they are +0.44 mm and –0.22 mm, respectively. The minimum and
maximum distance are in the range of ±1.30 mm.
The dimensional analysis also showed some minor irregularities, which can be seen in certain areas on both inspections of the 3D models. This could be the result of surface shape, but also of the algorithm used for 3D reconstruction.
Fig. 9. a) 3D model generated from MRI 1 and MRI 2 3D image datasets using the proposed method in MATLAB software, and b) CAD inspection of 3D models generated using proposed
method compared to the ground truth 3D models in software GOM Inspect v2016
Table 5. Results from CAD Inspection using the proposed method
3D image dataset
Deviation range [mm]
Min. dist. [mm]
Max. dist. [mm]
Distance STD [mm]
Mean distance
[mm]
MRI 1 +0.52–0.15 –0.99 +0.99 +0.23 +0.16
MRI 2 +0.45–0.75 –1.30 +1.30 +0.44 –0.22
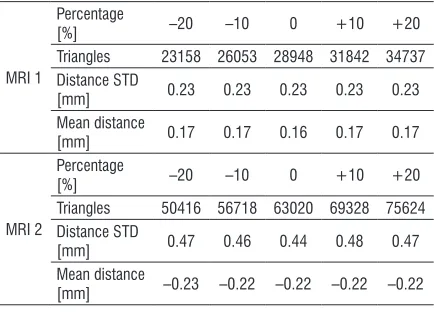
triangles count does not have a major impact on the accuracy results from CAD-Inspection.
Table 6. Sensitivity analysis of triangles count on CAD-Inspection results for MRI 1 and MRI 2 datasets
MRI 1
Percentage
[%] –20 –10 0 +10 +20
Triangles 23158 26053 28948 31842 34737
Distance STD
[mm] 0.23 0.23 0.23 0.23 0.23
Mean distance
[mm] 0.17 0.17 0.16 0.17 0.17
MRI 2
Percentage
[%] –20 –10 0 +10 +20
Triangles 50416 56718 63020 69328 75624
Distance STD
[mm] 0.47 0.46 0.44 0.48 0.47
Mean distance
[mm] –0.23 –0.22 –0.22 –0.22 –0.22
3 DISCUSSION
Accurate segmentation is crucial for proper reconstruction of surface 3D models, due to the fact that it enables proper extraction of objects of interest. The results obtained in this paper confirm that the proposed method based on a combination of fuzzy C-means clustering and region growing shows good results when compared with other segmentation methods for segmentation accuracy and sensitivity. The new RG method for seed selection based on STD values shows good accuracy and robustness when tested on all four 3D image datasets. However, future improvements can be made to deal with the issue of the mis-selection of seed for the first few images of 3D image dataset (lowest percentage accuracy was 85.11 for MRI 2 image dataset).
Regarding the statistical evaluators, Dice coefficient and Jaccard index, the proposed method shows very good results, outperforming all other segmentation methods in [20] to [22] for all four 3D image datasets. When the 3D image datasets are evaluated for segmentation accuracy and sensitivity, it can be seen that the proposed method excels other methods on three 3D image datasets (CBCT 1, CBCT 2 and MRI 1) regarding both accuracy and sensitivity, but shows lower results for sensitivity in the MRI 2 image dataset with 75.6, compared with the method
in [21] with an obtained value of 88.9. The reason
for better performance of the proposed method for CBCT datasets definitely lies in the blurriness if the images and due to the presence of the artefacts on the
3D dataset. Accurate delineation of objects borders is superior for those datasets.
As a final step for the evaluation of 3D models obtained by the proposed method, CAD inspection was performed by using the MRI 1 and MRI 2 image datasets. This inspection confirms the high accuracy of the proposed method in comparison to the 3D model obtained from ground truth images.
4 CONCLUSIONS
FCM clustering enabled the adaptive enhancement of objects of interest in images, and therefore served as an effective preprocessing for RG segmentation. Future work will focus on further improvements. For example, an automated method will be implemented in terms of automatically determining the number of clusters in FCM clustering, such as that proposed
in [36] to [38]. In this way, the goal is to eliminate
operator assistance during the processing stage. Also, the proposed method will be put into a friendlier graphical user interface which will enable more interactive use. Although images obtained from only CBCT and MRI scanners were used for this study, it does not limit the use of the proposed method on images obtained from other imaging systems as well, and future research will also include this investigation.
5 ACKNOWLEDGEMENTS
This paper presents the results achieved in the framework of the project 114-451-2723/2016-03 funded by the Provincial Secretariat for Higher Education and Scientific Research, and within the project TR-35020, funded by the Ministry of Education, Science and Technological Development of the Republic of Serbia.
6 REFERENCES
[1] Galeta, T., Pakši, I., Šišić, D., Knežević, M. (2017). Comparison
of 3D scanned kidney stone model versus computer-generated models from medical images. Advances in Production Engineering & Management, vol. 12, no. 3, p. 254-264,
DOI:10.14743/apem2017.3.256.
[2] Budzik, G., Burek, J., Bazan, A., Turek, P. (2016). Analysis of the accuracy of reconstructed two teeth models manufactured using the 3DP and FDM technologies. Strojniški vestnik - Journal of Mechanical Engineering, vol. 62, no. 1, p. 11-20,
DOI:10.5545/sv-jme.2015.2699.
Advances in Production Engineering & Management, vol. 13, no. 3, p. 267-278, DOI:10.14743/apem2018.3.289.
[4] Van Eijnatten, M., Koivisto, J., Karhu, K., Forouzanfar, T., Wolff, J. (2017). The impact of manual threshold selection in medical additive manufacturing. International Journal of Computer Assisted Radiology and Surgery, vol. 12, no. 4, p. 607-615,
DOI:10.1007/s11548-016-1490-4.
[5] Zhang, J., Malcolm, D., Hislop-Jambrich, J., Thomas, C.D.L., Nielsen, P.M.F. (2014). An anatomical region-based statistical shape model of the human femur. Computer Methods in Biomechanics and Biomedical Engineering: Imaging & Visualization, vol. 2, no. 3, p. 176-185, DOI:10.1080/216811 63.2013.878668.
[6] Budzik, G., Turek, P. (2018). Improved accuracy of mandible geometry reconstruction at the stage of data processing and modeling. Australasian Physical & Engineering Sciences in Medicine, vol. 41, no. 3, p. 687-695, DOI:10.1007/s13246-018-0664-5.
[7] Ford, J.M., Decker, S.J. (2016). Computed tomography slice thickness and its effects on three-dimensional reconstruction of anatomical structures. Journal of Forensic Radiology and Imaging, vol. 4, p. 43-46, DOI:10.1016/j.jofri.2015.10.004.
[8] Makitie, A., Paloheimo, M., Bjorkstrand, R., Paloheimo, K., Tuomi, J., Salmi, M. (2009). Medical applications of rapid prototyping - from applications to classification. da Silva Bartolo, P.J., Jorge, M.A., da Conceicao Batista, F., Almeida, H.A., Matias, J.M., Vasco, J.C., Gaspar, J.B., Correia, M.A., Andre, N.C., Alves, N.F., Novo, P.P., Martinho, P.G., Carvalho, R.A. (Eds.), Innovative Developments in Design and Manufacturing. CRC Press, Boca Raton, p. 701-704,
DOI:10.1201/9780203859476.ch109.
[9] Huotilainen, E., Jaanimets, R., Valášek, J., Marcián, P., Salmi, M., Tuomi, J., Mäkitie, A., Wolff, J. (2014). Inaccuracies in additive manufactured medical skull models caused by the DICOM to STL conversion process. Journal of Cranio - Maxillofacial Surgery, vol. 42, no. 5, p. e259-e265.
DOI:10.1016/j.jcms.2013.10.001.
[10] Salmi, M., Tuomi, J., Paloheimo, K., Paloheimo, M., Björkstrand, R., Makitie, A.A., Mesimaki, K., Kontio, R. (2009). Digital design and rapid manufacturing in orbital wall reconstruction. da Silva Bartolo, P.J., Jorge, M.A., da Conceicao Batista, F., Almeida, H.A., Matias, J.M., Vasco, J.C., Gaspar, J.B., Correia, M.A., Andre, N.C., Alves, N.F., Novo, P.P., Martinho, P.G., Carvalho, R.A. (Eds.), Innovative Developments in Design and Manufacturing. CRC Press, Boca Raton, p. 339-342, DOI:10.1201/9780203859476.ch52.
[11] Sonka, M., Hlavac V., Boyle, R. (1999). Image Processing, Analysis, and Machine Vision, PWS Publishing, Pacific Grove.
[12] Chaira, T. (2014). An improved medical image enhancement scheme using Type II fuzzy set. Applied Soft Computing, vol. 25, p. 293-308, DOI:10.1016/j.asoc.2014.09.004.
[13] Ooi, C.H., Kong, N.S.P., Ibrahim, H. (2009). Bi-histogram equalization with a plateau limit for digital image enhancement. IEEE Transactions on Consumer Electronics, vol. 55, no. 4, p. 2072-2080, DOI:10.1109/TCE.2009.5373771.
[14] Guo, Y., Şengür, A., Ye, J. (2014). A novel image
thresholding algorithm based on neutrosophic similarity
score. Measurement, vol. 58, p. 175-186, DOI:10.1016/j. measurement.2014.08.039.
[15] Finkšt, T., Tasič, J.F., Zorman Terčelj, M., Meža, M. (2017).
Classification of malignancy in suspicious lesions using autofluorescence bronchoscopy. Strojniški vestnik - Journal of Mechanical Engineering, vol. 63, no. 12, p. 685-695,
DOI:10.5545/sv-jme.2016.4019.
[16] Finkšt, T., Tasič, J.F., Terčelj-Zorman, M., Zajc, M. (2012).
Autofluorescence bronchoscopy image processing in the selected colour spaces. Strojniški vestnik - Journal of Mechanical Engineering, vol. 58, no. 9, p. 501-508,
DOI:10.5545/sv-jme.2012.350.
[17] Martinović, M., Stoić, A., Kiš, D. (2008). Segmentation of the
CT image using self-organizing neural networks. Tehnički vjesnik - Technical Gazette, vol. 15, no. 4, p. 23-28.
[18] Žagar, M., Kovač, M., Hofman, D. (2012). Framework for
4D medical data compression. Tehnički vjesnik - Technical Gazette, vol. 19, no. 1, p. 99-105.
[19] Zhao, X., Wu, Y., Song, G., Li, Z., Zhang, Y., Fan, Y. (2018). A deep learning model integrating FCNNs and CRFs for brain tumour segmentation. Medical Image Analysis, vol. 43, p. 98-111, DOI:10.1016/j.media.2017.10.002.
[20] Li, B.N., Chui, C.K., Chang, S., Ong, S.H. (2011). Integrating spatial fuzzy clustering with level set methods for automated medical image segmentation. Computers in Biology and Medicine, vol. 41, no. 1, p. 1-10, DOI:10.1016/j. compbiomed.2010.10.007.
[21] Li, C., Gore, J.C., Davatzikos, C. (2014). Multiplicative intrinsic component optimization (MICO) for MRI bias field estimation and tissue segmentation. Magnetic Resonance Imaging, vol. 32, no. 7, p. 913-923, DOI:10.1016/j.mri.2014.03.010.
[22] Aja-Fernández, S., Curiale, A.H., Vegas-Sánchez-Ferrero, G. (2015). A local fuzzy thresholding methodology for multiregion image segmentation. Knowledge-Based Systems, vol. 83, no. 1, p. 1-12, DOI:10.1016/j.knosys.2015.02.029.
[23] Gupta, D., Anand, R.S., Tyagi, B. (2015). A hybrid segmentation method based on Gaussian kernel fuzzy clustering and region based active contour model for ultrasound medical images.
Biomedical Signal Processing and Control, vol. 16, p. 98-112,
DOI:10.1016/j.bspc.2014.09.013.
[24] Rastgarpour, M., Shanbehzadeh, J., Soltanian-Zadeh, H. (2014). A hybrid method based on fuzzy clustering and local region-based level set for segmentation of inhomogeneous medical images. Journal of Medical Systems, vol. 38, no. 8, p. 1-15, DOI:10.1007/s10916-014-0068-3.
[25] Vishnuvarthanan, G., Pallikonda Rajasekaran, M., Subbaraj, P., Vishnuvarthanan, A. (2016). An unsupervised learning method with clustering approach for tumour identification and tissue segmentation in magnetic resonance brain. Applied Soft Computing, vol. 38, p. 190-212, DOI:10.4172/jceni.1000101.
[26] Mousavi, M., Yap, H.J., Musa, S.N., Dawal, S.Z.M. (2017). A fuzzy hybrid GA-PSO algorithm for multi-objective AGV scheduling in FMS. International Journal of Simulation Modelling, vol. 16, no. 1, p. 58-71, DOI:10.2507/IJSIMM16(1)5.368.
[27] Bezdek, J.C. (1983). Pattern recognition with fuzzy objective function algorithms. SIAM Review, vol. 25, no. 3. p. 442-442,
[28] Zhu, Y., Huang, C. (2012). An Improved median filtering algorithm for image noise reduction. Physics Procedia, vol. 25, p. 609-616, DOI:10.1016/j.phpro.2012.03.133.
[29] Fan, J., Zeng, G., Body, M., Hacid, M.S. (2005). Seeded region growing: An extensive and comparative study.
Pattern Recognition Letters, vol. 26, no. 8, p. 1139-1156,
DOI:10.1016/j.patrec.2004.10.010.
[30] Mehnert, A., Jackway, P. (1997). An improved seeded region growing algorithm. Pattern Recognition Letters, vol. 18, no. 10, p. 1065-1071, DOI:10.1016/S0167-8655(97)00131-1.
[31] Otsu, N. (1979). A threshold selection method from gray-level histograms. IEEE Transactions on Systems, Man, and Cybernetics, vol. 9, no. 1, p. 62-66, DOI:10.1109/ TSMC.1979.4310076.
[32] Abu-Ain, W., Abdullah, S.N.H.S., Bataineh, B., Abu-Ain, T., Omar, K. (2013). Skeletonization algorithm for binary images.
Procedia Technology, vol. 11, p. 704-709, DOI:10.1016/j. protcy.2013.12.248.
[33] Schulze, R., Heil, U., Groß, D., Bruellmann, D.D., Dranischnikow, E., Schwanecke, U., Schoemer, E. (2011). Artefacts in CBCT: A review. Dentomaxillofacial Radiology, vol. 40, no. 5, p. 265-273, DOI:10.1259/dmfr/30642039.
[34] Fox, A., Basrani, B., Kishen, A., Lam, E.W.N. (2018). A novel method for characterizing beam hardening artifacts in cone-beam computed tomographic images. Journal of Endodontics, vol. 44, no. 5, p. 869-874, DOI:10.1016/J.JOEN.2018.02.005.
[35] Budak, I., Mirkovic, S., Sokac, M., Santosi, Z., Puskar, T., Vukelic, D. (2016). An approach to modelling of personalized bone grafts based on advanced technologies. International Journal of Simulation Modelling, vol. 15, no. 4, p. 637-648,
DOI:10.2507/IJSIMM15(4)5.357.
[36] Ghaffarian, S., Ghaffarian S. (2014). Automatic histogram-based fuzzy C-means clustering for remote sensing imagery.
ISPRS Journal of Photogrammetry and Remote Sensing, vol. 97, p. 46-57, DOI:10.1016/j.isprsjprs.2014.08.006.
[37] Zhang, Y., Mańdziuk, J., Quek, C.H., Goh, B.W. (2017).
Curvature-based method for determining the number of clusters. Information Sciences, vol. 415-416, p. 414-428,
DOI:10.1016/j.ins.2017.05.024.
![Fig. 8. Results of sensitivity and accuracy comparison between FCMLSM [20], MFT [22], MICO [21] and proposed method for a) CBCT 1, b) CBCT 2, c) MRI 1, d) MRI 2 3D image dataset](https://thumb-us.123doks.com/thumbv2/123dok_us/8947966.1857334/9.598.65.519.85.276/results-sensitivity-accuracy-comparison-fcmlsm-proposed-method-dataset.webp)