T E C H N I C A L A D V A N C E
Open Access
Removing reference mapping biases using
limited or no genotype data identifies allelic
differences in protein binding at
disease-associated loci
Martin L. Buchkovich
1, Karl Eklund
1, Qing Duan
1, Yun Li
1,2,3, Karen L. Mohlke
1†and Terrence S. Furey
1,4*†Abstract
Background:Genetic variation can alter transcriptional regulatory activity contributing to variation in complex traits and risk of disease, but identifying individual variants that affect regulatory activity has been challenging.
Quantitative sequence-based experiments such as ChIP-seq and DNase-seq can detect sites of allelic imbalance where alleles contribute disproportionately to the overall signal suggesting allelic differences in regulatory activity. Methods:We created an allelic imbalance detection pipeline, AA-ALIGNER, to remove reference mapping biases influencing allelic imbalance detection and evaluate accuracy of allelic imbalance predictions in the absence of complete genotype data. Using the sequence aligner, GSNAP, and varying amounts of genotype information to remove mapping biases we investigated the accuracy of allelic imbalance detection (binomial test) in CREB1 ChIP-seq reads from the GM12878 cell line. Additionally we thoroughly evaluated the influence of experimental and analytical parameters on imbalance detection.
Results:Compared to imbalances identified using complete genotypes, using imputed partial sample genotypes, AA-ALIGNER detected >95 % of imbalances with >90 % accuracy. AA-ALIGNER performed nearly as well using common variants when genotypes were unknown. In contrast, predicting additional heterozygous sites and imbalances using the sequence data led to >50 % false positive rates. We evaluated effects of experimental data characteristics and key analytical parameter settings on imbalance detection. Overall, total base coverage and signal dispersion across the genome most affected our ability to detect imbalances, while parameters such as imbalance significance, imputation quality thresholds, and alignment mismatches had little effect. To assess the biological relevance of imbalance predictions, we used electrophoretic mobility shift assays to functionally test for predicted allelic differences in CREB1 binding in the GM12878 lymphoblast cell line. Six of nine tested variants exhibited allelic differences in binding. Two of these variants, rs2382818 and rs713875, are located within inflammatory bowel disease-associated loci.
Conclusions:AA-ALIGNER accurately detects allelic imbalance in quantitative sequence data using partial genotypes or common variants filling a critical methodological gap in these analyses, as full genotypes are rarely available. Importantly, we demonstrate how experimental and analytical features impact imbalance detection providing guidance for similar future studies.
Keywords:Allelic imbalance, Genome mapping bias, Transcription factor binding, CREB1, Inflammatory bowel disease, Alleles, GWAS, ChIP-seq
* Correspondence:[email protected] †Equal contributors
1
Department of Genetics, University of North Carolina, Chapel Hill, NC 27599, USA
4
Department of Biology, University of North Carolina, Chapel Hill, NC 27599, USA
Full list of author information is available at the end of the article
© 2015 Buchkovich et al. This is an Open Access article distributed under the terms of the Creative Commons Attribution License (http://creativecommons.org/licenses/by/4.0), which permits unrestricted use, distribution, and reproduction in any medium, provided the original work is properly credited. The Creative Commons Public Domain Dedication waiver (http:// creativecommons.org/publicdomain/zero/1.0/) applies to the data made available in this article, unless otherwise stated. Buchkovichet al. BMC Medical Genomics (2015) 8:43
Background
Genetic studies of complex traits and diseases have been increasing their focus on the contribution of gene transcrip-tional regulation. The majority of complex trait-associated variants are in non-coding regions [1], suggesting many contribute by altering regulatory activity. Variants can alter transcription factor binding affinity, subsequently affecting transcription levels of target genes [1]. For example, the T allele of rs12740374 increases C/EBPa binding and tran-scription of SORT1, a gene influencing LDL cholesterol level [2]. Identifying precisely which genetic variants are responsible for changing regulatory activity can be difficult.
Quantitative short-read sequence data generated from experiments such as ChIP-seq [3], DNase-seq [4], FAIRE-seq [5], and ATAC-FAIRE-seq [6] broadly identify genomic regions that regulate gene transcription. Sequence infor-mation from these experiments can be used to detect allele-specific activity in samples where heterozygous variants are present in or near a regulatory element. For example, an uneven distribution in the number of reads containing each allele at a heterozygous site, referred to as allelic imbalance, provides evidence for differential regula-tory activity due to genetic variation. Previous studies have also used quantitative short-read data to correlate genetic variation in regulatory regions with nearby gene expres-sion [7, 8] and to show the heritability of allelic regulatory effects [8–12].
Quantitative sequence data have been generated in hundreds of cell types and tissues by the ENCODE (Encyclopedia of DNA elements) Consortium [13] and Roadmap Epigenomics Project [14]. Offering a valuable source of genetic regulatory information. Exploration of allelic imbalance in this data is hindered by a lack of complete genotype information for individuals from which these data are derived, and the well-established alignment bias that arises when both alleles at a heterozygous site are not considered during alignment to a reference gen-ome. Sequence reads containing the allele not repre-sented in the reference genome are penalized as an additional mismatch compared to reads containing the reference allele [15], and are less likely to map to the correct genomic location (Additional file 1: Figure S1). This can result in false detection of allelic imbalance favoring the reference allele, or failure to detect imbal-ance favoring the non-reference allele. Several methods for removing this alignment bias have been proposed, including masking known variants in the reference gen-ome [15], aligning reads to two haplotype reference ge-nomes [16–21], using known variants with allele-aware aligners [7, 8, 22] or creating an extended reference genome that included alternate alleles [23]. For these methods, full genotype information leads to the best re-sults, but this data is rarely available. The performance of these methods using limited or no sample genotype
data, compared to full genotype information has not been thoroughly investigated.
To evaluate detection of altered regulatory activity due to genetic variation in quantitative sequence data using full, limited or no genotype information, we created a computational analysis pipeline, called AA-ALIGNER (Allele-Aware ALignments for the Investigation of GeN-etic Effects on Regulation). AA-ALIGNER strategically incorporates existing, publicly available tools to accurately annotate regions containing heterozygous variants given varying levels of genotype information, including no geno-types. To remove alignment biases at heterozygous vari-ants, AA-ALIGNER uses the allele-aware aligner GSNAP [24] which has been previously shown to remove mapping biases using complete genotype information [22]. AA-ALIGNER also attempts to correct other biases that can influence imbalance detection, such as incorrect heterozygous site annotations in reference genome sequences and incorrectly detected imbalances due to differences in mappability between reads containing each of the alleles or due to PCR duplications intro-duced during sequencing [25].
We demonstrate that GSNAP also removes mapping biases using partial genotype data or common variants allowing for accurate identification of allelic imbalances. Using AA-ALIGNER, we determined the effect of experi-mental and analytical variables such as sequence read length, sequencing depth, number of mismatches allowed during alignment, and imputation quality thresholds on accurate allelic imbalance detection. Our analyses used data from one DNase-seq and thirteen ChIP-seq experi-ments generated in the GM12878 lymphoblastoid cell line, for which both complete, sequencing-based genotype and partial, array-based genotype information is available. We experimentally detected differential protein binding at six of nine tested imbalance predictions from AA-ALIGNER for CREB1 (Cyclic-AMP Responsive Element Binding protein 1) binding in GM12878 ChIP-seq data, including imbalances at two disease-associated loci. Overall, our re-sults provide important empirical data that can be used to guide the design of and interpretation of similar studies using AA-ALIGNER to accurately annotate heterozygous sites and detect genetically-driven changes in regulatory element activity.
Methods
Genotype data
with default parameter settings and the reference panel from the 1000 Genomes Project Phase I version 3 (2012-03-14 release). Chromosome X genotype data in the 53 samples were pre-phased using MaCH [28] with options –states 500 and –rounds 400 and then imputed using minimac [29] with options –state 10 and –rounds 10. Post-imputation filtering of variants according to Rsq was performed as previously reported [30].
Common alleles (MAF > 0.05) used to derive the initial custom reference genome were based on 1000 Genomes Phase I version 3 EUR population [31].
Custom reference creation
The initial European-specific reference genome was cre-ated by replacing alleles in the hg19 reference sequence with the major allele for all common variants (MAF > .05) from the 1000 Genomes EUR population. The GM12878 custom reference was created by further modifying this initial custom reference by replacing non-reference homo-zygous variants with the new allele, based on information from either the full genotype or partial genotype.
Quantitative sequence data processing
Sequence fastq files (Additional file 2: Table S4) were downloaded from the UCSC Genome browser ENCODE Project [26]. Sequences from each replicate were filtered with fastx_trimmer using options ‘-f 1 -l 50 –Q 33’and fastq_quality_filter using options ‘-Q 33–p 90–q 20–I
N’whereNis the length of the reads in that dataset. Standard GSNAP alignments were performed using the following options: −-sampling = 1,−-terminal-threshold = 10, −n 1, −-query-unk-mismatch = 1, − -genome-unk-mismatch = 1, −-trim-mismatch-score = 0, −t 7, and -A sam. The k-mer size parameter was set based on read length: −k = 15 (50 bp);−k = 11 (35 bp);−k = 10 (20 bp)
with –-basesize set to k-mer size. As we increased the number of mismatches allowed during alignment to m, we changed the option–m tomand–i tom+ 1 to dis-allow indels during alignment. The directory containing the GSNAP reference genome was specified with –D the genome name with–d. Alternate alleles at variant sites based on partial genotype information or common vari-ants were included in alignments with the –v option. BWA alignments were performed using the bwa aln com-mand with options–n 1,−o 0, and–e 0 and bwa samse with option –n 4. When doing a second alignment, the customized reference was updated, if necessary, to contain one of the alleles at predicted heterozygous sites from the first alignment, sequences were aligned, and the align-ments were filtered as before.
Reads aligned to more than one genomic location or overlapping the ENCODE blacklist regions [26] were filtered. Potential PCR artifacts were removed using MarkDuplicates (Picard suite) with options REMOVE_
DUPLICATES = TRUE, VALIDATION_STRINGENCY = LENIENT, USE_THREADING = TRUE.
To investigate the effects of reference mapping biases on peak calling, peaks were called using SPP within an Irreproducible Discovery Rate (IDR) analysis [32] as out-lined by the ENCODE Consortium [33, 54]. Overlaps were determined between the 10,000 peaks with the strongest signal and heterozygous sites identified by genomic sequencing (complete genotypes).
Identifying allelic imbalance
Only sequence bases with a Phred33 base quality score greater than 30 were considered for predicting heterozy-gous sites or allelic imbalances. To account for mappability differences in alignments based on which of the two alleles was present, the heterozygous base in each sequence read was changed to the alternate allele and re-aligned to the genome. Only reads aligning uniquely regardless of the allele present were used to detect allelic imbalance. Signifi-cance was assessed with a binomial probability, b(a1;n, 0.5), where a1represents the number of reads containing allele1 andnis the total number of reads at the heterozygous site and an uncorrectedp-value threshold of 0.01. To calculate beta-binomial p-values, we first estimated parameter α of the beta distribution using reference allele proportions across all sites. A Z-statistic for each tested site was calcu-lated the following equation:
^
P−0:5 ffiffiffiffiffiffiffiffiffiffiffiffiffiffiffi
2αþN 4Nð2αþ1Þ
q ;
where P is the proportion of reads containing the refer-^ ence allele and N is the total number of reads at the site.
Electrophoretic mobility shift assays
For each heterozygous variant examined, two sets of complementary 21-mer, biotin-labeled oligonucleotides centered on the CREB1 motif and containing one allele were synthesized by Integrated DNA Technologies. Each set was annealed to create two double-stranded probes for each variant (Additional file 2: Table S5). EMSAs were performed according to the protocol included with the LightShift Chemiluminescent EMSA Kit (Thermo Scientific). Briefly, each reaction containing 1x binding buffer, 1 μg poly(dIdC), and 200 ng of purified CREB1 protein (CreativeBiomart CREB1-26H) was incubated for 15 min before adding biotin-labeled probes in a total reaction volume of 20 μl and incubating for another 25 min. Reactions were electrophoresed on 6 % DNA retardation gels (Life Technologies) in 0.5X TBE buffer (Lonza), transferred to nylon membranes (Thermo Scien-tific), UV cross-linked and detected with chemillumines-cence (Thermo Scientific).
Availability of supporting data
The AA-ALIGNER pipeline package is available on-line [34].
Results
Overview of AA-ALIGNER
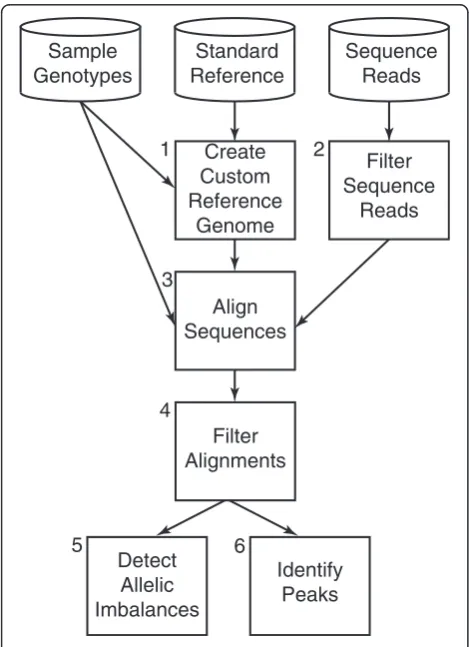
The AA-ALIGNER pipeline is designed to maximize short-read sequence alignment accuracy at sites of DNA variation regardless of genotype availability. These align-ments can be used to identify potential sites of regula-tory activity, indicated by an enrichment of aligned reads and referred to as peaks, and of allelic imbalance at these sites (Fig. 1). We first construct a sample-specific custom reference genome in a two-step process. To in-crease the likelihood that the allele in our starting reference
genome matches the genotype of any sample, alleles of common variants in the standard reference are modified as needed to the most common allele from a particular popu-lation, such as the 1000 Genomes European samples [35]. In a second step, all available genotype information from the sequenced sample is used to further customize this ref-erence sequence such that: (i) at homozygous variants, the sample allele is present; and (ii) at heterozygous sites, one of the two sample alleles is present. Alternate alleles at het-erozygous sites are recorded in a separate file during this process. When no genotype information is available, this alternate allele file contains all common minor alleles (MAF > 0.05) for the selected population.
Next, we filter sequence reads to remove low quality sequences and align them to the custom reference gen-ome using GSNAP [24], an allele-aware aligner. GSNAP takes as input the file containing reference and non-reference alternate alleles to equally consider alignments to both alleles. After alignment, we filter (i) sequences aligned to more than one genomic location; (ii) sequences aligned to regions underrepresented in the reference se-quence (ENCODE blacklisted regions); and (iii) duplicate reads to correct for PCR artifacts. These final alignments are used to identify peaks and sites of allelic imbalance.
When testing for imbalances, AA-ALIGNER includes predicted heterozygous sites not included in the initial custom reference during sequence alignment. New het-erozygous sites are predicted based on having a minimum number of reads containing each of two alleles. In addition, a minimum read threshold per allele can be applied to all heterozygous sites during imbalance detec-tion to guard against incorrectly annotated heterozygous sites. While predicted heterozygous sites are not included in the initial reference genome customization (Fig. 1, Box 1) or sequence alignment steps (Fig. 1, Box 3), they can be added in a second round of reference customization and alignment if desired.
AA-ALIGNER is designed to correct for multiple sources of bias in the data whenever possible. Increasing the minimum read threshold required to test for an imbal-ance can guard against incorrect heterozygous site identi-fication. Mappability biases, where reads containing one allele map uniquely while reads containing the other allele map to multiple locations and are filtered, may result in an artificial imbalance. AA-ALIGNER only considers reads that map uniquely to the same position in the gen-ome regardless of the allele present. Post alignment filter-ing of duplicate reads corrects for biases that can arise from PCR duplication during library preparation.
AA-ALIGNER allows key parameters to be specified that influence sequence alignment and post-alignment steps, such as imbalance detection. The minimum read threshold for each allele is one of these parameters. In addition, allowed mismatches can be restricted to
Sample Genotypes
Standard Reference
Sequence Reads
Create Custom Reference
Genome 1
Filter Sequence
Reads 2
Align Sequences 3
Filter Alignments 4
Detect Allelic Imbalances 5
Identify Peaks 6
predicted heterozygous sites to increase confidence in evidence for multiple alleles. By default, significance of allelic imbalances is determined using a standard bino-mial test, but the AA-ALIGNER pipeline can be easily modified to incorporate alternative statistical methods of detecting imbalance. Peaks are determined here using SPP [36]. Additional details for individual steps can be found in the Methods. Unless otherwise indicated, the following results are based on alignments allowing for one mismatch, with a minimum of five reads required for each allele, and a nominal binomialp-value threshold of 0.01 for allelic imbalance detection. Each of these pa-rameters is evaluated in detail in the following sections.
Using GSNAP removes alignment biases at heterozygous sites
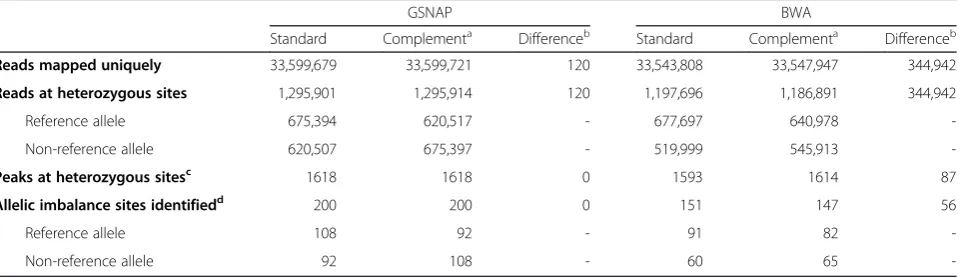
We first evaluated the ability of GSNAP to overcome the reference alignment bias. We used 50 base pair (bp) CREB1 ChIP-seq reads generated in the GM12878 lym-phoblastoid cell line by the HudsonAlpha Institute of Biotechnology as part of the ENCODE project. We cre-ated a custom GM12878 reference sequence based on a complete set of genotypes generated by the Broad Institute [37], and we created a GSNAP input file with non-reference alleles for each heterozygous site. To examine whether both alleles at heterozygous sites were equally considered during alignments, we also created a“ comple-ment” reference sequence by swapping the allele at each heterozygous site in the initial custom reference with the alternate allele from the input file. We compared sequence alignments to these two reference sequences using three metrics: reads mapped to heterozygous sites; sequence enrichment peaks called at heterozygous sites; and sites of allelic imbalance (Table 1). Only 120 of the 33.6 million (0.0003 %) reads were aligned differently between the two alignments. Manual inspection indicated that these dis-crepancies were due to GSNAP failing to remove align-ment bias when aligning sequences to regions containing more than 5 and as many as 16 heterozygous sites. These
120 differences did not affect the number of peaks or the predicted sites of allelic imbalances identified (Table 1). These data demonstrate that using GSNAP, AA-ALIGNER overcomes the alignment bias.
To quantify the importance of removing the alignment bias, we used the same metrics to compare allele-aware and non-allele-aware alignments using the same refer-ence sequrefer-ences. We used BWA for non-allele-aware alignments with the same alignment parameters as GSNAP. By considering alternate alleles, GSNAP (1.3 M reads) aligned 8 % more reads to heterozygous sites than BWA (1.2 M reads; Table 1). As expected, GSNAP aligned a larger percentage of reads containing the non-reference allele compared to BWA (48 % to 43 %), more closely reflecting the expectation that each allele should be present in equal numbers of reads. Additionally, we aligned sequence reads to the complement reference using BWA. In contrast to GSNAP, we found that BWA aligned 344 K (1.0 %) reads differently to the comple-ment and reference genomes. Greater than 54 % of reads mapped to the reference allele at heterozygous sites in both BWA alignments (Table 1), demonstrating the ef-fect of alignment bias on non-allele-aware alignments.
We examined, separately, the effect of biased alignments at heterozygous sites on peak and allelic imbalance detec-tion. Among the top 10,000 peaks with the greatest signal enrichment for each alignment method, using GSNAP identified 1.6 % more peaks overlapping a heterozygous site than BWA and predicted 32 % more allelic imbal-ances. Further, 54 % of GSNAP-identified imbalances were enriched for the reference allele compared to 60 % of BWA-identified imbalance sites (Table 1). Additionally, the reference allele was enriched in 82 % (23/28) of imbal-ances only detected when using BWA, compared to 49 % (39/79) of imbalances unique to GSNAP alignments. The majority of BWA imbalances favored the reference allele in both the standard reference and the complement refer-ence, demonstrating the presence of significant alignment bias. Together, these results demonstrate that alignment
Table 1Allele-aware alignments with complete genotypes (GSNAP) vs no genotype information (BWA)
GSNAP BWA
Standard Complementa Differenceb Standard Complementa Differenceb
Reads mapped uniquely 33,599,679 33,599,721 120 33,543,808 33,547,947 344,942
Reads at heterozygous sites 1,295,901 1,295,914 120 1,197,696 1,186,891 344,942
Reference allele 675,394 620,517 - 677,697 640,978
-Non-reference allele 620,507 675,397 - 519,999 545,913
-Peaks at heterozygous sitesc 1618 1618 0 1593 1614 87
Allelic imbalance sites identifiedd 200 200 0 151 147 56
Reference allele 108 92 - 91 82
-Non-reference allele 92 108 - 60 65
-a
Alignment reference contained the non-reference allele of heterozygous sites used to create the standard referenceb
Differs in mapping or detection between alignments to standard and complement referencescOut of 10,000 peaks with strongest signaldbinomialp-value < .01
biases negatively impact accurate sequence alignment, peak calling and allelic imbalance identification.
AA-ALIGNER identifies sites of allelic imbalance using partial genotypes or common variant information
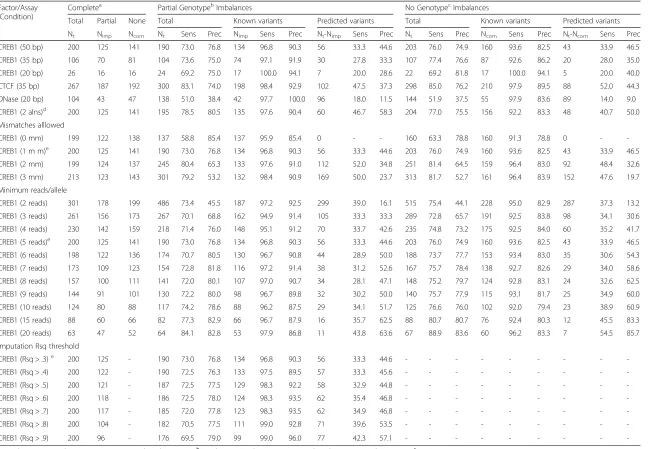
Complete genotypes are not available for most samples. Therefore, we evaluated how well AA-ALIGNER repro-duced allelic imbalance annotations using incomplete genotype information. We separately aligned the same 50 bp CREB1 ChIP-seq reads to custom GM12878 refer-ence genomes derived using (i) partial genotypes deter-mined using the Human1M-Duo BeadChip array and imputed using MachAdmix [27]; and (ii) 1000 Genomes common variants (EUR, MAF > .05) to model the case of no available genotype information. Using allelic imbal-ances identified with complete genotype information to define true positive (TP), false positive (FP), and false negative (FN) sites, we calculated sensitivity (TP/TP + FN) and precision (TP/FP + TP), or positive predictive value.
Similar numbers of imbalances were identified using all three levels of genotype information (Table 2, Additional file 2: Tables S6–S8). Interestingly, we found that when simply including common variant alleles (no available genotypes), we detected imbalances with similar sensitivity (>73 %) and precision (>75 %) as with partial genotype information (Table 2). Including alleles of common vari-ants with GSNAP significantly improved alignment per-formance compared to BWA with no variant information (Additional file 2: Table S2), even though neither align-ment includes any information about the sample’s geno-type. This improvement results from sites where including both alleles during alignment allowed for the imbalance to be detected. Of the 200 sites of imbalance detected using complete genotypes, 125 were present in the partial geno-types and 141 were common variants. Considering only these 125 and 141 sites, we find that sensitivity is 97 % and 94 % with 90 % and 82.5 % precision, respectively. In stark contrast, sensitivity of detection is 33 % (partial) and 34 % (common) with 45 % and 47 % precision at other predicted heterozygous sites, defined as sites with 5 or more reads containing each allele.
We considered whether poor performance at predicted heterozygous sites was due to either (i) incorrect identi-fication of homozygous sites as heterozygous using se-quencing data [38]; or (ii) incorrect classification of balanced heterozygous sites as imbalanced due to align-ment biases. By comparing the complete genotypes from genomic sequencing to imbalances at sites predicted to be heterozygous in the sequence data, we found that of the sites incorrectly predicted to be imbalanced, 58 % (18 of 31) using partial genotypes and 83 % (19 of 23) using common variants were not heterozygous. When using complete genotype information, AA-ALIGNER does not report imbalances at predicted heterozygous
sites. Of the imbalanced sites, 61 % (11/18) using partial genotypes and 42 % (8/19) using common variants were also imbalanced when using complete genotypes, under-scoring the difficulty in using short reads to detect im-balances at predicted heterozygous sites. We incorrectly detected imbalance at 13 sites using partial genotypes and 4 sites using common variants because an increase or de-crease in aligned reads containing one allele now caused the site to pass the significance threshold for imbalance.
We tested whether a more stringent binomial p-value threshold than 0.01 would improve performance, by re-ducing errors resulting from condition (ii). As expected, a stricter threshold reduced the number of imbalances detected, but it also decreased sensitivity and precision (Additional file 2: Table S2), especially at predicted erozygous sites. Additionally, we found at predicted het-erozygous sites the p-values of false positive imbalance sites were more significant than the p-values of true positives sites when using partial genotypes (Mann– Whitney U P= .003) and common variants (Mann– Whitney U P= .03; Additional file 1: Figure S2). These data suggest that errors in imbalance detection result more commonly from incorrect prediction of hetero-zygous sites than falsely calling imbalances at true heterozygous sites.
In addition to a binomial test, other statistical methods of detecting allelic imbalance have been used to measure the significance of allelic imbalance [21, 22, 25]. For ex-ample, a beta-binomial test is commonly used to correct for inaccurate imbalance detection caused by over dis-persion of the data. Using a beta-binomial test (P< .01) for the 50 bp pair CREB1 ChIP-seq data reduced the number of sites of allelic imbalance identified by 82-83 % using complete, partial or no genotype information (Additional file 2: Table S2). Overall sensitivity and preci-sion of imbalance detection using partial or no genotypes declined to ~50 %. Sensitivity and precision remained higher at imputed heterozygous sites (partial genotype alignment) and common variants (no genotype alignment) than predicted and uncommon variants as before. This reduction in the sensitivity and precision of imbalance detection is similar to the reduction seen when using a stricter binomialp-value threshold and is likely related to the increasedp-values of false positive sites reported above.
Table 2Allelic imbalance detection accuracy in alignments using partial or no genotypes compared to complete genotypes
Factor/Assay (Condition)
Completea Partial GenotypebImbalances No GenotypecImbalances
Total Partial None Total Known variants Predicted variants Total Known variants Predicted variants
Nt Nimp Ncom Nt Sens Prec Nimp Sens Prec Nt-Nimp Sens Prec Nt Sens Prec Ncom Sens Prec Nt-Ncom Sens Prec
CREB1 (50 bp) 200 125 141 190 73.0 76.8 134 96.8 90.3 56 33.3 44.6 203 76.0 74.9 160 93.6 82.5 43 33.9 46.5
CREB1 (35 bp) 106 70 81 104 73.6 75.0 74 97.1 91.9 30 27.8 33.3 107 77.4 76.6 87 92.6 86.2 20 28.0 35.0
CREB1 (20 bp) 26 16 16 24 69.2 75.0 17 100.0 94.1 7 20.0 28.6 22 69.2 81.8 17 100.0 94.1 5 20.0 40.0
CTCF (35 bp) 267 187 192 300 83.1 74.0 198 98.4 92.9 102 47.5 37.3 298 85.0 76.2 210 97.9 89.5 88 52.0 44.3
DNase (20 bp) 104 43 47 138 51.0 38.4 42 97.7 100.0 96 18.0 11.5 144 51.9 37.5 55 97.9 83.6 89 14.0 9.0
CREB1 (2 alns)d 200 125 141 195 78.5 80.5 135 97.6 90.4 60 46.7 58.3 204 77.0 75.5 156 92.2 83.3 48 40.7 50.0
Mismatches alllowed
CREB1 (0 mm) 199 122 138 137 58.8 85.4 137 95.9 85.4 0 - - 160 63.3 78.8 160 91.3 78.8 0 -
-CREB1 (1 m m)e 200 125 141 190 73.0 76.8 134 96.8 90.3 56 33.3 44.6 203 76.0 74.9 160 93.6 82.5 43 33.9 46.5
CREB1 (2 mm) 199 124 137 245 80.4 65.3 133 97.6 91.0 112 52.0 34.8 251 81.4 64.5 159 96.4 83.0 92 48.4 32.6
CREB1 (3 mm) 213 123 143 301 79.2 53.2 132 98.4 90.9 169 50.0 23.7 313 81.7 52.7 161 96.4 83.9 152 47.6 19.7
Minimum reads/allele
CREB1 (2 reads) 301 178 199 486 73.4 45.5 187 97.2 92.5 299 39.0 16.1 515 75.4 44.1 228 95.0 82.9 287 37.3 13.2
CREB1 (3 reads) 261 156 173 267 70.1 68.8 162 94.9 91.4 105 33.3 33.3 289 72.8 65.7 191 92.5 83.8 98 34.1 30.6
CREB1 (4 reads) 230 142 159 218 71.4 76.0 148 95.1 91.2 70 33.7 42.6 235 74.8 73.2 175 92.5 84.0 60 35.2 41.7
CREB1 (5 reads)e 200 125 141 190 73.0 76.8 134 96.8 90.3 56 33.3 44.6 203 76.0 74.9 160 93.6 82.5 43 33.9 46.5
CREB1 (6 reads) 198 122 136 174 70.7 80.5 130 96.7 90.8 44 28.9 50.0 188 73.7 77.7 153 93.4 83.0 35 30.6 54.3
CREB1 (7 reads) 173 109 123 154 72.8 81.8 116 97.2 91.4 38 31.2 52.6 167 75.7 78.4 138 92.7 82.6 29 34.0 58.6
CREB1 (8 reads) 157 100 111 141 72.0 80.1 107 97.0 90.7 34 28.1 47.1 148 75.2 79.7 124 92.8 83.1 24 32.6 62.5
CREB1 (9 reads) 144 91 101 130 72.2 80.0 98 96.7 89.8 32 30.2 50.0 140 75.7 77.9 115 93.1 81.7 25 34.9 60.0
CREB1 (10 reads) 124 80 88 117 74.2 78.6 88 96.2 87.5 29 34.1 51.7 125 76.6 76.0 102 92.0 79.4 23 38.9 60.9
CREB1 (15 reads) 88 60 66 82 77.3 82.9 66 96.7 87.9 16 35.7 62.5 88 80.7 80.7 76 92.4 80.3 12 45.5 83.3
CREB1 (20 reads) 63 47 52 64 84.1 82.8 53 97.9 86.8 11 43.8 63.6 67 88.9 83.6 60 96.2 83.3 7 54.5 85.7
Imputation Rsq threshold
CREB1 (Rsq > .3)e 200 125 - 190 73.0 76.8 134 96.8 90.3 56 33.3 44.6 - - - - - - - -
-CREB1 (Rsq > .4) 200 122 - 190 72.5 76.3 133 97.5 89.5 57 33.3 45.6 - - -
-CREB1 (Rsq > .5) 200 121 - 187 72.5 77.5 129 98.3 92.2 58 32.9 44.8 - - -
-CREB1 (Rsq > .6) 200 118 - 186 72.5 78.0 124 98.3 93.5 62 35.4 46.8 - - -
-CREB1 (Rsq > .7) 200 117 - 185 72.0 77.8 123 98.3 93.5 62 34.9 46.8 - - -
-CREB1 (Rsq > .8) 200 104 - 182 70.5 77.5 111 99.0 92.8 71 39.6 53.5 - - -
-CREB1 (Rsq > .9) 200 96 - 176 69.5 79.0 99 99.0 96.0 77 42.3 57.1 - - -
-a
Complete genotype alignments use sequencing-based genotypesb
Partial genotype alignments use array-based genotypes and imputationc
No genotypes alignments use common variants (MAF > .05) from 1000 Genomes EURd
Imbalances called after a second alignment using refined genotypes; known variants are variants included in the first alignmente
Condition used by default by AA-ALIGNER; Nttotal imbalance count, Nimpimbalances at heterozygous sites identified by imputation, Ncomimbalances at common variants, Sens, percent sensitivity, Prec, percent precision
Buchkovich
et
al.
BMC
Medical
Genomics
(2015) 8:43
Page
7
of
although still lower than when both alleles were included in the alignment.
Second alignment provides only modest improvement in sensitivity and precision for incomplete genotypes Previously, Ni et al. [20] described a strategy for detecting allelic imbalance that first identifies heterozygous sites using an initial alignment without variant information, and then performs a second, allele-aware alignment including the predicted variants. We tested whether a similar second alignment would boost the sensitivity and precision of allelic imbalance identification at predicted heterozygous sites. Before the second alignment, the customized refer-ence was updated to ensure that one allele was present at each heterozygous site predicted in the initial alignment, and non-reference alleles were added to the separate variant file. Reads were then re-aligned using this updated variant file and reference, and filtered as before.
Considering the CREB1 data with partial genotype in-formation, this second alignment identified 11 additional correct sites of allelic imbalance while eliminating 6 in-correct sites, increasing the sensitivity to 47 % and preci-sion to 58 % at predicted heterozygous sites (Table 2). When using common alleles, two additional correct im-balances were found and one incorrect site eliminated, with little change in sensitivity and precision. While a second, allele-aware alignment increases accuracy at pre-dicted heterozygous sites, these modest gains, still ac-companied by a high rate of false discovery, require an additional alignment. For all other analyses, we report imbalances detected after a single alignment.
Shorter read length and lower sequencing depth reduce the number of imbalance predictions but not precision or sensitivity
Most existing ChIP-seq datasets, such as from ENCODE, contain sequence reads shorter than 50 bp. We investi-gated how read length affects the ability of AA-ALIGNER to identify sites of allelic imbalance by trimming the 3′ end of each 50 bp CREB1 ChIP-seq sequence to create 35 bp and 20 bp reads and then aligned these as before. Trimming reduced the overall number of sequenced bases considered by 30 % and 60 %, respectively. The total num-ber of aligned reads decreased by 3.7 % in the 35 bp align-ment and 16.7 % in the 20 bp alignalign-ment, further reducing total base coverage. The number of reads overlapping heterozygous sites decreased by 31.3 % and 61.9 %, respectively (Additional file 1: Figure S3A), which led to an even greater reduction in number of identified allelic imbalances for 35 bp (106 imbalances; 47.0 % reduction) and 20 bp (26 imbalances; 86.6 % reduction) reads (Table 2, Additional file 1: Figure S3B).
To determine whether reduced allelic imbalance de-tection was simply due to lower overall base coverage,
we randomly sampled 70 % and 40 % of the 50 bp reads to match total base coverage levels for the above experi-ments using 35 bp and 20 bp reads. We found that the number of reads aligned to heterozygous sites decreased, as did imbalances identified, at the same rate as with the shorter reads (Additional file 1: Figure S3C). Thus, redu-cing base coverage had a proportionate effect on allelic imbalance identification compared to reduction in map-ping to heterozygous sites. In our original analysis using all 50 bp reads, we noted 22.5 % of sites passed the threshold for the minimum number of reads required for each allele to be tested for imbalance by three reads or less (Additional file 1: Figure S3D). As base coverage is reduced, a disproportionate number of these sites then fall below that threshold (N = 5).
As expected, the overall number of predicted imbal-ance sites also decreased with base coverage when using complete genotypes. Compared to the imbalances de-tected with complete genotypes for each read length, the sensitivity of imbalance calls using partial genotypes or common variants remained greater than 69 % and the precision greater than 75 %. These data demonstrate that AA-ALIGNER maintains high detection accuracy using partial genotypes or common variants compared to complete genotypes with reduced base coverage.
Number of imbalances identified varies across factors and assays
To ensure that the results from the CREB1 dataset were representative of results from other experiments, we used AA-ALIGNER to predict allelic imbalance in twelve additional transcription factor ChIP-seq datasets and one DNase-seq dataset generated in the same GM12878 cell line. ChIP-seq datasets contained between 14 and 48 million aligned reads, and most reads were 36 bp in length. Overall, we found that for all alignments, imbal-ance predictions were accurately replicated using incom-plete genotypes at sites where both alleles were used in the alignment. Imbalances at new heterozygous sites were again very poorly predicted (Additional file 2: Table S3).
Alone, TFBS genomic coverage (Additional file 1: Figure S4D) showed low correlation with the number of imbal-ances detected (Pearson R2= .35), but measurements that considered sequencing depth, read length and genomic coverage together (Additional file 1: Figure S4E-G) were highly correlated with the number of imbalances detected (0.78≥Pearson R2≥0.91). These correlations suggest that the dispersion of sequence signal across the genome needs to be considered in addition to read length and sequen-cing depth when evaluating the potential of AA-ALIGNER to identify allelic imbalances. While there was a positive correlation between sequencing depth and sig-nal dispersion in ChIP-seq data, the DNase-seq data, had greater sequencing depth (aligned reads) and signal dis-persion (genomic coverage), but fewer sites of allelic im-balance identified than some of the ChIP-seq data. These results suggest that sequencing depth and signal disper-sion influence imbalance in DNase-seq data differently and that the correlations observed in the ChIP-seq data do not extend to DNase-seq (Additional file 2: Table S4).
Allowing additional alignment mismatches increases sensitivity but decreases precision
Parameters for the different steps of allelic imbalance identification vary across reported methods and can sig-nificantly affect results. Increasing allowed alignment mis-matches helps overcome missing genotypes, inaccuracies in the reference genome, and errors in the sequence reads, but also results in increased erroneous sequence align-ment, particularly when aligning shorter reads. We exam-ined how this parameter affected the performance of AA-ALIGNER with limited genotype information. The 50 bp CREB1 data was processed with complete geno-types, partial genogeno-types, and common variant information allowing 0, 1, 2 or 3 alignment mismatches. With complete genotype information, the number of imbalances increased only slightly with greater mismatches (<4 %; Table 2).
When using partial genotypes or common variants, aligning with zero mismatches reduced the number of incorrectly aligned reads compared with our default of one mismatch, but at the cost of eliminating reads con-taining the non-reference allele at heterozygous sites not included during alignment. This led to increased overall precision of imbalance identification, but with significant loss of sensitivity as novel variants could not be pre-dicted (Table 2). Of note, the precision of imbalance detection at known variants using zero mismatches was lower than when allowing one mismatch. Allowing two or three mismatches increased the number of imbalance sites identified using incomplete genotypes by more than 29 % (Table 2). The precision at variants included in the alignment did not change, but was greatly reduced at predicted variants, indicating less stringent mismatch thresholds increase the number of misaligned reads
resulting in spurious predictions of heterozygous sites and allelic imbalance at these sites. We also tested whether requiring one of the mismatches to be located at the predicted heterozygous site increased sensitivity and precision compared to allowing mismatches at any site and found that results were similar in both cases (data not shown).
Requiring a minimum number of reads containing each allele increases precision at predicted heterozygous sites To balance sensitivity and precision with incomplete genotype information, we examined the impact of chan-ging the minimum aligned read threshold for each allele required to test for imbalanced sites. Using the 50 bp CREB1 data, we found that as the required number of aligned reads increased from 2 to 10, the number of detected imbalances decreased using any level of genotype information, as expected, with small fluctuations in the overall sensitivity of imbalance identification using incom-plete genotypes (Table 2). At thresholds of 15 and 20 reads per allele, the sensitivity of detection increased at pre-dicted heterozygous sites, boosting the overall sensitivity at these thresholds. When considering imbalances at vari-ants with both alleles included in the alignment, precision only varied slightly, but it increased at predicted sites with higher thresholds. While for most analyses we have required at least five reads per allele, these find-ings suggests that for known heterozygous sites, using a lower threshold will increase the number of identified sites without compromising precision.
Requiring higher imputation quality does not significantly improve imbalance identification
For each variant on the genotyping array, imputation quality (Rsq) reflects confidence in imputation of that variant within the population of genotyped individuals. As the imputation quality of a variant site increases, our confidence in the accuracy of the genotype assigned in GM12878 also increases. Poorly-imputed variants incor-rectly identified as heterozygous in GM12878 and in-cluded during alignment can lower the precision of imbalance detection using partial genotype information. Using imputation quality thresholds from 0.3 to 0.9 as a requirement of inclusion during alignment, we tested the influence of stricter thresholds on imbalance preci-sion and sensitivity using partial genotypes. When using a higher threshold of 0.9, some variants with a quality between 0.3 and 0.9 were still predicted to be heterozy-gous, increasing the precision of imbalance detection at predicted sites, but overall using a threshold of 0.9 re-duced the number of false positive sites by 7 compared to 0.3 while decreasing the number of true positive sites by the same amount, resulting in a small increase in pre-cision and decrease in sensitivity (Table 2).
Allelic differences in CREB1 binding experimentally supported at inflammatory bowel disease-associated loci and other predicted sites
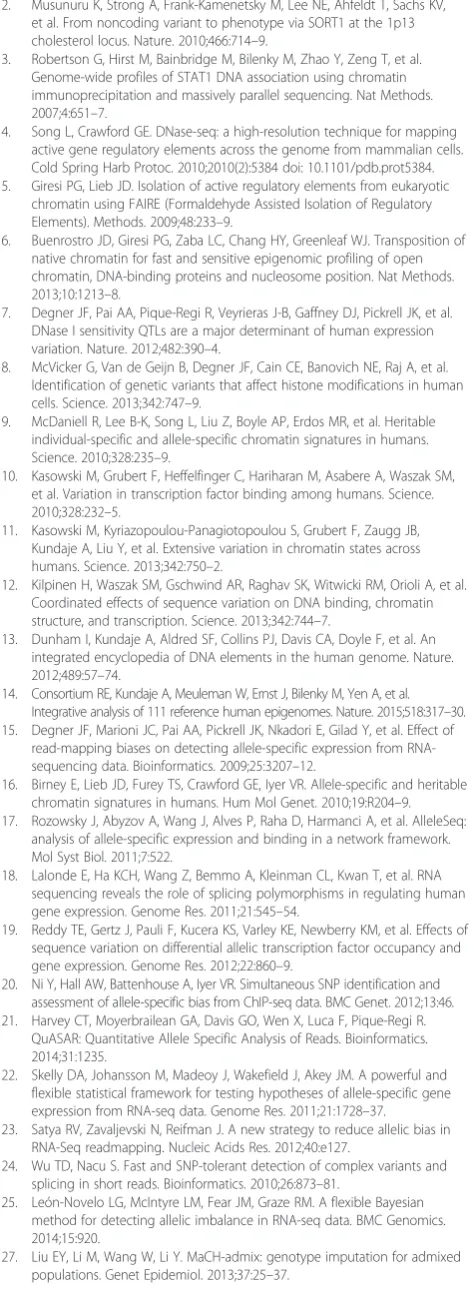
The above analyses assume that imbalances detected using complete genotypes are the most accurate for comparing the effects of reduced information and parameter settings, but they do not address the functional accuracy of the im-balance prediction. Of special interest are sites previously shown to be associated with disease, especially a disease for which the GM12878 lymphoblastoid cell line is rele-vant. We identified 238 heterozygous sites in GM12878 that are in linkage disequilibrium (1000 Genomes EUR; r2≥.8) with one of 218 index SNPs reported for a genome wide association study (GWAS, P< 1.0x10⁻⁵) [39]. AA-ALIGNER predicted allelic imbalances (P< 0.01) in CREB1 binding in GM12878 at five of these disease-associated loci (Fig. 2a). Two of the sites, rs2382818 (Fig. 2b) and
rs713875 (Fig. 2c), are at loci associated with inflamma-tory bowel disease susceptibility [40–42]. CREB family proteins have previously reported links to inflammation [43], B-cell lymphocytes [44], and inflammatory bowel disease [44].
At rs2382818, 27 reads containing the T allele and 6 reads containing the A allele were aligned using complete genotype, partial genotype, and common variant informa-tion (binomialP= 3.2x10⁻⁴; Fig. 2b, bottom panel). The T allele of rs2382818 most often segregates with the disease risk allele A of rs2382817 [44]. Electrophoretic mobility shift assays (EMSAs) using purified CREB1, conducted in the absence of chromatin and other nuclear proteins, can experimentally test for differential binding of CREB1 to a specific DNA sequence. Multiple, independently per-formed EMSAs supported allelic differences in binding at rs2382818 (Fig. 2d). A second heterozygous site is located
Allele 1 Imbalance
P-value
Variant Position Allele Reads Associated Diseases/Traits
rs1197479 chr12:57030686 C 42 4x10⁻³ Mean platelet volume; age-related macular degeneration
rs13333528 chr16:68790502 T 60 1x10⁻²
rs369184 chr17:5670908 T 37 2x10⁻⁴
rs2382818 chr2:219155907 T 27 3x10⁻⁴
rs713875 chr22:30592487 C 30 1x10⁻³
Allele 2 Allele Reads T 19 C 34 C 1 A 6 G 9 Colorectal cancer Testicular germ cell tumor Inflammatory bowel disease
Inflammatory bowel disease; Crohn’s disease; Nephropathy
A
B 100 bases
219,155,800 219,155,900 219,156,000 chr2 37 -0 _ 37 -0 _ rs2382818 rs2382819 Peaks Peaks Signal Signal BW A GSNAP
Reads shaded by allele: T A Undetermined Reads shaded by allele: C GUndetermined
200 bases 30,592,500 30,593,000 chr22 47 -0 _ 47 -0 _ rs713875 Peaks Peaks Signal Signal BW A GSNAP C D
Allele 1 Allele 2 Variant rsID Allele Reads Allele Reads
Imbalance Pvalue
A rs2382818 T 27 A
B rs28712309 A 182 G
C rs72694799 A 97 G
D rs28711909 G 70 A
E rs1107479 C T
F rs73177939 G 53 C
G rs12953558 A 70 C
H G 81 C
I rs713875 C 30 G
6 9 46 28 19 6 40 11 9 3x10⁻⁴ 5x10-43 2x10⁻⁵ 3x10⁻⁵ 4x10⁻³ 2x10⁻¹⁰ 5x10⁻³ 3x10-14 1x10⁻³ rs12624512 E D* C B* A* T C A G G A G A A T 42 I* H* G F* G C C G C A C G CREB1 CREB1
2 bp downstream of rs2382818. Allowing only a single mismatch during alignment prevents reads from aligning if both alleles are not considered. At this site, a peak and an allelic imbalance were only detected when using GSNAP alignments, but not BWA (Fig. 2b), demonstrat-ing the importance of usdemonstrat-ing allele-aware alignments in annotating disease-associated variants. This locus has been annotated as an enhancer based on ENCODE histone modification data [45] and linked with the expression of nearby genes (SLC11A1, USP37, PNKD, andZNF142) [46]. We used MEME-ChIP [47] to identify a CREB1 binding motif from the 10,000 strongest ChIP-seq peaks and searched for the presence of this motif at rs2382818 using FIMO (e < 1.0x10⁻⁵) [48], but we were unable to detect the CREB1 motif at this site.
At rs713875 (MTMR3 locus), 30 reads containing the Crohn’s disease risk C allele [42] and 9 reads containing the G allele were aligned using any level of genotype in-formation (binomial P= 1.1x10⁻³; Fig. 2c). Allelic differ-ences in CREB1 binding were again supported by EMSA (Fig. 2d). In this example, the imbalance was detected even when only one allele was used in the alignment. Rs713875 is contained within a DNaseI hypersensitive site and is predicted to function as an enhancer [45]. Correl-ation between DNaseI hypersensitivity and gene expres-sion levels suggests that this locus may regulate nearby genes LIFand TBC1D10A, pseudogene CTA-85E5.7, and non-coding RNA RP3-438O4.4 [49]. Of these, leukemia inhibitory factor (LIF) is an IL-6 cytokine believed to have both inflammatory and anti-inflammatory roles [50]. As with rs2382818, we were unable to detect a CREB1 bind-ing motif at this site. For both rs713875 and rs2382818, further study would be required to show whether allelic differences in CREB1 binding alter transcription and affect inflammatory bowel disease.
We tested for allelic differences in CREB1 binding at seven additional sites that contain a CREB1 binding motif and were predicted to be imbalanced by AA-ALIGNER. These seven included rs1107479, which has been associated with mean platelet volume [51] and age-related macular degeneration [52]. Using EMSA, we de-tected evidence of allelic differences in protein binding in the same direction as our predicted imbalance at 4 of the 7 sites (Fig. 2d), for a total of 6 of 9 supported imbal-ances. Surprisingly, at rs1695359, we consistently de-tected increased protein binding for the allele predicted by our imbalance analysis to have decreased binding. Of the 6 EMSA-supported sites, only 3 were predicted to have allelic differences based on the FIMO-calculated motif score (difference > 5). Of the 3 imbalance sites that were not supported by EMSA, only one (rs1695359) had a significant difference in motif binding score, and the allele with the stronger motif score demonstrated in-creased binding in the EMSA result, rather than the
allele predicted to be enriched by imbalance detection. For comparison, we used EMSA to test 5 additional CREB1 binding locations with a heterozygous variant that fell within a CREB1 binding motif, but were not predicted as sites of allelic imbalance (P> .3). We found evidence of allelic differences in protein binding at two of these sites (Additional file 1: Figure S5). For these two sites, a CREB1 motif was only predicted when the allele with stronger protein binding was present.
These data provide strong supporting evidence of allelic differences in protein binding at 6 of the 9 predicted im-balanced sites and suggest that the sequence-specific binding preferences of CREB1 influence binding at these sites. It is unclear whether the remaining three sites not supported by EMSA indicate errors in AA-ALIGNER imbalance detection, or whether these show limitations of EMSA in detecting in vivo allelic differences in protein binding that are dependent on chromatin context or the presence of other nuclear proteins. Likewise, it is unclear whether AA-ALIGNER failed to detect allelic imbalance at two sites with allelic differences in protein binding based on EMSA, or whether chromatin and/or other proteins compensate for reduced sequence spe-cificity in vivo resulting in similar binding regardless of allele present. Overall, these EMSA results provide evidence supporting allelic differences in protein bind-ing at individual imbalance sites detected by AA-ALIGNER.
Discussion
In this study, we have demonstrated the ability of AA-ALIGNER to remove mapping biases and to identify al-lelic imbalance with high sensitivity and precision when using partial or no prior genotype information compared to using complete genotype information. Thoroughly testing allelic imbalance detection using three levels of genotype information provides a clear picture of the ac-curacy of AA-ALIGNER when using limited genotypes compared to complete genotypes.
This is the first in-depth study of allelic imbalance de-tection in ChIP-seq and DNase-seq data that empirically tested the effects of key aspects of these analyses including genotype availability, read length, alignment parameters, imputation parameters, and requirements for predicting heterozygous sites. Our results indicate that including any amount of genotype information, or both alleles at com-mon variants, significantly increases accuracy of imbal-ance detection compared to predictions when complete genotypes are known. We clearly show that predicting heterozygous variants with these short read data is highly inaccurate, leading to false positive rates of imbalance detection greater than 50 %. We used a simple metric to predict heterozygous sites, and so one could argue that more sophisticated prediction methods could improve
performance. A recent study examining the accuracy of genotyping with short reads from genomic sequencing found that removing sites with strong allelic imbalance, the very sites we are trying to identify, increased genotype accuracy [30]. That study highlighted the difficulty of identifying heterozygous sites from ChIP-seq and DNase-seq data, especially at imbalanced sites. Taken together with our data we strongly suggest that predicted geno-types should be further validated before embarking on functional analyses.
Predicting heterozygous sites in genome sequencing data is an active area of research, and many studies have demon-strated the difficulty of calling variants in sequencing data [25, 30, 53]. In addition to the GM12878 genotype annota-tion used in this study, other generally more conservative annotations exist. We found that most predicted imbal-ances were at common variants, and even when all com-mon variants were included in alignments in the case of no genotypes, the true heterozygous variants and imbalances could be predicted well at these common variant sites. In contrast, the accuracy of imbalance detection at predicted heterozygous sites corresponding to rare variants is poor, even when these predicted heterozygous sites were in-cluded in a second alignment. Inaccurate imbalance detec-tion can be caused by either i) incorrectly predicted heterozygous sites in the sequencing data (false positives) or ii) correctly predicted heterozygous sites in the sequen-cing data that were incorrectly annotated in the complete genotype (false negatives). Requiring more evidence to predict heterozygous sites increased the accuracy of imbalance detection, suggesting that false positives in heterozygous site predictions contributed to inaccurate imbalance detection. These incorrect predictions may be partly due to sequencing errors, but as some are still present at high minimum read thresholds, errors in se-quence mapping likely contribute to false positives. The inclusion of incorrectly annotated heterozygous sites or absence of true heterozygous sites during sequence alignment can cause erroneous read mappings to highly similar genomic regions leading to incorrect heterozy-gous site identification.
Interestingly, many imbalances at sites not annotated as heterozygous in the complete genotype would have been considered imbalanced in the complete genotype alignment using our criteria. This suggests that errors may exist in the complete genotype data leading to false negative imbalance predictions. Further study is needed, but these data suggest that both false positives and false negatives contribute to decreased detection accuracy at predicted variants. Thus, AA-ALIGNER outputs three sets of detected imbalance sites: i) a complete set of all imbalances identified; ii) imbalances at known or com-mon heterozygous variants (higher confidence); and iii) imbalances at predicted rare variants (lower confidence).
We showed that simply including both alleles for com-mon variants resulted in annotations nearly as accurate as those generated from imputed genotypes. Including infor-mation about rare variants may further increase sensitivity of imbalance detection. We only considered imputed geno-types and common variants separately, but carefully com-bining information from these sources may perform better than either individually and is an area of future research.
Other tested parameters demonstrated the trade-off between sensitivity and precision based on their settings, but in most cases these parameters had little effect other than to change the number of predicted imbalanced sites. Nevertheless, these results can be used to guide the analysis of new data, and AA-ALIGNER allows for the easy specification of these parameters. For example, it may be prudent to apply different criteria when evalu-ating variant sites with known genotypes or that are common variants compared to those predicted to be heterozygous based solely on the short read data. For most of our results, we required a minimum of five reads per allele when testing for imbalances to prevent erroneous testing of homozygous variants. When strong evidence exists for heterozygosity, though, this require-ment may be loosened or eliminated, allowing for greater sensitivity in identifying more extreme imbal-ances. While it is prudent to require a minimum read threshold of reads to detect imbalances at predicted het-erozygous sites, this threshold precludes the identifica-tion of complete imbalance at known heterozygous sites where only one allele is present, such as imprinted loci. When using known heterozygous sites, AA-ALIGNER users have the option to detect complete imbalance at these sites.
differences in protein binding. Further testing is required to understand the cases when EMSA results do not sup-port predicted allelic imbalances. For example, it is un-known whether any of the 3 sites not supported by EMSA were falsely detected as imbalanced by AA-ALIGNER, or whether they failed to validate because of the limitations inherent to EMSA. Likewise, further study is needed to determine whether the two sites that AA-ALIGNER did not predict as imbalanced but that EMSA showed allelic differences in protein binding are due to limitations in AA-ALIGNER or EMSA. These results highlight the need for better experimental assays to valid-ate allelic imbalances, and underscore the difficulty of creating comprehensive catalogs of sites with experimen-tal evidence of differences in protein binding.
The most appropriate statistical test and significance threshold for determining imbalanced sites is not known. While the binomial test is commonly used, other statistical methods such as a beta-binomial [21, 54], and Bayesian frameworks [25, 54] have been shown to accurately detect allelic imbalance. For our analyses, we used the more opti-mistic binomial test and determined significance using an uncorrected p-value threshold of 0.01. Our data indicate that stricter p-value thresholds do not significantly affect the sensitivity and precision of predictions using incomplete genotypes when compared to complete genotype annota-tions. Incorrectly predicted heterozygous sites often had very smallp-values (25 % atP< 10−7), thus stricterp-values will not eliminate these false positives. Likewise, using beta-binomialp-values to correct for over dispersion and setting the same uncorrected p-value cut-off greatly reduced our power to detect allelic imbalance. Using the beta-binomial
p-value, imbalance detection accuracy and precision re-main significantly higher for imputed and common vari-ants than for predicted rare varivari-ants. Our experimental EMSA results were strongest overall for sites with lower
p-values, although we did show evidence for altered binding at rs713875 (binomialP =1.0x10⁻³) and rs2382818 (P=3.2x10⁻⁴) but not rs72694799 (P =2.6x10⁻⁵) (Fig. 2d). Sites with less statistically significant changes in allelic data may be biologically inconsequential, or the functional ef-fects may simply be weaker but still biologically significant. Until a larger set of experimentally supported sites exists, we cannot determine which statistical test and p-value threshold best identifies biologically relevant imbalance sites. AA-ALIGNER was designed to be modular allowing for allowing for the incorporation of alternative methods for variant identification and tests for significance of imbalances.
Copy number variants (CNVs), which can have signifi-cant impacts on disease [55], can cause one allele to overrepresented in the genomic DNA leading to bio-logically inconsequential imbalances in read data. Prior CNV information for the sequenced sample can be used
to preclude imbalance detection within CNVs. Alterna-tively, sequence data from non-ChIP genomic input or other control experiments, when sequenced with suffi-cient read depth in the same sample, could be used to estimate an expected proportion of aligned reads per allele and to adjust for copy number variation within the binomial test. These control sequences could also cor-rect for other biases that cause incorcor-rect allelic imbal-ance detection in both the control and ChIP-seq data. Like genotype information, CNV data is not available for most samples. At this time, AA-ALIGNER does not specifically incorporate known CNV data, although known CNVs can easily be included as “blacklisted” re-gions and filtered post-alignment. Alternatively, presence of CNVs could be experimentally tested for at AA-ALIGNER predicted imbalance sites.
Conclusions
Allelic imbalance analyses in quantitative sequence data from functional genomic experiments such as ChIP-seq and DNase-seq data is a powerful way to identify effects of genetic variation on gene regulation and uncover molecular mechanisms responsible for GWAS loci in non-coding genomic regions. Reference mapping biases at heterozygous sites and a lack of genotype information for sequenced samples greatly hinder allelic imbalance detection in most public *-seq data. Our analyses demonstrate that the AA-ALIGNER pipeline overcomes mapping biases and accurately identifies a majority of imbalance sites using only par-tial or no genotype information compared to complete genotype information. Additionally, we provide valu-able insight into how experimental and methodological design factors effect imbalance detection.
With AA-ALIGNER, we were able to detect allelic im-balance in ChIP-seq data for a single transcription factor from a single cell line and provide supporting experimen-tal evidence of differential protein binding at a small sub-set of imbalanced sites. These sites with experimental evidence included variants at two inflammatory bowel disease-associated loci. We demonstrated that mapping biases at one of these two sites prevented detection of both signal enrichment and allelic imbalance using standard analytical techniques. Existing knowledge of B-lymphocytes, regulatory regions and nearby genes suggest a plausible role for these imbalanced sites in in-flammatory bowel disease pathogenesis, highlighting the utility of imbalance detection in annotating disease-associated loci. Replicating this analysis in additional cell lines and for additional factors should continue to uncover allelic imbalance at numerous other GWAS loci, providing powerful insight into likely genetic effects on regulation.
Additional files
Additional file 1: Supplemental Materials. Figure S1:Reference mapping biases influence sequence alignment. Example of effect of reference mapping biases on sequence alignment.Figure S2:False positive imbalance sites have more significant p-values. P-values of imbalances detected, grouped by genotype availability and accuracy.
Figure S3:Read length influences sequence alignment and allelic imbalance detection at heterozygous sites. (A) Alignment statistics of different reads with different lengths. Effects of sequence length (B) and depth (C) on imbalance detection. (D) Distribution of number of reads for underrepresented allele.Figure S4:Correlation of alignment statistics and number of imbalances detected.Figure S5:Allelic differences in binding at sites without predicted allelic imbalance. EMSA results for sites with reads mapping but no detected imbalance.
Additional file 2: Supplemental Tables. Table S1:Precision of imbalance detection in non-allele-aware alignments. Imbalance detection sensitivity and accuracy using BWA and no genotypes compared to GSNAP and common variants.Table S2:P-value threshold influences allelic imbalance detection using partial genotypes and common variants. Imbalance detection statistics using the binomial test and multiple thresholds or the beta-binomial test.Table S3:Precision of allelic imbalance detection extends to other transcription factor ChIP-seq data. Imbalance detection statistics for alignments of sequence data 11 additional proteins.Table S4:Alignment and base coverage statistics for ChIP-seq transcription factor and DNase-seq data. Alignment statistics for all alignments used in these analyses.Table S5:EMSA probes for experimental validation.Table S6:Heterozygous sites tested for allelic imbalance in complete genotype alignment (CREB1 50-bp).Table S7:
Heterozygous sites tested for allelic imbalance in partial genotype alignment (CREB1 50-bp).Table S8:Heterozygous sites tested for allelic imbalance in no genotype alignment (CREB1 50-bp).
Abbreviations
ENCODE:Encyclopedia of DNA elements; bp: Base pairs; MAF: Minor allele frequency; TP: True positive; FP: False positive; FN: False negative; TFBS: Transcription factor binding site; GWAS: Genome wide association study; Rsq: Imputation quality; EMSA: Electrophoretic mobility shift assay; CNV: Copy number variants.
Competing interests
The authors declare that they have no competing interests.
Authors’contributions
MLB performed primary computation analyses and experimental validation, participated in pipeline development and led manuscript preparation. KE participated in pipeline development. QD and YL performed genotype imputation. KLM and TSF participated in study design and interpretation of analyses, and assisted in manuscript preparation. All authors have reviewed and approved the final manuscript.
Acknowledgments
We thank Thomas Wu for extended GSNAP support. Funding for this study was provided by American Heart Association (13PRE16930025), NIH (T32 GM067553), NIH (R01 DK072193), and University of North Carolina Cancer Research Fund.
Author details
1Department of Genetics, University of North Carolina, Chapel Hill, NC
27599, USA.2Department of Biostatistics, University of North Carolina, Chapel Hill, NC 27599, USA.3Department of Computer Science, University of North Carolina, Chapel Hill, NC 27599, USA.4Department of Biology, University of North Carolina, Chapel Hill, NC 27599, USA.
Received: 4 March 2015 Accepted: 8 July 2015
References
1. Edwards SL, Beesley J, French JD, Dunning AM. Beyond GWASs: illuminating the dark road from association to function. Am J Hum Genet. 2013;93:779–97.
2. Musunuru K, Strong A, Frank-Kamenetsky M, Lee NE, Ahfeldt T, Sachs KV, et al. From noncoding variant to phenotype via SORT1 at the 1p13 cholesterol locus. Nature. 2010;466:714–9.
3. Robertson G, Hirst M, Bainbridge M, Bilenky M, Zhao Y, Zeng T, et al. Genome-wide profiles of STAT1 DNA association using chromatin immunoprecipitation and massively parallel sequencing. Nat Methods. 2007;4:651–7.
4. Song L, Crawford GE. DNase-seq: a high-resolution technique for mapping active gene regulatory elements across the genome from mammalian cells. Cold Spring Harb Protoc. 2010;2010(2):5384 doi: 10.1101/pdb.prot5384. 5. Giresi PG, Lieb JD. Isolation of active regulatory elements from eukaryotic
chromatin using FAIRE (Formaldehyde Assisted Isolation of Regulatory Elements). Methods. 2009;48:233–9.
6. Buenrostro JD, Giresi PG, Zaba LC, Chang HY, Greenleaf WJ. Transposition of native chromatin for fast and sensitive epigenomic profiling of open chromatin, DNA-binding proteins and nucleosome position. Nat Methods. 2013;10:1213–8.
7. Degner JF, Pai AA, Pique-Regi R, Veyrieras J-B, Gaffney DJ, Pickrell JK, et al. DNase I sensitivity QTLs are a major determinant of human expression variation. Nature. 2012;482:390–4.
8. McVicker G, Van de Geijn B, Degner JF, Cain CE, Banovich NE, Raj A, et al. Identification of genetic variants that affect histone modifications in human cells. Science. 2013;342:747–9.
9. McDaniell R, Lee B-K, Song L, Liu Z, Boyle AP, Erdos MR, et al. Heritable individual-specific and allele-specific chromatin signatures in humans. Science. 2010;328:235–9.
10. Kasowski M, Grubert F, Heffelfinger C, Hariharan M, Asabere A, Waszak SM, et al. Variation in transcription factor binding among humans. Science. 2010;328:232–5.
11. Kasowski M, Kyriazopoulou-Panagiotopoulou S, Grubert F, Zaugg JB, Kundaje A, Liu Y, et al. Extensive variation in chromatin states across humans. Science. 2013;342:750–2.
12. Kilpinen H, Waszak SM, Gschwind AR, Raghav SK, Witwicki RM, Orioli A, et al. Coordinated effects of sequence variation on DNA binding, chromatin structure, and transcription. Science. 2013;342:744–7.
13. Dunham I, Kundaje A, Aldred SF, Collins PJ, Davis CA, Doyle F, et al. An integrated encyclopedia of DNA elements in the human genome. Nature. 2012;489:57–74.
14. Consortium RE, Kundaje A, Meuleman W, Ernst J, Bilenky M, Yen A, et al. Integrative analysis of 111 reference human epigenomes. Nature. 2015;518:317–30. 15. Degner JF, Marioni JC, Pai AA, Pickrell JK, Nkadori E, Gilad Y, et al. Effect of
read-mapping biases on detecting allele-specific expression from RNA-sequencing data. Bioinformatics. 2009;25:3207–12.
16. Birney E, Lieb JD, Furey TS, Crawford GE, Iyer VR. Allele-specific and heritable chromatin signatures in humans. Hum Mol Genet. 2010;19:R204–9. 17. Rozowsky J, Abyzov A, Wang J, Alves P, Raha D, Harmanci A, et al. AlleleSeq:
analysis of allele-specific expression and binding in a network framework. Mol Syst Biol. 2011;7:522.
18. Lalonde E, Ha KCH, Wang Z, Bemmo A, Kleinman CL, Kwan T, et al. RNA sequencing reveals the role of splicing polymorphisms in regulating human gene expression. Genome Res. 2011;21:545–54.
19. Reddy TE, Gertz J, Pauli F, Kucera KS, Varley KE, Newberry KM, et al. Effects of sequence variation on differential allelic transcription factor occupancy and gene expression. Genome Res. 2012;22:860–9.
20. Ni Y, Hall AW, Battenhouse A, Iyer VR. Simultaneous SNP identification and assessment of allele-specific bias from ChIP-seq data. BMC Genet. 2012;13:46. 21. Harvey CT, Moyerbrailean GA, Davis GO, Wen X, Luca F, Pique-Regi R.
QuASAR: Quantitative Allele Specific Analysis of Reads. Bioinformatics. 2014;31:1235.
22. Skelly DA, Johansson M, Madeoy J, Wakefield J, Akey JM. A powerful and flexible statistical framework for testing hypotheses of allele-specific gene expression from RNA-seq data. Genome Res. 2011;21:1728–37. 23. Satya RV, Zavaljevski N, Reifman J. A new strategy to reduce allelic bias in
RNA-Seq readmapping. Nucleic Acids Res. 2012;40:e127.
24. Wu TD, Nacu S. Fast and SNP-tolerant detection of complex variants and splicing in short reads. Bioinformatics. 2010;26:873–81.
25. León-Novelo LG, McIntyre LM, Fear JM, Graze RM. A flexible Bayesian method for detecting allelic imbalance in RNA-seq data. BMC Genomics. 2014;15:920.