R E S E A R C H
Open Access
Gene expression comparison reveals
distinct basal expression of HOX members
and differential TNF-induced response
between brain- and spinal cord-derived
microvascular endothelial cells
Yves Molino
1, Françoise Jabès
1, Amandine Bonnet
2, Nicolas Gaudin
2, Anne Bernard
2, Philippe Benech
2†and Michel Khrestchatisky
2*†Abstract
Background:The heterogeneity of endothelial cell types underlies their remarkable ability to sub-specialize and provide specific requirements for a given vascular bed. Here, we compared rat microvascular endothelial cells (MECs) derived from the brain and spinal cord in both basal and inflammatory conditions.
Methods:We used whole rat genome microarrays to compare, at different time points, basal and TNF-α-induced gene expression of rat MECs from in vitro models of the blood-brain barrier (BBB) and blood-spinal cord barrier (BSCB). Validation at both messenger RNA (mRNA) and protein levels was performed on freshly extracted microvessels (MVs) from the brain and spinal cord (BMVs and SCMVs, respectively), as these were considered the closest in vivo tissues to cultured MECs.
Results:Most of the genes encoding adhesion/tight junction molecules and known endothelial markers were similarly expressed in brain and spinal cord MECs (BMECs and SCMECs, respectively). However, one striking finding was the higher expression of severalHoxgenes, which encode transcription factors involved in positional identity. The differential expression ofHoxa9andHoxb7at the mRNA levels as well as protein levels was confirmed in BMVs
and SCMVs. Although the TNF-αresponse was in general higher in BMECs than in SCMECs at 12 h, the opposite
was observed at 48 h. Furthermore, we found that expression ofTnfrsf1a and Tnfrsf1bencoding the TNF receptor
super-family member 1a/TNFR1 and 1b/TNFR2, respectively, were constitutively higher in BMVs compared to SCMVs. However, onlyTnfrsf1bwas induced in SCMECs in response to TNF-αat 24 and 48 h.
Conclusions:Our results support a role for HOX members in defining the positional identities of MECs in vivo. Our data also suggest that the delayed transcriptional activation upon TNF-αtreatment in SCMECs results from the requirement of the TNF-induced expression ofTnfrsf1b. In contrast, its high basal expression in BMECs might be sufficient to confer an immediate and efficient TNF-αresponse.
Keywords:Microvessels, Endothelial cells, Vascular beds, HOX members, TNF-αresponse, Matrix metalloproteinase (MMP)
* Correspondence:[email protected] †Equal contributors
2Aix Marseille Univ, CNRS, NICN, Marseille, France
Full list of author information is available at the end of the article
Background
The brain and spinal cord are endowed with particular vascular systems, known as the blood-brain barrier (BBB) and blood-spinal cord barrier (BSCB), respect-ively, which maintain homeostasis between nervous parenchyma and peripheral circulation. These barriers are composed of microvascular endothelial cells (MECs) and neighboring elements of the neuro-glia-vascular unit (NGVU) such as pericytes, astrocytic end-feet processes, and neurons. The two vascular sys-tems share physical and physiological barrier
proper-ties including basement membranes, highly
differentiated tight junctions (TJs), low levels of endo-cytosis and vesicular transport, a broad spectrum of molecular pumps, polarized carriers, and receptors in-volved in transcytosis mechanisms [1, 2].
Despite these common features, the BSCB presents structural and functional differences resulting in distinct vulnerability to pathological insults when compared to the BBB [2, 3]. For instance, the microvessels (MVs) of the spinal cord contain glycogen deposits, which are not normally seen in the cerebral MVs [4]. Only limited pop-ulations of brain astrocytes express the phosphorylated form of glial fibrillary acidic protein (GFAP) while almost all astrocytes in the spinal cord do so [5]. Most in vivo studies describe uniform presence of pericytes in various brain regions, while the spinal cord presents with 70 % less pericytes compared to the brain, with a non-uniform distribution along the rostrocaudal extent of the spinal cord, the thoracic region being richer in pericytes [6, 7]. In vitro, brain and spinal cord pericytes differ markedly in their potential for tube formation and migration, reflecting more differences between the BBB and BSCB [8]. Such differences in their microenvironment may in turn induce MEC heterogeneity between brain and spinal domains, correlating with a higher BSCB inher-ent permeability [9, 10]. This increased permeability might result from differences in cell junction protein expression between BBB and BSCB endothelial cells. In cultured SCMECs compared to BMECs, TJ proteins ZO-1 and occludin expression levels are decreased, while claudin-1 and claudin-5 remain unchanged, con-firming that this decrease is specific [11]. Adherens junction proteins such as VE-cadherin and β-catenin also show reduced expression in SCMVs and cultured SCMECs [11].
Like their brain counterparts, SCMECs are involved in pathological processes associated with many neuro-logical conditions [3]. Although, the structural and functional differences might explain that certain disease states differentially affect BMEC and SCMEC popula-tions, very little is known concerning their intrinsic dif-ferences, including their response to inflammation. To gain more insight into such differences, a comparative
transcriptomic analysis was performed on RNAs extracted from MEC monolayers of in vitro models of the BBB and BSCB [12] left untreated or treated with TNF-αfor 12, 24, and 48 h.
Methods
Animals
Procedures involving animals conform to National and European regulations (EU directive No. 2010/63) and to authorizations delivered to our animal facility (No. C13 055 08) and to the project (No. 00757.02) by the Local Ethics Committee and French Ministry of Research. All efforts were made to minimize animal suffering and reduce the number of animals used. Wistar rats were obtained from Elevage Janvier (St Berthevin, France).
Rat syngeneic in vitro BBB and BSCB models
The production of in vitro BBB and BSCB models is based on our previously described protocol [12]. Briefly, primary cultures of BMECs and SCMECs, prepared from 5- to 6-week-old Wistar rats, were seeded in the luminal compartment of six-well plate polyethylene insert filters (Merck Millipore, Billerica, MA, USA), pre-coated with collagen type IV and fibronectin (BD Biosciences, Frank-lin Lakes, NJ, USA) to establish the endothelial cell monolayers. Astrocytes, prepared from neonatal Wistar rats, were seeded in the bottom of the six-well plates and co-cultured with the endothelial cell monolayers in endothelial cell media (ECM) containing DMEM/F12 supplemented with 20 % bovine platelet poor plasma derived serum (Alfa Aesar, Ward Hill, MA, USA), basic fibroblast growth factor (bFGF) 2 ng/mL, heparin 100μg/ mL, gentamycin 50μg/mL, HEPES 2.5 mM, and hydrocor-tisone 500 nM (all from Life Technologies, Carlsbad, CA, USA). Under these conditions, the BMEC and SCMEC monolayers differentiate, express junction-related proteins within 3 days, and remain optimally differentiated during three more days.
Induction and assessment of inflammation Cytokine production
Transport assay
After 24 h inflammation with recombinant rat TNF-α (5 ng/mL, Peprotech), barrier integrity of the in vitro models was controlled with Lucifer Yellow (LY CH lithium salt, Sigma Aldrich), a small hydrophilic molecule (MW 457 g/mol) retained by the monolayers as previously de-scribed [12]. Briefly, quantification of the LY paracellular leakage from the luminal to the abluminal compartment was assessed by fluorimetric analysis (excitation at 430 nm and emission at 535 nm) and expressed in LY permeabil-ity, Pe(LY). Barrier integrity was validated for Pe(LY)below 0.6.10−3cm/min.
Immunocytochemistry
The MEC monolayers were washed three times with PBS 1× (Life Technologies) and gently dissociated from the insert filters followed by a 20-min fixation in paraformaldehyde (PFA) 4 % (w/v) (Sigma Aldrich, Saint-Louis, MO, USA) prior to immunocytochemistry. After three washes with PBS 1× (Life Technologies), the cells were pre-incubated for 30 min at room temperature (RT) with blocking buffer containing BSA 3 % (PAA Laboratories, Velizy-Villacoublay, France) in PBS 1×. The MEC monolayers were stained for 1 h in PBS 1× containing BSA 1 % (PAA Laboratories), with saponine 0.1 % (Sigma Aldrich) for membrane permeabilization, with a rabbit anti-occludin 1.5μg/mL (Life Technologies). Cell nuclei were labeled with Hoechst 33342 1/1000 (Life Technologies) in co-incubation with a donkey anti-rabbit Alexa Fluor 488 secondary antibody (Jackson Immunore-search, West Grove, PA, USA). Cells were washed and mounted in Prolong Gold antifade mounting medium (Life Technologies). The mounted slides were observed with a Leica TCS SP2 confocal microscope (Leica Microsystems, Heidelberg, Germany). High-magnification images were acquired using a 63X HCX PL APO oil immersion objective and analyzed using the NIH ImageJ software (version 1.49o for Mac).
Tissue sampling
The BMEC and SCMEC monolayers (stimulated or not with TNF-α) were pre-incubated on ice with a so-lution of DPBS 1× (without calcium and magnesium) and EDTA 0.25 mM (both from Life Technologies), then mechanically detached with a cell scraper and centrifuged at 1200×g for 10 min. The BMVs and SCMVs were prepared from 5- to 6-week-old Wistar rats according to our previously described protocol [12]. Instead of plating, they were washed with DPBS 1× (Life Technologies) and centrifuged at 1200×g for 10 min. All samples were snap-frozen in liquid nitro-gen for later use or mechanically dissociated in RIPA
buffer (Sigma Aldrich), called lysates (Lt), for western blot analysis.
RNA isolation
Total RNA was isolated from frozen BMEC and SCMEC monolayers or BMVs and SCMVs using the RNeasy plus Universal Mini kit (Qiagen, Courtaboeuf, France), according to the manufacturer’s instructions. RNA con-centration was determined using a Nanodrop 2000 spectrophotometer (ThermoFisher Scientific, Villebon sur Yvette, France) and RNA integrity assessed on an Agilent 2100 Bioanalyzer (Agilent Technologies, Les Ulis, France).
Microarray assay
The transcriptome analysis of BMEC and SCMEC monolayers (stimulated or not with TNF-α) was per-formed on rat Whole Genome Oligo Microarrays; 40,000 genes (Agilent Technologies). Sample amplifi-cation, labeling, and hybridization were performed in line with the Agilent one-color microarray-base ana-lysis (low input quick amp labeling) protocol (Agilent Technologies). Briefly, total RNA was reverse tran-scribed into complementary DNA (cDNA) using the T7 promoter primer. Synthesis of cyanine-3-labeled complementary RNA (cRNA) from cDNA was per-formed in a solution containing dNTP mix, T7 RNA polymerase, and cyanine 3-dCTP and then incubated at 40 °C for 2 h. Labeled cRNA was purified and frag-mented before hybridization on Agilent Rat Gene Ex-pression 4X44K Arrays (Agilent Technologies, ref: G4131F) at 65 °C for 17 h. Raw microarray signals were scanned and extracted using Agilent Feature Ex-traction Software (Agilent Technologies). AgiNDR package was used for quality control and normalization. Quantile methods and a background correction were ap-plied for data normalization. Microarray data are available in the ArrayExpress database [13] under accession num-ber E-MTAB-4696.
Real-time quantitative PCR (RT-qPCR)
from the TaqMan Gene Expression Assays with the following references:
Samples were run in duplicates on the same 96-well plates and analyzed with the 7500 Software v2.0 (Applied Biosystems). Relative expression levels were determined according to the ΔΔCt method where the expression level of the mRNA of interest is given by 2-ΔΔCTwhere ΔΔCT =ΔCT target mRNA – ΔCT reference mRNA (Gapdh for the MECs,Actb and Rpl13for the MVs) in the same sample.
Western blot analysis
The lysates (Lt) from BMEC monolayers (stimulated or not with TNF-α), BMVs, and SCMVs were defrosted and centrifuged at 13,000×g for clarification. Protein con-centrations were determined using the Lowry method (Bio-Rad, Hercules, CA, USA). After boiling, aliquots containing equal amounts of protein were loaded in Laemmli buffer and separated by 8.5 % sodium dodecyl sulfate (SDS) polyacrylamide (Bio-Rad) gel electrophoresis (PAGE) using a MiniBlot system (Bio-Rad). Proteins were transferred onto nitrocellulose membranes (Amersham Biosciences, Buckinghamshire, UK) in transfer buffer (Tris 25 mM, glycine 192 mM, ethanol 20 %). Membranes were incubated overnight in blocking buffer at 4 °C and then probed with primary antibodies diluted in blocking buffer (TBS with milk 5 % and Tween20 0.2 %). The following antibodies were used: goat anti-β-actin HRP 1/5000 (Santa
Cruz, Dallas, Texas, USA), mouse anti-claudin-5 2μg/mL (Life Technologies), rabbit anti-ZO-1 2 μg/mL (Life Technologies), rabbit anti-occludin 2 μg/mL (Life Technologies), rabbit anti-HOXA9 1.5 μg/mL (Novus biological, Littleton, CO, USA), rabbit anti-HOXB7 0.5μg/mL (Proteintech, Rosemont, IL, USA), rabbit anti-TNFR1 0.5 μg/mL (Proteintech), and rabbit anti-TNFR2 0.5μg/mL (Proteintech). After washing, membranes were incubated with appropriate secondary horseradish perox-idase (HRP)-conjugated IgG antibodies 1/2000 (Jackson Immunoresearch). Finally, proteins were detected using a chemiluminescence kit (Roche Diagnostics, Mannheim, Germany) revealed with the G:Box chemi xx6 system (Syngene, Cambridge, UK). Films were digitized using GeneSys software (Syngene) and optical densities of the bands were assessed using the NIH ImageJ software.
Design of the study and data analysis
For microarray-based transcriptomic analysis, two inserts containing the BMEC or SCMEC monolayers, stimulated or not with TNF-α 5 ng/mL for 12, 24, and 48 h, were pooled for RNA isolation. The transcriptome analysis was performed twice from independent in vitro BBB and BSCB model preparations and TNF-α induction (duplicates). For the basal differential gene expression analysis, the ratio of the values in BMECs versus SCMECs or BMVs versus SCMVs was filtered based on a fold change (FC)
≥1.45. For the differential gene expression analysis in response to TNF-α, the values of the induction versus control at the same time points were filtered based on a FC≥1.45 and <2 (genes moderately induced) or a FC
≥2 (genes highly induced). Only genes exhibiting the defined FCs for all combinations between duplicates were considered.
For BMEC or SCMEC analysis (RT-qPCR, ELISA, western blot, permeability), at least three inserts (trip-licates) containing the MEC monolayers were used and all experiments were repeated at least three times from independent in vitro BBB and BSCB model prep-arations. All data are expressed as means ± standard deviations. The values were compared using Student’s t test. Results were considered statistically significant atp≤0.05 (*),p≤0.01 (**), orp≤0.001 (***). BMV and SCMV analyses (RT-qPCR and western blot) were based on three independent pools of at least six rats.
Transcript data mining
Biological interpretation of the transcriptomic data was performed using the Java/Perl software PredictSearch®, which has been previously described [14–16]. This soft-ware characterizes the pathways and functional networks in which the selected genes are involved.
Genes ID
Bgn Rn01529734
Col3a1 Rn01437681
Col1a2 Rn01526721
Cldn9 Rn01460292
Spp1 Rn01449972
Ctgf Rn01537279
Tgfb2 Rn00579674
Tnfrsf1b Rn00709830
Mmp9 Rn00579162
Mmp13 Rn01448199
Mmp3 Rn00591740
Mmp12 Rn00588640
Mmp14 Rn00579172
Hoxa9 Rn03416316
Hoxb7 Rn01464078
Ccl2 Rn00580555
Gapdh Rn01775763
Actb Rn00667869
Results and discussion
Basal differential gene expression in BMECs and SCMECs
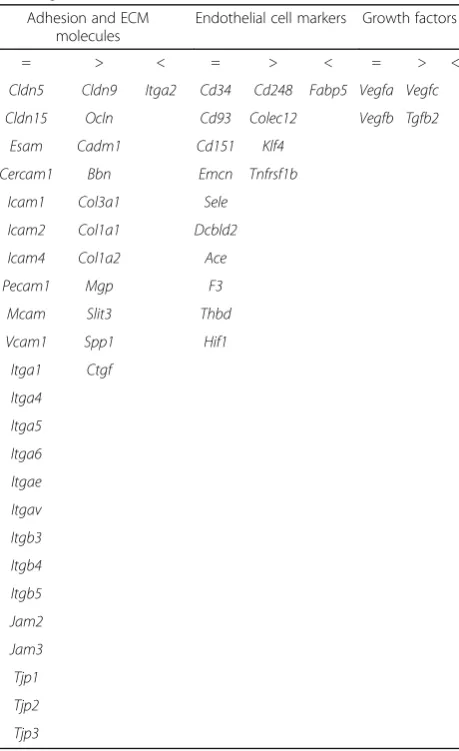
To identify genes that presented a distinct basal expres-sion in BMECs and SCMECs, different criteria were ap-plied on the transcriptomic data. Only values for all controls higher than the background (according to Agilent calculations) were considered. In a first approach, ratios (BMEC values versus SCMEC) were filtered based on a fold change (FC)≥1.45. Only genes exhibiting the defined FCs for all combinations between duplicates were consid-ered. These criteria led to select 648 genes exhibiting a higher expression in BMECs and 444 with a higher ex-pression in SCMECs. Further analysis indicated that a high number of genes encoding known endothelial markers [17] and adhesion/TJ molecules have a similar expression pattern in BMECs and SCMECs (Table 1). However, some of the genes related to the extracellular matrix (ECM)
such asBgn(biglycan),Col3a1(collagen type III alpha 1), Col1a1(collagen type I alpha 1),Col1a2 (collagen type I alpha 2), Slit3 (slit guidance ligand 3), Mgp (matrix Gla protein), Spp1 (secreted phosphoprotein 1/osteopontin), Ctgf (connective tissue growth factor), and Cldn9 (clau-din-9) were among the most strongly expressed genes in BMECs (Table 1). Other highly expressed BMEC genes (data not shown) were related to either cellular messen-gers within the central and peripheral nervous systems: Gal(galanin),Geft(Rho guanine nucleotide exchange fac-tor 25),Nsg1(neuron specific gene family member 1),Npy (neuropeptide Y); atherosclerosis: Ldb2 (LIM domain binding 2), Xdh (xanthine dehydrogenase), Il1rl1/Il33r (interleukin 1 receptor like 1); or fatty acid metabolism: Lpl (lipoprotein lipase), and Apoe (apolipoprotein E). Among the genes encoding growth factors, only Vegfc (vascular endothelial growth factor C) and Tgfb2 (trans-forming growth factor beta 2) exhibited a differential expres-sion (Table 1). High basal expresexpres-sion of Tgfb2 in BMECs might be correlated to the higher expression of TGF-β-target genes such asBgn,Ctgf, and collagens [18–20].
Thus, the transcriptomic analysis of SCMEC and BMEC monolayers showed differential basal expression of a significant number of genes indicative of phenotyp-ical differences between these two CNS endothelial cell types. Indeed, distinct and characteristic gene expression profiles were found among blood vessels and MECs from different tissues [21]. For instance, TGF-β2 was reported to be higher in primary human cerebral endothelial cells (HCECs) than in human umbilical vein endothelial cells (HUVECs) at both mRNA and protein levels [22]. How-ever, at this stage, we cannot exclude that the gene expres-sion profile in BMECs and SCMECs resulted from the cell culture conditions or a technical bias.
To investigate whether these differences at the basal expression level exist also in vivo, RT-qPCR was per-formed on RNA from freshly extracted BMVs and SCMVs as the in vivo tissues closest to cultured MECs. With the exception of Spp1, RT-qPCR confirmed the differential expression observed in the transcriptomic analysis forBgn,Col3a1,Col1a2, Cldn9,Ctgf, and Tgfb2 (Table 2). Among these transcripts,Cldn9 exhibited the strongest differential expression in vivo. Although the functional impact of such a difference inCldn9basal ex-pression between BMECs and SCMECs remains unclear, the level of its expression in BMECs could reflect a distinct degree of activation of signaling components. Indeed, it was shown that silencing of c-Jun NH(2)-terminal kinases (JNKs), JNK1 or JNK2, increased CLDN9 mRNA expression in epithelial cells [23]. Thus, it can be postulated that differential Cldn9 expression might reflect different basal activities of JNKs in BMVs and SCMVs, which consequently would impact the barrier integrity through the modulation of claudins.
Table 1Comparative basal expression of selected endothelium-related genes in BMECs and SCMECs
Adhesion and ECM molecules
Endothelial cell markers Growth factors
= > < = > < = > <
Cldn5 Cldn9 Itga2 Cd34 Cd248 Fabp5 Vegfa Vegfc
Cldn15 Ocln Cd93 Colec12 Vegfb Tgfb2
Esam Cadm1 Cd151 Klf4
Cercam1 Bbn Emcn Tnfrsf1b
Icam1 Col3a1 Sele
Icam2 Col1a1 Dcbld2
Icam4 Col1a2 Ace
Pecam1 Mgp F3
Mcam Slit3 Thbd
Vcam1 Spp1 Hif1
Itga1 Ctgf
Itga4
Itga5
Itga6
Itgae
Itgav
Itgb3
Itgb4
Itgb5
Jam2
Jam3
Tjp1
Tjp2
Tjp3
Ratio of the values in BMECs versus SCMECs was filtered by the following FCs. FCs <1.45 and >0.69 correspond to a similar expression between BMECs and SCMECs (=). FCs≥1.45 correspond to a higher expression in BMECs (>). FCs
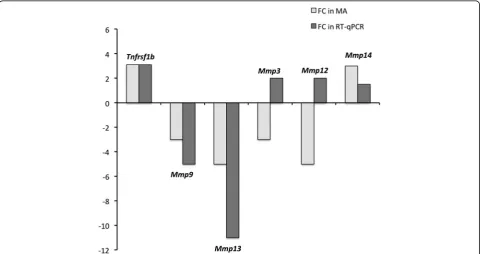
As shown in Fig. 1, we also observed differential expres-sion of other genes such asTnfrsf1b,Mmp9,Mmp13, and to a lesser extent of Mmp14 in BMVs and SCMVs that followed the expression pattern deduced from the tran-scriptomic data in BMEC and SCMEC monolayers. In contrast, RT-qPCR forMmp3 andMmp12 in BMVs and SCMVs led to opposite values when compared to the tran-scriptomic analysis (Fig. 1), which might illustrate differ-ences between cultured MEC monolayers and freshly extracted MVs.
Basal differential expression of the HOX gene family in BMECs and SCMECs
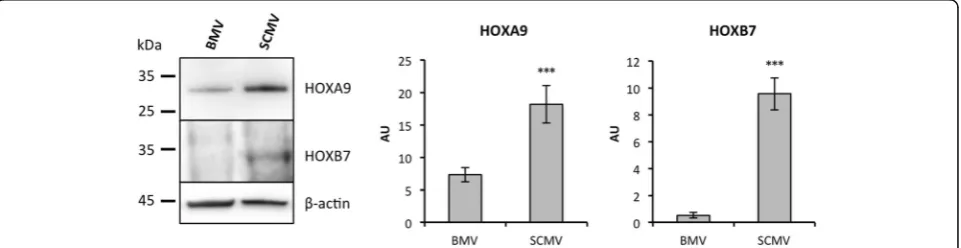
The basal differences observed between BMECs and SCMECs at the gene expression level suggested differen-tial regulation of master program genes involved in cell differentiation. Interestingly, among the top 50 genes presenting higher expression in SCMECs than in BMECs, Hoxa9and Hoxb7were listed in the first rank and these results were confirmed using RT-qPCR (not shown). Moreover, other members of the same family exhibited a similar profile (Table 3). Similar differences were observed in vivo when Hoxa9and Hoxb7 expression was assessed on mRNAs extracted from BMVs and SCMVs. Using RT-qPCR, we found higher expression levels of Hoxa9 and Hoxb7 mRNAs in SCMVs compared to BMVs (Table 3). Western blot performed on protein extracts generated from BMV and SCMV samples confirmed differential expression of HOXA9 and HOXB7 at the protein level (Fig. 2).
Hox genes encode transcriptional factors of the homeobox (HOX) protein family. Expression of these genes is involved in morphogenesis and differentiation and is spatially and temporally regulated during em-bryonic development. The role of HOXA9 is critical for endothelium commitment resulting from the dif-ferentiation of circulating endothelial progenitor cells into mature endothelial cells [24]. On the other hand, HOXB7 was reported to act as a key factor upregulating a
Table 2In vivo validation of endothelium-related genes highly expressed in BMECs compared to SCMECs
Gene Probe MA (in vitro) RT-qPCR (in vivo)
Bgn A_43_P11812 22.9 1.5
Col3a1 A_44_P146518 20.9 2.3
Col1a1 A_44_P238421 17.2 ND
Col1a2 A_43_P12783 13.6 1.9
Slit3 A_44_P1024315 12.8 ND
Mgp A_42_P588944 12.3 ND
Cldn9 A_44_P419898 10.0 46.2
Spp1 A_44_491796 4.9 0.5
Ctgf A_42_P484738 4.8 2.1
Tgfb2 A_44_P246538 2.5 1.9
Ratio of the values in BMEC versus SCMEC monolayers (MAmicroarray) and freshly extracted BMVs versus SCMVs (RT-qPCR)
variety of pro-angiogenic stimuli leading to increased matrix metalloproteinase-9 (MMP9) expression [25], which is in line with its higher expression in SCMVs (Fig. 2). Recently, a transcript analysis study revealed shared and differential patterns ofHox gene expression between endothelial cells from different vascular beds [26]. Hoxd1, Hoxd3, Hoxd4, Hoxd8, and Hoxd9 were found to be expressed at a higher level in blood-derived outgrowth endothelial cells (BOECs) than in pulmonary artery endothelial cells (PAECs). It was suggested that the HOX clusters Hoxa7-10 and Hoxb5-7, which were consistently expressed in BOECs, HUVECs, and human aortic endothelial cells (HUAECs), remain expressed in differentiated endothelial cells. In line with this study, our results showing a differential expression in micro-vessels of distinct vascular beds sustain the possibility that Hox genes, known as master regulators of pos-itional identity, can define endothelial phenotypes. It is tempting to speculate that upstream epigenetic events, which are known to regulateHoxgene expression [27], are responsible for these different endothelial pheno-types. Indeed,Hoxgene expression during development undergoes tight spatiotemporal regulation, partly by chromatin structure and epigenetic factors [28].
Par-ticularly, HOXA9 expression was found to be
downregulated by histone deacetylase (HDAC) inhibi-tors while its overexpression partially rescued the endo-thelial differentiation of adult progenitor cells blocked by these inhibitors [29]. Although the impact of such differences in Hox gene expression in SCMEC and BMEC monolayers is unclear, it can be postulated that they might influence the intrinsic capacity of MECs to respond to external stimuli, such as pro-inflammatory cytokines.
BMEC and SCMEC inflammatory responses
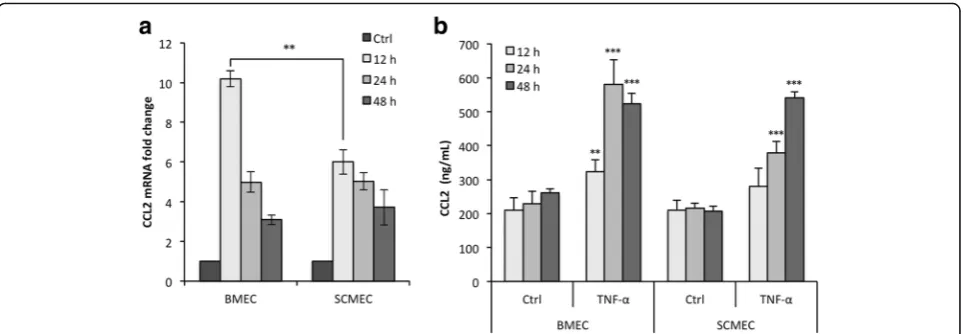
To investigate whether rat BMEC and SCMEC mono-layers respond differently to pro-inflammatory cytokines, they were either treated with TNF-αfor 12, 24, and 48 h or left untreated. Validation of the TNF-α response in these cellular models was achieved by following expres-sion and secretion of CCL2 in all tested conditions (Fig. 3). RT-qPCR showed that the steady state levels of CCL2 mRNA increased rapidly in BMECs after 12 h of TNF-αtreatment and then decreased progressively from 24 to 48 h (Fig. 3a). Although a similar TNF-αresponse was observed in SCMECs, the level of induction at 12 h was much lower than in BMECs. The inflammatory
re-sponse of BMECs and SCMECs to TNF-α was
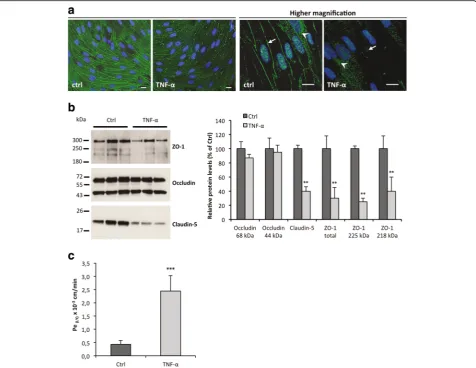
con-firmed by measuring CCL2 protein levels in the culture supernatants (Fig. 3b). TNF-α-induced secretion of CCL2 was maximal at 24 h in BMECs and at 48 h in SCMECs. TJ proteins are essential in BBB homeostasis and among them, occludin, ZO-1, and claudins in different vascular beds show differential expression in development, path-ology, and BBB demise [1]. Occludin immunostaining in TNF-α-treated BMEC and SCMEC (not shown) monolayers systematically showed decreased tight junc-tion/pericellular distribution and cytoplasmic/vesicular-like distribution compared to non-treated cells (Fig. 4a). This altered distribution was not associated with overall changes in occludin steady state levels as shown by
Table 3Basal differentialHoxgene expression in BMECs compared to SCMECs
Gene Probe MA (in vitro) RT-qPCR (in vivo)
Hoxa9 A_44_P129029 0.04 0.002
Hoxa5 A_44_P292669 0.30 ND
Hoxb7 A_44_P266984 0.04 0.003
Hoxb9 A_44_P205783 0.60 ND
Hoxd9 A_44_P436218 0.20 ND
Ratio of the values in BMEC versus SCMEC monolayers (MAmicroarray) and freshly extracted BMVs versus SCMVs (RT-qPCR)
western blot analysis in BMEC monolayers (Fig. 4b). Higher doses of TNF-α(100 ng/mL) on epithelial Caco-2 monolayers followed by western blot analysis have been shown to decrease levels of phosphorylated occludin (85 kDa), but had no effect on the non-phosphorylated form (65 kDa) [30]. Our results suggest that the MEC monolayers may express mainly the non-phosphorylated form of occludin, with no effect of TNF-αon steady state levels. In contrast, western blot analysis of claudin-5 and ZO-1 (Fig. 4b) indicated decreased steady state levels of these TJ proteins. Together, changes in occludin distribu-tion and decreased claudin-5 and ZO-1 strongly suggested disruption of MECs monolayer integrity by TNF-α. This was confirmed by the increased Lucifer Yellow (LY) para-cellular leakage in the abluminal compartment as shown for the BMEC monolayer, (Fig. 4c), in agreement with pre-vious studies [12, 31, 32].
Transcriptomic analysis of BMECs and SCMECs in response to TNF-α
Transcriptomic analysis performed on rat MEC mono-layers confirmed at the transcript level the decreased ex-pression of Cldn5 (claudin-5) upon TNF-α treatment at all time points in both BMECs and in SCMECs (Table 4). Such a transcriptional repression of Cldn5was reported to be triggered via nuclear factor kappa B (NFkB) signal-ing activity in retinal endothelial cells [33]. Like for Cldn5, expression of Cldn9 was strongly repressed by TNF-αin both BMECs and SCMECs at nearly all kinetic time points (data not shown). This downregulation of genes involved in TJ formation is likely associated with the TNF-α-induced opening of the BBB.
Analysis of the overall transcriptomic data showed that TNF-α induction was consistently more efficient in BMECs and appeared earlier than in SCMECs (Fig. 5). Indeed, in BMECs, the number of genes whose
expression was moderately induced by TNF-α(FC≥1.45 and <2) reached a peak at 12 h, then decreased in the course of time (Fig. 5a). Within the same FC range, the maximal number of genes more strongly induced in SCMECs was higher at 24 h, then decreased at 48 h but remained slightly higher than that in BMECs (Fig. 5a). For a FC≥2, the number of induced genes increased from 12 to 24 h in SCMECs while it decreased in BMECs (Fig. 5b). This differential induction might reflect either the presence of cell-type specific TNF-αrelated signal-ing factors or distinct basal activities of these factors in BMECs and SCMECs.
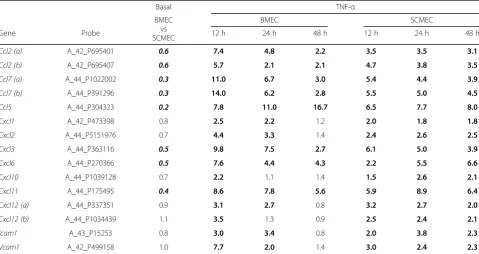
To confirm the differential TNF-αresponse in BMECs and SCMECs, we investigated the expression levels of several known TNF-α targeted genes such as those en-coding chemokines, including CCL2 and adhesion mole-cules (ICAM1, VCAM1). Most of these genes exhibited a stronger induction upon TNF-α treatment in BMECs compared to SCMECs at 12 h while, except forCcl5, the opposite was true at 48 h in SCMECs (Table 5). Basal expression of these genes was either similar in the two cell types or higher in SCMECs (Table 5).
endoperoxide synthase 2), andPtges(prostaglandin E syn-thase), a higher basal expression in SCMECs (Table 6).
Overall, our results indicate that TNF-α induced the expression of similar sets of genes in BMECs and SCMECs with, however, distinct efficiency and/or kinet-ics. Such a finding in primary cell cultures is in line with the generalized notion that responses of human MECs (HMECs) and macrovascular human umbilical vein ECs (HUVECs) to inflammatory molecules are basically com-parable. Nevertheless, a considerable number of genes could also be regulated in a distinct manner in different EC types [37, 38] depending on the time points. It is noteworthy to mention that most of these reports ana-lyzing differential TNF-α induced gene expression in
Table 4TNF-αmodulated expression of genes encoding TJ proteins in BMECs and SCMECs
Basal TNF-α
BMEC vs SCMEC
BMEC SCMEC
Gene Probe 12 h 24 h 48 h 12 h 24 h 48 h
Ocln (a) A_43_P12552 1.7 0.7 0.5 0.5 0.5 0.6 0.9
Ocln (b) A_44_P1007729 1.7 0.8 0.5 0.7 0.5 0.7 1.0
Cldn5 A_43_P15791 0.8 0.5 0.5 0.4 0.6 0.4 0.4
Ratio of the values in BMECs versus SCMECs and in TNF-αtreated cultures after 12, 24, and 48 h versus non-treated cultures were filtered for FC≥1.45 (in bold) or FC≤0.69 (in bold and in italic)
Fig. 4TNF-αeffects on MEC monolayers integrity (24 h incubation).aRepresentative photomicrographs of BMEC monolayers fixed, permeabilized, and stained with an antibody directed against occludin (scale bars, 10μm). Nuclei are stained with Hoechst.Arrowsindicate pericellular localization of TJ protein occludin, whilearrowheadspoint to cytoplasmic/vesicular of occludin. Note the decreased pericellular and increased cytoplasmic/vesicular distribution of occludin upon TNF-αtreatment.bWestern blot analysis (left panel) and quantification (right panel) of TJ proteins ZO-1, occludin, and claudin-5 levels were performed in whole tissue lysates from BMEC monolayers. Quantification of the optical densities of each band was assessed using the NIH ImageJ software. Values deduced from non-treated cultures (Ctrl) were considered as 100 %.cBarrier integrity was assessed by quantification of the Lucifer Yellow (LY) endothelial permeability, Pe(LY). The loss of barrier integrity was validated for Pe(LY)above 0.6.10−
3
ECs were performed for an incubation period not ex-ceeding 12 h. As mentioned above, one possibility is that basal expression or activity levels of signal transducers might impact the level or the delay of the TNF-α re-sponse in BMECs and SCMECs.
TNF-α-induced expression ofTnfrsf1bis restricted to SCMECs
To investigate whether the delay of response in BMECs and SCMECs was correlated with differences in TNF signaling, we assessed whether genes encoding known
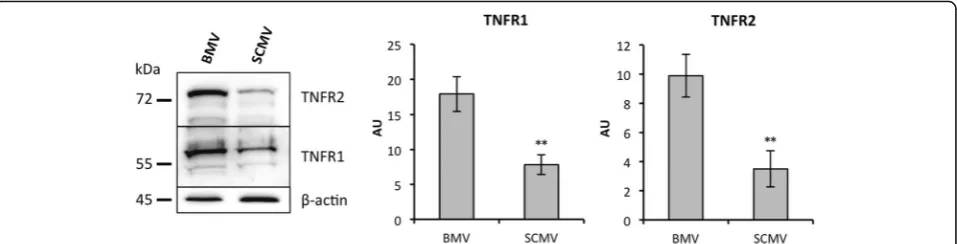
factors involved in this pathway were modulated. Inter-estingly, while a slight difference was observed between BMECs and SCMECs for Tnfrsf1aencoding TNFR1/p55, expression ofTnfrsf1bencoding TNFR2/p75 was higher in BMECs compared to SCMECs (Table 7). Western blots performed on protein extracts generated from freshly ex-tracted BMV and SCMV samples confirmed higher TNFR1 and TNFR2 protein levels (2.3- and 2.8-fold, re-spectively) in BMVs (Fig. 6). However, no difference was observed for genes encoding other TNF-related receptor members or products involved in the TNF signaling Fig. 5Kinetics of global transcriptomic effects of TNF-αin BMEC and SCMEC monolayers. Genes moderately induced and highly induced upon TNF-αtreatment at either 12, 24, or 48 h were selected according to their FCs (a1.45≤FC < 2 andbFC≥2, respectively)
Table 5TNF-αmodulated expression of known TNF-αtargeted genes (chemokines and adhesion molecules) in BMECs and SCMECs
Basal TNF-α
BMEC vs SCMEC
BMEC SCMEC
Gene Probe 12 h 24 h 48 h 12 h 24 h 48 h
Ccl2 (a) A_42_P695401 0.6 7.4 4.8 2.2 3.5 3.5 3.1
Ccl2 (b) A_42_P695407 0.6 5.7 2.1 2.1 4.7 3.8 3.5
Ccl7 (a) A_44_P1022002 0.3 11.0 6.7 3.0 5.4 4.4 3.9
Ccl7 (b) A_44_P391296 0.3 14.0 6.2 2.8 5.5 5.0 4.5
Ccl5 A_44_P304323 0.2 7.8 11.0 16.7 6.5 7.7 8.0
Cxcl1 A_42_P473398 0.8 2.5 2.2 1.2 2.0 1.8 1.8
Cxcl2 A_44_P5151976 0.7 4.4 3.3 1.4 2.4 2.6 2.5
Cxcl3 A_44_P363116 0.5 9.8 7.5 2.7 6.1 5.0 3.9
Cxcl6 A_44_P270366 0.5 7.6 4.4 4.3 2.2 5.5 6.6
Cxcl10 A_44_P1039128 0.7 2.2 1.1 1.4 1.5 2.6 2.1
Cxcl11 A_44_P175495 0.4 8.6 7.8 5.6 5.9 8.9 6.4
Cxcl12 (a) A_44_P337351 0.9 3.1 2.7 0.8 3.2 2.7 2.0
Cxcl12 (b) A_44_P1034439 1.1 3.5 1.3 0.9 2.5 2.4 2.1
Icam1 A_43_P15253 0.8 3.0 3.4 0.8 2.0 3.8 2.3
Vcam1 A_42_P499158 1.0 7.7 2.0 1.4 3.0 2.4 2.3
pathway such asBirc2(protein: c-IAP1),Birc3(protein: c-IAP2),Tradd,Traff-2/3, Rela, Nfkb-1/2, Nfkbi-a/b, Ikbkb, Jun, Junb, and Jund (Additional file 1: Table S1). Among all genes encoding TNF-αreceptors,Tnfrsf11bwas signifi-cantly induced by TNF-αat all time points in BMECs and at 24 and 48 h in SCMECs, whileTnfrsf1bwas induced at 24 and 48 h in SCMECs but not in BMECs (Table 7).
TNFR1 and TNFR2 elicit distinct features [39]. Soluble TNF (sTNF) only activates TNFR1, while membrane-bound TNF (mTNF) activates both receptors [40, 41]. In contrast to TNFR1 expressed in nearly all cells, TNFR2, which can be recognized by both TNF-αand LTA (TNF-β) ligands, is limited to some cell types including endothelial cells [42]. TNFR1 and TNFR2 subunits form a hetero-complex leading to NFkB/MAPK and NFkB/PI3K-AKT-dependent NFkB/JNK signaling pathways, respectively, which trigger distinct impacts on apoptosis, proliferation, and survival [43–46]. On the other hand, it was postulated that the observed variability in TNF-induced CXCR3 che-mokine expression in different microvascular beds might depend on the endothelial TNFR2 expression according to distinct anatomic loci [47].
Thus, one may speculate that the relative higher abundance of TNF-αreceptors in BMECs compared to SCMECs could trigger a more rapid and stronger TNF-α response. In contrast to BMECs, SCMECs could require
Table 6TNF-αmodulated expression of the top ten upregulated genes in BMECs (A) and SCMECs (B)
A Basal TNF-α
BMEC vs SCMEC BMEC SCMEC
Gene Probe 12 h 24 h 48 h 12 h 24 h 48 h
Mmp3 A_44_P318318 0.4 34.9 9.1 3.1 7.1 7.0 5.1
Mmp12 A_44_P555271 0.2 33.6 25.6 7.6 6.6 6.9 6.5
Mmp13 A_42_P606126 0.2 31.4 8.8 2.4 5.7 2.9 3.1
Mmp10 A_44_P404861 0.2 16.5 8.8 10.0 6.9 8.3 9.7
Cd69 A_43_P16166 0.5 14.7 11.6 3.2 8.4 6.7 4.8
Ubd A_42_P602724 0.5 14.6 10.1 8.7 4.2 7.4 5.0
Ccl7 A_44_P391296 0.3 13.6 6.2 2.8 5.5 5.0 4.5
Ass1 A_44_P391296 1.6 13.3 14.5 5.2 7.9 9.2 7.4
Ptgs2 A_44_P472989 1.0 12.5 10.7 2.9 5.2 6.5 3.6
Mmp9 A_42_P606126 0.3 12.1 22.2 22.6 6.4 5.2 7.5
B Basal TNF-α
BMEC vs SCMEC SCMEC BMEC
Gene Probe 12 h 24 h 48 h 12 h 24 h 48 h
Mmp9 A_44_P501112 0.5 10.2 7.9 9.9 11.7 20.6 17.6
Cd69 A_43_P16166 0.5 8.4 6.7 4.8 14.7 11.6 3.2
Ass1 A_44_P391296 1.6 7.9 9.2 7.4 13.3 14.5 5.2
Ptges A_43_P12079 1.1 7.3 5.9 4.9 7.2 6.1 4.3
Mmp3 A_44_P318318 0.4 7.1 7.0 5.1 34.9 9.1 3.1
Mmp10 A_44_P404861 0.2 6.9 8.3 9.7 16.5 8.8 10.0
Mmp12 A_44_P555271 0.2 6.6 6.9 6.5 33.6 25.6 7.6
Ccl5 A_44_P304323 0.2 6.5 7.7 8.0 7.8 11.0 16.7
Cxcl3 A_44_P363116 0.5 6.1 5.0 3.9 9.8 7.5 2.7
Cxcl11 A_44_P175495 0.4 5.9 8.9 6.4 8.6 7.8 5.6
Ratio of the values in BMECs versus SCMECs and in TNF-αtreated cultures after 12, 24, and 48 h versus non-treated cultures were filtered for FC≥1.45 (in bold) or FC≤0.69 (in bold and in italic)
Table 7TNF-αmodulated expression of TNF-αreceptor genes in BMECs and SCMECs
Basal TNF-α
BMEC vs SCMEC
BMEC SCMEC
Gene Probe 12 h 24 h 48 h 12 h 24 h 48 h
Tnfrsf1a A_43_P15259 1.5 0.6 0.6 0.9 0.8 0.9 0.7
Tnfrsf1b A_43_P533794 3.1 1.3 0.6 1.1 1.4 2.8 2.3
Tnfrsf11b A_44_P458021 0.9 4.4 2.4 2.3 1.4 2.9 2.9
the TNF induction of at leastTnfrsf1bexpression to elicit a full, albeit delayed, TNF-αresponse.
Noteworthy, only two other genes, Tgfb2 and Prkcb, exhibited an expression pattern similar toTnfrsf1b, which is higher in BMECs vs SCMECs (2.5- and 2.3-fold, re-spectively) and induced 2.5-fold by TNF-αat 24 and 48 h in SCMECs (not shown). It is likely that the higher basal expression ofPrkcbin BMECs sustained the stronger and earlier TNF-αresponse in these cells since this gene en-codes protein kinase Cβ, which plays a major role in TNF-α-induced human vascular endothelial cell apoptosis [48].
Conclusions
The main finding of this study supports the idea that the Hoxgene expression pattern termed in a recent report the “HOX code” [26] can define distinct endothelial pheno-types. Indeed, our data demonstrate that at least HOXA9 and HOXB7 were more abundant at the mRNA and pro-tein levels in MECs and freshly extracted MVs from the spinal cord than those from the brain. In addition to its critical role for endothelial commitment during progenitor cell maturation [24], HOXA9 might be involved in main-taining a specific differentiation status in mature ECs through its control of the basal expression of its gene tar-gets. In turn, HOXB7 was shown to act as a key factor to upregulate a variety of pro-angiogenic stimuli [25]. Al-though the impact of distinct levels of these factors in BMVs and SCMVs remains to be elucidated, it is tempting to speculate that they may control the EC response to ex-ternal stimuli such as the TNF response. For instance, the involvement of HOXA9 in maintaining ECs in a “basal” state along with its inhibitory effect on NFkB-dependent transcriptional activation of endothelium has been re-ported [49]. Thus, while low HOXA9 abundance in BMECs might account for a sustained TNF response, its higher level in SCMECs would impair this response at an early stage, explaining the distinct efficiency and kinetics of the TNF response observed in the two cell types. At
later stages, the TNF induction ofTnfrsf1b, specifically in SCMECs, may allow a full TNF response.
Overall our work highlights that basal gene expression is differentially regulated within ECs depending on dis-tinct vascular beds and may account for different re-sponses to inflammatory mediators. It can be expected that the identification of these mechanisms and the resulting functions will allow improvement of models for vascular development and plasticity as well as manipula-tion of EC phenotypes for therapeutic applicamanipula-tions.
Additional file
Additional file 1: Table S1.TNF-αmodulated expression of genes involved in the TNF-αsignaling pathway in BMECs and SCMECs. (DOC 53 kb)
Abbreviations
B:Brain; FC: Fold change; MEC: Microvascular endothelial cell; MV: Microvessel; SC: Spinal cord; TJ: Tight junction; TNF: Tumor necrosis factor
Acknowledgements
Not applicable.
Funding
The UMR7259 laboratory acknowledges funding from the CNRS and from Aix-Marseille Université (AMU). Financial support to VECT-HORUS is acknowledged from the Fonds Unique Interministériel (FUI/MEDUL project), to MK, the UMR7259 laboratory and VECT-HORUS from the Agence Nationale de la Recherche (ANR) for the TIMPAD and PREVENTAD collaborative projects, for the DHUNE project supported by A*MIDEX, and to MK from LECMA.
Availability of data and materials
Microarray raw data supporting the conclusions of this article are available in the ArrayExpress database [13] under accession number E-MTAB-4696 (Username: Reviewer_E-MTAB-4696; Password: tskid0oh).
Authors’contributions
YM, PB, and MK designed and analyzed the experiments. YM and FJ carried out the experiments based on the in vitro models of the BBB and BSCB, inflammation, and microvessels. PB carried out the analysis and interpretation of the transcript data. ABe carried out the RT-qPCR experiments. ABo and NG carried out the western blot experiments. YM, PB, and MK drafted the manuscript. All authors read and approved the final manuscript.
Competing interests
Michel Khrestchatisky is the director of the UMR7259 laboratory, co-founder, share holder, and scientific counsel of the VECT-HORUS biotechnology company. The other authors declare that they have no competing interests.
Consent for publication
Not applicable.
Ethics approval
Procedures involving animals conform to National and European regulations (EU directive No. 2010/63) and to authorizations delivered to our animal facility (No. C13 055 08) and to the project (No. 00757.02) by the Local Ethics Committee and French Ministry of Research. All efforts were made to minimize animal suffering and reduce the number of animals used.
Author details
1Vect-Horus SAS, Faculté de Médecine - Secteur Nord, 51 Bd Pierre Dramard,
13344 Marseille Cedex 15, France.2Aix Marseille Univ, CNRS, NICN, Marseille, France.
Received: 27 May 2016 Accepted: 18 October 2016
References
1. Abbott NJ, Patabendige AA, Dolman DE, Yusof SR, Begley DJ. Structure and function of the blood-brain barrier. Neurobiol Dis. 2010;37:13–25. 2. Bartanusz V, Jezova D, Alajajian B, Digicaylioglu M. The blood-spinal cord
barrier: morphology and clinical implications. Ann Neurol. 2011;70:194–206. 3. Zhang B, Gensel JC. Is neuroinflammation in the injured spinal cord
different than in the brain? Examining intrinsic differences between the brain and spinal cord. Exp Neurol. 2014;258:112–20.
4. Sharma HS. Pathophysiology of blood-spinal cord barrier in traumatic injury and repair. Curr Pharm Des. 2005;11:1353–89.
5. Takemura M, Nishiyama H, Itohara S. Distribution of phosphorylated glial fibrillary acidic protein in the mouse central nervous system. Genes Cells. 2002;7:295–307. 6. Winkler EA, Sengillo JD, Bell RD, Wang J, Zlokovic BV. Blood-spinal cord
barrier pericyte reductions contribute to increased capillary permeability. J Cereb Blood Flow Metab. 2012;32:1841–52.
7. Radu BM, Bramanti P, Osculati F, Flonta ML, Radu M, Bertini G, Fabene PF. Neurovascular unit in chronic pain. Mediators Inflamm. 2013;2013:648268. 8. Wu Q, Jing Y, Yuan X, Li B, Wang B, Liu M, Li H, Xiu R. The distinct abilities
of tube-formation and migration between brain and spinal cord microvascular pericytes in rats. Clin Hemorheol Microcirc. 2015;60:231–40. 9. Prockop LD, Naidu KA, Binard JE, Ransohoff J. Selective permeability of
[3H]-D-mannitol and [14C]-carboxyl-inulin across the blood-brain barrier and blood-spinal cord barrier in the rabbit. J Spinal Cord Med. 1995;18:221–6. 10. Pan W, Banks WA, Kastin AJ. Permeability of the brain and
blood-spinal cord barriers to interferons. J Neuroimmunol. 1997;76:105–11. 11. Ge S, Pachter JS. Isolation and culture of microvascular endothelial cells
from murine spinal cord. J Neuroimmunol. 2006;177:209–14.
12. Molino Y, Jabès F, Lacassagne E, Gaudin N, Khrestchatisky M. Setting-up an in vitro model of rat blood-brain barrier (BBB): a focus on BBB
impermeability and receptor-mediated transport. J Vis Exp. 2014;88:e51278. 13. ArrayExpress database. [www.ebi.ac.uk/arrayexpress]. Accession number
E-MTAB-4696.
14. Eyles D, Almeras L, Benech P, Patatian A, Mackay-Sim A, McGrath J, Féron F. Developmental vitamin D deficiency alters the expression of genes encoding mitochondrial, cytoskeletal and synaptic proteins in the adult rat brain. J Steroid Biochem Mol Biol. 2007;103:538–45.
15. Almeras L, Eyles D, Benech P, Laffite D, Villard C, Patatian A, Boucraut J, Mackay-Sim A, McGrath J, Féron F. Developmental vitamin D deficiency alters brain protein expression in the adult rat: implications for neuropsychiatric disorders. Proteomics. 2007;7:769–80.
16. Landel V, Baranger K, Virard I, Loriod B, Khrestchatisky M, Rivera S, Benech P, Féron F. Temporal gene profiling of the 5XFAD transgenic mouse model highlights the importance of microglial activation in Alzheimer’s disease. Mol Neurodegener. 2014;9:33.
17. Garlanda C, Dejana E. Heterogeneity of endothelial cells. Specific markers. Arterioscler Thromb Vasc Biol. 1997;17:1193–202.
18. Chen MM, Lam A, Abraham JA, Schreiner GF, Joly AH. CTGF expression is induced by TGF- beta in cardiac fibroblasts and cardiac myocytes: a potential role in heart fibrosis. J Mol Cell Cardiol. 2000;32:1805–19. 19. Chen WB, Lenschow W, Tiede K, Fischer JW, Kalthoff H, Ungefroren H. Smad4/
DPC4-dependent regulation of biglycan gene expression by transforming growth factor-beta in pancreatic tumor cells. J Biol Chem. 2002;277:36118–28. 20. Fuchshofer R, Birke M, Welge-Lussen U, Kook D, Lütjen-Drecoll E.
Transforming growth factor-beta 2 modulated extracellular matrix component expression in cultured human optic nerve head astrocytes. Invest Ophthalmol Vis Sci. 2005;46:568–78.
21. Chi JT, Chang HY, Haraldsen G, Jahnsen FL, Troyanskaya OG, Chang DS, Wang Z, Rockson SG, van de Rijn M, Botstein D, Brown PO. Endothelial cell diversity revealed by global expression profiling. Proc Natl Acad Sci U S A. 2003;100: 10623–8.
22. Kallmann BA, Wagner S, Hummel V, Buttmann M, Bayas A, Tonn JC, Rieckmann P. Characteristic gene expression profile of primary human cerebral endothelial cells. FASEB J. 2002;16:589–91.
23. Carrozzino F, Pugnale P, Féraille E, Montesano R. Inhibition of basal p38 or JNK activity enhances epithelial barrier function through differential modulation of claudin expression. Am J Physiol Cell Physiol. 2009;297:C775–87.
24. Pirro M, Schillaci G, Menecali C, Bagaglia F, Paltriccia R, Vaudo G, Mannarino MR, Mannarino E. Reduced number of circulating endothelial progenitors and HOXA9 expression in CD34+ cells of hypertensive patients. J Hypertens. 2007;25:2093–9. 25. Carè A, Felicetti F, Meccia E, Bottero L, Parenza M, Stoppacciaro A, Peschle
C, Colombo MP. HOXB7: a key factor for tumor-associated angiogenic switch. Cancer Res. 2001;61:6532–9.
26. Toshner M, Dunmore BJ, McKinney EF, Southwood M, Caruso P, Upton PD, Waters JP, Ormiston ML, Skepper JN, Nash G, Rana AA, Morrell NW. Transcript analysis reveals a specific HOX signature associated with positional identity of human endothelial cells. PLoS ONE. 2014;9:e91334. 27. Srivastava S, Dhawan J, Mishra RK. Epigenetic mechanisms and boundaries in
the regulation of mammalian Hox clusters. Mech Dev. 2015;138(Pt 2):160–9. 28. Barber BA, Rastegar M. Epigenetic control of Hox genes during
neurogenesis, development, and disease. Ann Anat. 2010;192:261–74. 29. Rössig L, Urbich C, Brühl T, Dernbach E, Heeschen C, Chavakis E, Sasaki K, Aicher D,
Diehl F, Seeger F, Potente M, Aicher A, Zanetta L, Dejana E, Zeiher AM, Dimmeler S. Histone deacetylase activity is essential for the expression of HoxA9 and for endothelial commitment of progenitor cells. J Exp Med. 2005;201:1825–35. 30. Cui W, Li LX, Sun CM, Wen Y, Zhou Y, Dong YL, Liu P. Tumor necrosis factor
alpha increases epithelial barrier permeability by disrupting tight junctions in Caco-2 cells. Braz J Med Biol Res. 2010;43:330–7.
31. Cecchelli R, Aday S, Sevin E, Almeida C, Culot M, Dehouck L, Coisne C, Engelhardt B, Dehouck MP, Ferreira L. A stable and reproducible human blood-brain barrier model derived from hematopoietic stem cells. PLoS ONE. 2014;9:e99733.
32. Watson PM, Paterson JC, Thom G, Ginman U, Lundquist S, Webster CI. Modelling the endothelial blood-CNS barriers: a method for the production of robustin vitromodels of the rat blood-brain barrier and blood-spinal cord barrier. BMC Neurosci. 2013;14:59.
33. Aveleira CA, Lin CM, Abcouwer SF, Ambrósio AF, Antonetti DA. TNF-α signals through PKCζ/NF-κB to alter the tight junction complex and increase retinal endothelial cell permeability. Diabetes. 2010;59:2872–82. 34. Rosenberg GA. Matrix metalloproteinases in neuroinflammation. Glia. 2002;
39:279–91.
35. Rivera S, Khrestchatisky M, Kaczmarek L, Rosenberg GA, Jaworski DM. Metzincin proteases and their inhibitors: foes or friends in nervous system physiology? J Neurosci. 2010;30:15337–57.
36. Baranger K, Rivera S, Liechti FD, Grandgirard D, Bigas J, Seco J, Tarrago T, Leib SL, Khrestchatisky M. Endogenous and synthetic MMP inhibitors in CNS physiopathology. Prog Brain Res. 2014;214:313–51.
37. Franzén B, Duvefelt K, Jonsson C, Engelhardt B, Ottervald J, Wickman M, Yang Y, Schuppe-Koistinen I. Gene and protein expression profiling of human cerebral endothelial cells activated with tumor necrosis factor-alpha. Brain Res Mol Brain Res. 2003;115:130–46.
38. Viemann D, Goebeler M, Schmid S, Nordhues U, Klimmek K, Sorg C, Roth J. TNF induces distinct gene expression programs in microvascular and macrovascular human endothelial cells. J Leukoc Biol. 2006;80:174–85. 39. Cabal-Hierro L, Artime N, Iglesias J, Prado MA, Ugarte-Gil L, Casado P,
40. Grell M, Douni E, Wajant H, Löhden M, Clauss M, Maxeiner B, Georgopoulos S, Lesslauer W, Kollias G, Pfizenmaier K, Scheurich P. The transmembrane form of tumor necrosis factor is the prime activating ligand of the 80 kDa tumor necrosis factor receptor. Cell. 1995;83:793–802.
41. Grell M, Wajant H, Zimmermann G, Scheurich P. The type 1 receptor (CD120a) is the high-affinity receptor for soluble tumor necrosis factor. Proc Natl Acad Sci U S A. 1998;95:570–5.
42. Vandenabeele P, Declercq W, Beyaert R, Fiers W. Two tumour necrosis factor receptors: structure and function. Trends Cell Biol. 1995;5:392–9.
43. Fotin-Mleczek M, Henkler F, Samel D, Reichwein M, Hausser A, Parmryd I, Scheurich P, Schmid JA, Wajant H. Apoptotic crosstalk of TNF receptors: R2-induces depletion of TRAF2 and IAP proteins and accelerates TNF-R1-dependent activation of caspase-8. J Cell Sci. 2002;115(Pt 13):2757–70. 44. Li X, Yang Y, Ashwell JD. TNF-RII and c-IAP1 mediate ubiquitination and
degradation of TRAF2. Nature. 2002;416:345–7.
45. Wu CJ, Conze DB, Li X, Ying SX, Hanover JA, Ashwell JD. TNF-alpha induced c-IAP1/TRAF2 complex translocation to a Ubc6-containing compartment and TRAF2 ubiquitination. EMBO J. 2005;24:1886–98.
46. Rauert H, Wicovsky A, Müller N, Siegmund D, Spindler V, Waschke J, Kneitz C, Wajant H. Membrane tumor necrosis factor (TNF) induces p100 processing via TNF receptor-2 (TNFR2). J Biol Chem. 2010;285:7394–404. 47. Ohmori Y, Wyner L, Narumi S, Armstrong D, Stoler M, Hamilton TA. Tumor
necrosis factor-alpha induces cell type and tissue-specific expression of chemoattractant cytokines in vivo. Am J Pathol. 1993;142:861–70. 48. Wang F, Liu HM, Irwin MG, Xia ZY, Huang Z, Ouyang J, Xia Z. Role of protein
kinase C beta2 activation in TNF-alpha-induced human vascular endothelial cell apoptosis. Can J Physiol Pharmacol. 2009;87:221–9.
49. Trivedi CM, Patel RC, Patel CV. Homeobox gene HOXA9 inhibits nuclear factor-kappa B dependent activation of endothelium. Atherosclerosis. 2007;195:e50–60.
• We accept pre-submission inquiries
• Our selector tool helps you to find the most relevant journal
• We provide round the clock customer support
• Convenient online submission
• Thorough peer review
• Inclusion in PubMed and all major indexing services
• Maximum visibility for your research
Submit your manuscript at www.biomedcentral.com/submit