R E S E A R C H
Open Access
Association between perfluoroalkyl acids
and kidney function in a cross-sectional
study of adolescents
Anglina Kataria
1, Howard Trachtman
1, Laura Malaga-Dieguez
1and Leonardo Trasande
1,2,3,4,5,6*Abstract
Background:Perfluoroalkyl acids are synthetic compounds widely used in industrial and commercial applications. Laboratory studies suggest that these persistent and bioaccumulative chemicals produce oxidant stress and damage glomerular endothelial cells, raising concern regarding the impact of these compounds on renal function.
Methods:We performed cross-sectional analyses of data 1960 participants aged 12–19 years of the 2003–2010 National Health and Nutrition Examination Surveys. PFAA exposure was assessed using levels of perfluorooctane sulfonic acid (PFOS), perfluorooctanoic acid (PFOA), perfluorononanoic acid, and perfluorohexane sulfonic acid. Primary study outcomes were estimated glomerular filtration rate (eGFR) and serum uric acid.
Results:While adjusting for demographics, cotinine, prehypertension, insulin resistance, body mass index, and hypercholesterolemia, adolescents in the highest PFOA and PFOS quartile had a lower eGFR, 6.84 mL/min/1.73 m2 (95 % CI: 2.19 to 11.48) and 9.69 mL/min/1.73 m2(95 % CI: -4.59 to 14.78), respectively, compared to the lowest quartile. Highest PFOA and PFOS quartiles were also associated with 0.21 mg/dL (95 % CI: 0.056 to 0.37) and 0.19 mg/dL (95 % CI: 0.032 to 0.34) increases in uric acid, respectively.
Conclusions:PFAAs are associated with a reduction in kidney function and increased uric acid levels in otherwise healthy adolescents. Reverse causation and residual confounding could explain the results. Our study results confirm and amplify previous findings, though longitudinal studies examining prenatal and childhood biomarkers in relationship with robust measures of childhood renal function are needed.
Keywords:Perfluoroalkyl acids, eGFR, Uric acid, Adolescents
Background
Perfluoroalkyl acids (PFAAs) are synthetic organic com-pounds with a totally fluorinated carbon chain of varying length and a negatively charged functional group, such as carboxylic or sulfonic acid [1]. This imparts high sta-bility and thermal resistance to these compounds. PFAAs have found wide utility when polymerized in stain-resistant sprays for carpets and upholstery, fire-retarding foams, and nonstick cooking surfaces and food packaging, such as microwave popcorn bags and pizza packaging [2]. National biomonitoring surveys reveal
that >98 % of the US population have detectable levels of PFAAs in the blood including: perfluorooctane sul-fonic acid (PFOS), perfluorooctanoic acid (PFOA), per-fluorohexane sulfonate (PFHxS) and perfluorononanoic acid (PFNA) [3].
In cell culture studies, exposure of microvascular endothelial cells to PFOS induces endothelial permeabil-ity through increased production of reactive oxidative species at concentrations relevant to human exposures [4]. This is important given that endothelial cells are vital to structure and function of the glomeruli in the kidney. Furthermore, endothelial permeability plays a critical role in ischemic renal injury [5]. The effect of PFOA, PFOS, PFNA and PFHxS on the kidneys is fur-ther magnified by the fact that these compounds are well absorbed orally but have poor renal elimination rates * Correspondence:[email protected]
1
Department of Pediatrics, New York University School of Medicine, 227 East 30th St, Room 735, New York, NY 10016, USA
2
Department of Environmental Medicine, New York University School of Medicine, New York, NY, USA
Full list of author information is available at the end of the article
and half-lives in humans of 2.3-8.5 years [6]. Children and adolescents are uniquely vulnerable to PFOA and PFOS as they have greater food consumption per pound body weight [7]. PFAAs are present in human breast milk, and serum levels in children are generally higher than in adults [6, 8]. Childhood exposure may present the additional risk of disrupting cardiovascular and renal physiologic functions, and so vulnerability may be greater than in adults.
Cross-sectional studies have associated PFAA bio-markers with reduced renal function. In one recent large, community-based study of residents living near a fluoropolymer production facility which resulted in con-tamination of their drinking water with elevated PFOA, serum PFOA, PFOS, PFNA and PFHxS concentrations were inversely correlated with estimated glomerular fil-tration rate (eGFR) in otherwise healthy children and ad-olescents [9]. A study by Shankar et al revealed similar findings in adults [10]. The study also found that PFOA and PFOS were associated with increased odds of chronic kidney disease (CKD), defined as eGFR <60 ml/ min/1.73 m2[10].
Several cross-sectional epidemiological studies in adults and children have also shown a positive association be-tween PFOA and uric acid (UA) [10–13], though one failed to detect such an association [14]. This is relevant since hy-peruricemia has long been thought to be an important marker of renal disease. Moreover, growing evidence sug-gests that hyperuricemia may be part of the causal pathway in the development of hypertension. Numerous clinical studies have shown that elevated UA levels are associated with increased risk of hypertension, independent of other risk factors [15–18]. UA levels >5.5 mg/dL were observed in 90 % of adolescents with essential hypertension, whereas UA levels were significantly lower in controls and teens with either white-coat or secondary hypertension [16]. Finally, hyperuricemia is an independent risk factor for dis-ease progression in pediatric patients with CKD [19].
However, studies to date have not explored the associ-ation between low grade exposure to perfluoroalkyl che-micals in the range commonly experienced by children/ adolescents and kidney function. Therefore, we exam-ined the association of PFAAs with kidney function i.e., eGFR and uric acid in a nationally representative sample of US adolescents. We sought to test the hypothesis that higher levels of exposure to PFAAs would be associated with a decrement in kidney function and an increment in serum uric acid concentration.
Methods
The current study is based on eight years of data (2003– 2010) of 12–19 year olds enrolled in the National Health and Nutrition Examination Survey (NHANES), a continu-ous, multicomponent, nationally representative survey of
the non-institutionalized US population administered by the National Center for Health Statistics (NCHS) of the Centers for Disease Control and Prevention (CDC). Data from questionnaire, laboratory, diet, and physical examin-ation components were used in the present analysis, for which data are available in biennial groupings. NHANES oversamples low-income persons, African-Americans, and Mexican-Americans in order to provide stable estimates of these groups. For participants <18 years of age, in-formed assent was obtained from the participants and informed consent was obtained from the parents or guardians. The survey also includes biomonitoring for perfluoroalkyl chemicals in a random one-third sub-sample of participants by CDC’s National Center for Environmental Health.
Exposure measurements
Perfluoroalkyl chemicals were measured in serum using automated solid-phase extraction coupled to isotope di-lution high-performance liquid-chromatography-tandem mass spectrometry (details summarized elsewhere [20]). Although our study examined all twelve PFAAs surveyed by NHANES, we primarily focused on PFOA, PFOS, PFNA and PFHxS, which were detected in over 97 % of participants. Values below the limit of detection were reported as the limit of detection divided by square root of 2.
Measures of outcome
Serum creatinine (Cr) was measured using the modified kinetic Jaffe reaction on two different instruments over the study period: the Beckman Coulter Synchron LX20 (Beckman Coulter, Fullerton, California) in NHANES 2003–2007 [21], and the Beckman Coulter UniCel®
DxC800 in NHANES 2008–10. A crossover study per-formed on a subsample during the instrumentation change, from the Beckman Synchron LX-20 to the Beck-man Coulter UniCel® DxC800, revealed the 2007 serum
Cr values were slightly higher than the 2008 values. The 2003–2007 Cr values were therefore reduced by 0.08 mg/dL ensuring comparability in the results over the entire study period [22]. In addition, CDC regularly cross-references results to a“gold standard”reference as recommended by the National Kidney Disease Education Program [23]. A comparison of the mean Cr levels of NHANES 2005–06 revealed significant differences be-tween the two methods, requiring additional calibration of the uncorrected values by the following equation: [24]
Corrected Crð20052006Þ¼ 0:016þ0:978
ðNHANES uncalibrated serum Crðmg=dLÞ
Schwartz formula, which has been validated as a meas-ure of kidney function in adolescents, to calculate eGFR (mL/min/1.73 m2) [25].
UA was measured using the Beckman Synchron LX20 system in NHANES 2003–2007 and Beckman Coulter UniCel® DxC800 in NHANES 2008–2010. Detailed
la-boratory procedures for the other analytes including cholesterol and cotinine are available on the CDC web-site [26, 27]. Although measurements were conducted on different instrumentation, CDC has not recom-mended any corrections. To account for possible con-founding by instrumentation method, sensitivity analyses reprised all multivariable analyses by including a covari-ate for NHANES two-year wave of data collection.
Potential confounders
We included and adjusted for various potential con-founders in our multivariable regression models. Height and weight information was collected by trained techni-cians following standardized procedures. BMI z-scores were derived using CDC 2000 norms, incorporating height, weight and age and values >95thpercentile was defined as obese [28].
Blood pressure (BP) was measured by certified exam-iners 3 times in all children aged 8–19 years after 5 min of resting in a sitting position. In cases with 1 or more incomplete or interrupted measurements, a fourth at-tempt was made. Averages of systolic (SBP) and diastolic BP (DBP) measurements were calculated for the purpose of generating categorical BP variables. As BP varies widely by age, sex, and height, we calculated systolic and diastolic BP z-scores from mixed-effects linear regres-sion models derived using data from 1999–2000 CDC NHANES. We input sex, age, and height z-scores de-rived from CDC norms to compute expected SBP and DBP [28]. BP z-scores were then calculated from the measured BP using the formula z= (x−μ)/σ, where x is the measured BP,μis the 50thpercentile BP, andσis de-rived from the same NHANES data [29]. We categorized BP outcomes as present or absent prehypertension (BP
≥90th percentile for age/heightz-score/sex).
Age, Sex, race/ethnicity, caregiver’s level of education and income were assessed using a questionnaire. Race/ ethnicity was categorized into Mexican American, other Hispanic, Non- Hispanic white, non-Hispanic black, and other, based on self-report by 17- to 19- year-olds and caregiver report in 12–16-year-olds. Poverty to income ratio (PIR), calculated by dividing family income by the federal poverty level for family size, was categorized into quartiles. Pregnancy status was assessed through ques-tionnaire and urine pregnancy status; pregnant partici-pants were excluded from our study.
Other measures came from laboratory assessments. In-sulin resistance was included in the analyses, as studies
have shown insulin resistance to be associated with hypertension and higher UA in children [30]. To assess insulin resistance, we calculated homeostatic model as-sessment of insulin resistance (HOMA-IR) by multiply-ing fastmultiply-ing insulin and glucose divided by 22.5. Insulin resistance was analyzed as categorical outcome, using the cut point of 4.39, which is more than 2 SD above the mean HOMA-IR for normal-weight adolescents with normal fasting glucose in NHANES 1999–2002 [31]. Since exposure to tobacco smoke is thought to be a risk factor for kidney disease in adolescents, serum cotinine was also included in the analyses [32]. Cotinine levels were categorized into low (<0.15 ng/mL), medium (≥0.15 ng/mL and >2.0 ng/mL) and high (≥2.0 ng/mL) [33]. Total cholesterol was considered as a potential co-variate as lowering cholesterol has been shown to reduce the rate of kidney function loss [34]. Total cholesterol was categorized into low or high groups using the cut-point of 170 mg/dL, based on published guidelines [35].
To maximize sample size in multivariable analysis, missing categories were created for all potential con-founders except high cholesterol and BMI category (both n = 1). Less than 10 % of values were missing for any confounding variable, except in case of insulin resistance category, which had 51 % of values missing.
Statistical analysis
Univariable, bivariate and appropriately weighted multi-variable analyses were conducted in a fashion that re-flects the complex survey sampling design, using Stata 13.0 (College Station, TX) survey (‘svy’) commands. Bi-variate analyses were performed for the sum of all 12 PFAAs to explore potential confounding in PFAA-outcome relationships.
Substantial (>40 %) non-detectable concentrations were identified for 8 of the 12 PFAA. Given the substan-tial frequency of non-detectable concentrations for the other PFAAs, our analyses focused on PFOA, PFOS, PFHxS and PFNA in the population with available eGFR data. Outcome variables eGFR and UA were analyzed as continuous variables for multivariable analyses. To fur-ther confirm the findings, eGFR and UA were catego-rized into quartile for ordered logistic regression, which is used to predict the odds of categorical severity of the abnormality based on the values of the predictor variables.
Multivariable linear regressions were performed to examine the association between increasing PFAA quar-tiles and differences in eGFR and UA, adjusting for race/ ethnicity, sex, poverty-income ratio, caregiver education, serum cotinine, prehypertension, insulin resistance, BMI, and hypercholesterolemia categories.
UA measurement method. Finally, given that PFAAs are potential endocrine disruptors [36], we also conducted sex-stratified analyses to assess potential interactions. Because hypercholesterolemia may be an intermediate factor in the causal pathway between PFAAs exposure and renal dysfunction, sensitivity analyses also reprised models without adjustment for cholesterol. Sensitivity analyses also examined addition of continuous age, and substitution of BMI Z-score for categorical body mass. Change of regression coefficients by >10 % or attenu-ation statistical significance was used in these sensitivity analyses as criteria for suggesting modification of effects. Finally, we identified in our statistical analyses that PFAA concentrations are strongly correlated with each other. Upon identifying associations of PFOS and PFOA with primary outcomes, in an effort to delineate which of the two were driving effects on renal function, we per-formed multivariable regressions that simultaneously ex-amined PFOS and PFOA.
Results
During the study period, 7,168 children and adolescents participated. There were 1961 non-pregnant participants for whom serum perfluoroalkyl concentrations were available. We excluded one participant who had eGFR <60 mL/min/1.73 m2, resulting in 1960 participants, with 54.3 % male (Table 1). Mean Cr, eGFR and UA were 0.74 ± 0.17 mg/dL, 144.0 ± 27.6 mL/min/1.73 m2 and 5.07 ± 1.19 mg/dL, respectively.
Univariate analyses of renal outcomes against quartiled PFAAs revealed substantial differences among those more highly exposed, with strongest associations for PFOS. Compared with the lowest PFOS levels, all three higher quartiles had lower eGFR with 6.31 (95 % CI:−11.1 to
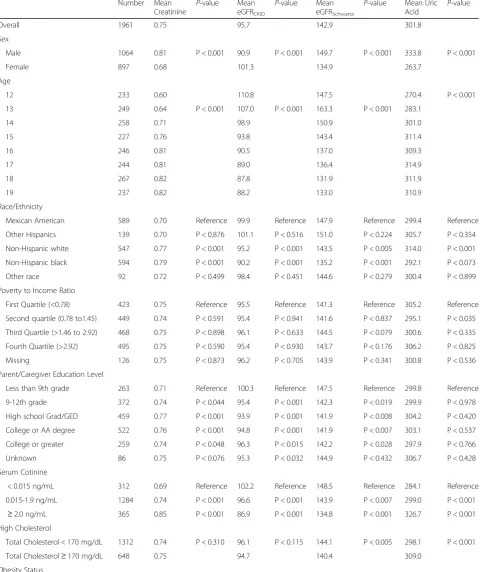
−1.49), 6.56 (95 % CI:−12.0 to−1.06) and 9.76 (95 % CI:−15.1 to−4.44) mL/min/1.73 m2 decrements. Adoles-cents with the highest PFOA concentrations had 4.37 mL/ min/1.73 m2lower eGFR (95 % CI:−9.15 to 0.40). No sig-nificant associations with PFHxS or PFNA were identified. Bivariate analyses revealed substantial differences in PFAAs, eGFR and uric acid by social, behavioral and other characteristics (Appendix Tables 3 and 4), supporting po-tential confounding and inclusion of covariates in multi-variable models. Non-Hispanic white and non-Hispanic black participants had significantly higher mean creatinine and lower eGFR. Obesity was associated with significantly lower creatinine, higher eGFR and higher uric acid levels. Insulin resistance was also associated with lower creatin-ine, higher eGFR and higher uric acid levels. High levels of cotinine (>2 ng/mL) were associated with significantly in-creased creatinine and uric acid and dein-creased eGFR. Pre-hypertension and high total cholesterol were found to be associated with significantly increased uric acid level but not with creatinine and eGFR. Participants with caregivers
who had 9–12th grade education, high school/graduate equivalency diploma or college/Associate’s degree had sig-nificantly higher creatinine and lower eGFR than those with less than 9thgrade or college and greater education.
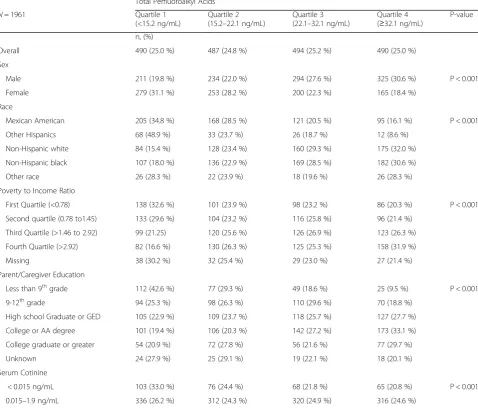
Bivariate analyses of PFAAs revealed males to have higher total PFAA than female. Non-Hispanic whites and non-Hispanic blacks had total PFAA levels in the 4th quar-tile more frequently than other race/ethnicities. Highest
Table 1Adolescents with serum perfluoroalkyl acid measurements, NHANES 2003-2010
N= 1960
Characteristics Result
Sex, n (%)
Male 1064 (54.3 %)
Female 896 (45.7 %)
Mean Age ± SD 15.5 ± 2.3
Race, n (%)
Mexican American 589 (30 %)
Other Hispanics 139 (7.1 %)
Non-Hispanic white 546 (27.9 %)
Non-Hispanic black 594 (30.3 %)
Other race 92 (4.7 %)
Poverty to income ratio, n (%)
First Quartile (<0.78) 423 (21.6 %)
Second quartile (0.78 to1.45) 449 (22.9 %)
Third Quartile (1.46 to 2.92) 467 (23.8 %)
Fourth Quartile (>2.92) 495 (25.3 %)
Missing 126 (6.4 %)
Parent/Caregiver Education Level, n (%)
Less than 9th grade 262 (13.4 %)
9-12th grade 372 (19.0 %)
High school Grad/GED 459 (23.4 %)
College or AA degree 522 (26.6 %)
College or greater 259 (13.2 %)
Unknown 86 (4.4 %)
Serum Cotinine, n (%)
< 0.015 ng/mL 312 (15.9 %)
0.015–1.9 ng/mL 1284 (65.5 %)
At least 2.0 ng/mL 364 (18.6 %)
High Cholesterol, n (%) 647 (33.1 %)
Obese, n (%) 429 (21.9 %)
Insulin resistant 195 (20.3 %)
BP >90th percentile 151 (7.93 %)
Median Creatinine, mg/dL (IQR) 0.72 (0.62, 0.86)
Median eGFR, min/mL/1.73 m2(IQR) 140.4 (125.1, 158.8)
Mean Uric Acid, mg/dL (IQR) 5.0 (4.2, 5.8)
total PFAA quartile was also correlated with increasing quartiles of cotinine levels, worsening poverty-income ra-tio and higher educara-tion level of parent/caregivers. On the other hand, obesity and insulin resistance were associated with lower total PFAA quartiles. Age, high total choles-terol and prehypertension did not have significant associa-tions with total PFAA levels.
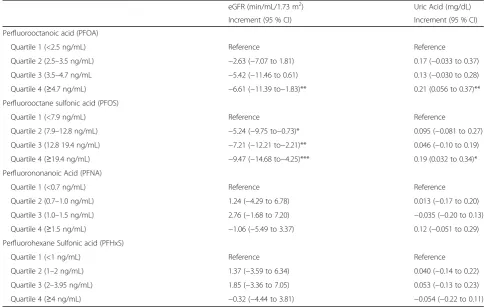
Upon control for potential confounders, multivariable linear regression revealed adolescents in the highest quartile of PFOA to have 6.61 mL/min/1.73 m2 lower eGFR than adolescents in the lowest quartile (95 % CI: -11.39 to−1.83, Table 2). Similarly, when examining the relationship between PFOS and eGFR, the multivariable regression revealed a negative correlation such that all higher quartiles of PFOS are associated with a statisti-cally significant decrease in eGFR quartile, compared to the lowest quartile. Most notably, quartile 4 of PFOS was associated with a 9.47 mL/min/1.73 m2lower eGFR (95 % CI:−14.68 to−4.25). Results for eGFR and UA were non-significant for PFHxS and PFNA.
The highest PFOA and PFOS quartile were also asso-ciated with a 0.21 mg/dL (p = 0.009) and 0.19 mg/dL (p = 0.019) increase in UA levels compared with lowest
quartile, respectively (Table 2). Multivariable analyses failed to show any significant associations of PFHxS and PFNA with any of the outcome variables.
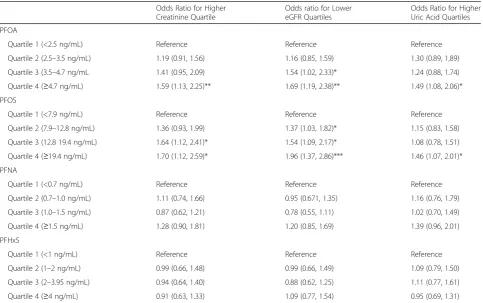
Ordered logistic regression revealed that increasing PFOS quartiles were associated with significant decrease in eGFR, with adolescents in highest PFOS quartile hav-ing a 1.96-fold higher risk of havhav-ing eGFR in the lower quartiles (95 % CI: 1.37, 2.86; p < 0.001). Adolescents in the highest PFOA and PFOS quartiles had significantly increased risk of having UA in higher quartiles, com-pared to those in the lower PFOA/PFOS quartiles (Ap-pendix Table 6).
Sex-stratified regression models did not alter associa-tions of PFAA with eGFR or UA measures, and addition of NHANES two-year wave covariate failed to change re-gression coefficients by >10 % or attenuate statistical sig-nificance. Sensitivity analyses also reprised models without adjustment for cholesterol (Appendix Table 5), and failed to find a change in regression coefficients by >10 % or at-tenuate statistical significance. Sensitivity analyses failed to find significant alteration of associations resulting from addition of continuous age, or substitution of BMI Z-score for categorical body mass.
Table 2Multivariable regression of perfluoroalkyl acids with outcome measure of kidney function
eGFR (min/mL/1.73 m2) Uric Acid (mg/dL)
Increment (95 % CI) Increment (95 % CI)
Perfluorooctanoic acid (PFOA)
Quartile 1 (<2.5 ng/mL) Reference Reference
Quartile 2 (2.5–3.5 ng/mL) −2.63 (−7.07 to 1.81) 0.17 (−0.033 to 0.37)
Quartile 3 (3.5–4.7 ng/mL −5.42 (−11.46 to 0.61) 0.13 (−0.030 to 0.28)
Quartile 4 (≥4.7 ng/mL) −6.61 (−11.39 to−1.83)** 0.21 (0.056 to 0.37)**
Perfluorooctane sulfonic acid (PFOS)
Quartile 1 (<7.9 ng/mL) Reference Reference
Quartile 2 (7.9–12.8 ng/mL) −5.24 (−9.75 to−0.73)* 0.095 (−0.081 to 0.27)
Quartile 3 (12.8 19.4 ng/mL) −7.21 (−12.21 to−2.21)** 0.046 (−0.10 to 0.19)
Quartile 4 (≥19.4 ng/mL) −9.47 (−14.68 to−4.25)*** 0.19 (0.032 to 0.34)*
Perfluorononanoic Acid (PFNA)
Quartile 1 (<0.7 ng/mL) Reference Reference
Quartile 2 (0.7–1.0 ng/mL) 1.24 (−4.29 to 6.78) 0.013 (−0.17 to 0.20)
Quartile 3 (1.0–1.5 ng/mL) 2.76 (−1.68 to 7.20) −0.035 (−0.20 to 0.13)
Quartile 4 (≥1.5 ng/mL) −1.06 (−5.49 to 3.37) 0.12 (−0.051 to 0.29)
Perfluorohexane Sulfonic acid (PFHxS)
Quartile 1 (<1 ng/mL) Reference Reference
Quartile 2 (1–2 ng/mL) 1.37 (−3.59 to 6.34) 0.040 (−0.14 to 0.22)
Quartile 3 (2–3.95 ng/mL) 1.85 (−3.36 to 7.05) 0.053 (−0.13 to 0.23)
Quartile 4 (≥4 ng/mL) −0.32 (−4.44 to 3.81) −0.054 (−0.22 to 0.11)
All models adjust for Sex, poverty-income ratio, caregiver education, serum cotinine, prehypertension, insulin resistance, Body Mass Index, hypercholesterolemia and race/ethnicity categories
Conversion factors for units: serum creatinine in mg/dL toμmol/L, ×88.4; serum uric acid in mg/dL toμmol/L, x59.48 eGFRestimated glomerular filtration rate
Finally, PFOA was substantially correlated with PFOS (r = 0.60). Simultaneous examination of PFOA and PFOS revealed significant decrements in eGFR and increases in uric acid in association with PFOA but not PFOS. Compared with the lowest quartile, adolescents with higher levels of PFOA had 3.90 (95 % CI:−8.04 to 0.24), 5.84 (95 % CI:−11.56 to−0.12) and 5.77 (95 % CI:−11.01 to 0.54) mL/min/1.73 m2 lower eGFR. Compared with the lowest quartile, adolescents with higher levels of PFOA had 0.20 (95 % CI: 0.02 to 0.39), 0.15 (95 % CI:−0.006 to 0.32) and 0.23 (95 % CI: 0.02 to 0.43) mg/ dL higher uric acid.
Discussion
In a representative sample of 1960 US adolescents, we found higher concentrations of PFOA and PFOS, but not PFHxS or PFNA in serum to be associated with a decre-ments in eGFR and increases in UA, independent of nu-merous confounders including demographic features, other environmental exposures and lifestyle variables. All the stat-istical analyses, including evaluating exposures as categor-ical variables by quartiles and ordered logistic regression, indicate that graded exposure to these chemicals is associ-ated with reductions in eGFR and UA. These results are consistent with previous cross-sectional studies, including a community-based study of adolescents exposed to PFOA-contaminated water, and cross-sectional study of adult NHANES participants [9–11, 13]. The smaller decrement in eGFR (<1 mL/min/1.73 m2) in a much more highly ex-posed sample compared with our estimates (7−10 mL/min/ 1.73 m2) suggests the possibility of steeper dose-response relationship in the lower ranges of exposure, which has also been identified for lead [37], PFAAs [38] and other environ-mental chemicals though we cannot exclude residual con-founding. A steeper dose-response curve at lower exposure ranges for various endpoints has also been found for PFAAs (including PFOA and PFOS) for several endpoints including liver enzymes, cholesterol, and UA [12, 39, 40]. In addition, the relationship between PFAA exposure and eGFR may be more apparent in adolescents with normal kidney function compared to adults who may have subclin-ical renal disease.
Evidence from animal studies suggests the association between PFAAs and renal function is biologically plaus-ible. The finding of renal hypertrophy and histopatho-logical alterations indicate that cell proliferation and injury occur in rats exposed to PFOA and PFOS, likely induced by reactive oxidative species [4, 41]. These rat models exhibited generally higher concentrations of PFOS in all organs compared to PFOA, likely due to slower elimination of PFOS. This may explain the rela-tively stronger associations with PFOS observed in our study [41]. One preclinical study has suggested that early
life exposure to PFAA could produce elevated blood pressure [42].
Increases in serum UA concentration could potentially be part of the causal pathway between PFAAs and eGFR given that it is a potent pro-oxidant in the intracellular environment and induces oxidative stress and endothe-lial dysfunction. The net effect of high UA levels may be development of hypertension, interstitial fibrosis, glo-merulosclerosis and eventual kidney failure [43]. The mechanisms underlying the association between hyper-uricemia and PFAAs are not clear. PFAAs may compete with anion transporters that are normally responsible for UA secretion, ultimately resulting in decreased UA ex-cretion [44]. Alternatively, since UA is renally cleared, higher UA levels could also be the consequence of de-creased kidney function due to PFAA exposure. Further mechanistic studies are needed to clarify the biological association between UA and PFAAs.
While all our participants had normal renal function, the 7−10 mL/min/1.73 m2 decrease in eGFR observed with higher levels of the compounds is not insignificant. Moreover, studies of essential hypertension in children have shown that for each 1 mg/dl change in UA, there is an associated average increase of 14 mmHg in systolic blood pressure and 7 mmHg in diastolic blood pressure [16]. Slight increases in serum uric acid concentration within the normal range, comparable to changes noted in our study, have been associated with a larger decline in GFR and a higher incidence of CKD over a 2-year period in a community-based adult Japanese cohort [45]. The increase in UA that we documented in association with PFAA exposure may lead to a change in blood pressure that may be important on a population level. Given the prolonged half-life of these chemicals, levels of PFAAs in these adolescents are likely to persist into adulthood, and so the impact of these compounds on renal function is likely magnified as the chemicals in-duce oxidant stress over an extended period of time. As these children age, their renal functional reserve dimin-ishes, and so in the context of exposure to other poten-tial environmental toxins or conditions, the rate of their kidney dysfunction may be accelerated, increasing the risk of CKD.
increase in PFAA? While this is a possibility, the present evidence cannot provide definitive proof that it does. In-deed, the serum concentration of most molecules that are cleared by the kidney does not begin to rise until the GFR falls below 60–90 ml/min/1.73 m2.
In one recent large, community based study of residents living near a production facility exposed to contaminated water, serum PFAA levels were inversely correlated with eGFR in otherwise healthy children and adolescents [9]. The authors of this paper argue that curve attenuation may indicate reverse causation. However, curve attenu-ation at higher dose has characterized the findings of many known outcome relationships with toxins (or drugs) that interact with nuclear receptors [47], and could ex-plain the differential findings between the NHANES population and the population living near a production fa-cility. PFOS concentrations are affected by human entero-hepatic factors [48, 49], yet Watkins et al found PFOS to be strongly associated with eGFR.
Han et al note that organic anion transporters in the proximal tubule cells result in the secretion and then re-absorption of these compounds [50]. Some use these data together with null findings about antecedent PFAA expos-ure described by Watkins et al [9] to postulate that the site of renal dysfunction is tubular rather than glomerular. We have made no a priori assumption on the primary site of injury within the kidney. Based on what is known about the ability of PFAAs to induce oxidant stress, both glom-eruli and tubules are equally plausible as targets of PFAA-induced renal injury and both would result in a decline in GFR. We could not study tubular function in the NHANES sample, and believe that an optimal study would longitudinally measure both glomerular and tubu-lar function, potentially adjusting for the latter. The Wat-kins study did not adjust for tubular function.
Watkins et al describes a highly exposed sample (me-dian PFOA fourfold higher than the lower margin of the highest quartile in our sample) in which antecedent expo-sures were modeled from resident address and water mea-surements, with modest predictive value in children (62 %) [9]. Biomarker data were not available prior to measured renal function. While some might argue that the Watkins et al study proves reverse causation, a single study cannot result in such a conclusion, just as forward causation cannot be determined from a single study. Al-though our study results are incremental in that they chiefly confirm and amplify previous findings, they sup-port the need for better longitudinal study with serially collected biomarker data.
There are a few other limitations to the study includ-ing the cross-sectional nature of this study, which pre-vents us from inferring causality. Other limitations include lack of data on potential confounders such as diet, family history of kidney disease and Tanner staging,
as PFAAs are known to have estrogenic activity [36, 51]. We were also unable to control for other environmental chemicals which are oxidant stressors and have been as-sociated with albuminuria and cardiorenal risks [52–54]. We could not ascertain the degree to which the PFAAs were albumin bound as opposed to freely circulating, which may vary among individuals and contribute to the interindividual differences in renal function associated with PFAAs in this study [55]. While increased binding might mitigate the nephrotoxic effects of PFAAs, re-duced protein binding might result in greater uptake by renal cells and exacerbate injury.
We also note that the Schwartz formula is but one measure of glomerular function. We also could not exam-ine the albumin-to-creatinexam-ine ratio, because in children, only first morning voids yield valid measurements, and these were only available in NHANES 2009–10. Measure-ments of Cystatin C have led to development of alternate formulas, and as have other formulas using beta-trace pro-tein [56]. Beyond glomerular function, tubular function could not be assessed in our study.
Our study suggests perfluoroalkyl chemicals present as modifiable risk factors for kidney dysfunction that could be eliminated with a voluntary phase out of the four PFAAs that remains on target to complete a phase-out by 2015 [57]. Given their persistence in the environ-ment, continued formation from precursor compounds, and the potential for continued production by non-participating manufacturers in the U.S. and/or overseas, environmental contamination and human exposure with the potential for health impacts from these PFAAs is ex-pected to continue even after they are phased out, as seen in the case of PFOS. Furthermore, numerous PFAAs continue to be used. A Swedish study of PFAA trends between 1996–2010 confirmed increases in PFHxS (4.3 %/year), but also noted 11 % increases/year of a four-carbon PFAA, perfluoroalkylbutane sulfonate (PFBS), a substitute for PFOS increasingly found in food. [58] These findings suggest that the adverse effects of PFAAs on kidney function in children and adolescents will continue to represent a potential health problem in the coming years. Longitudinal research is therefore highly relevant, both to clarify the observed associations of eGFR and UA with PFAAs, and ongoing efforts to re-duce long-term health effects of PFAA exposure.
Conclusions
Appendix
Table 3Mean creatinine, eGFR and uric acid, by sample characteristics
Number Mean
Creatinine
P-value Mean eGFRCKiD
P-value Mean eGFRSchwartz
P-value Mean Uric Acid
P-value
Overall 1961 0.75 95.7 142.9 301.8
Sex
Male 1064 0.81 P < 0.001 90.9 P < 0.001 149.7 P < 0.001 333.8 P < 0.001
Female 897 0.68 101.3 134.9 263.7
Age
12 233 0.60 110.8 147.5 270.4 P < 0.001
13 249 0.64 P < 0.001 107.0 P < 0.001 163.3 P < 0.001 283.1
14 258 0.71 98.9 150.9 301.0
15 227 0.76 93.8 143.4 311.4
16 246 0.81 90.5 137.0 309.3
17 244 0.81 89.0 136.4 314.9
18 267 0.82 87.8 131.9 311.9
19 237 0.82 88.2 133.0 310.9
Race/Ethnicity
Mexican American 589 0.70 Reference 99.9 Reference 147.9 Reference 299.4 Reference
Other Hispanics 139 0.70 P < 0.876 101.1 P < 0.516 151.0 P < 0.224 305.7 P < 0.354
Non-Hispanic white 547 0.77 P < 0.001 95.2 P < 0.001 143.5 P < 0.005 314.0 P < 0.001
Non-Hispanic black 594 0.79 P < 0.001 90.2 P < 0.001 135.2 P < 0.001 292.1 P < 0.073
Other race 92 0.72 P < 0.499 98.4 P < 0.451 144.6 P < 0.279 300.4 P < 0.899
Poverty to Income Ratio
First Quartile (<0.78) 423 0.75 Reference 95.5 Reference 141.3 Reference 305.2 Reference
Second quartile (0.78 to1.45) 449 0.74 P < 0.591 95.4 P < 0.941 141.6 P < 0.837 295.1 P < 0.035
Third Quartile (>1.46 to 2.92) 468 0.75 P < 0.898 96.1 P < 0.633 144.5 P < 0.079 300.6 P < 0.335
Fourth Quartile (>2.92) 495 0.75 P < 0.590 95.4 P < 0.930 143.7 P < 0.176 306.2 P < 0.825
Missing 126 0.75 P < 0.873 96.2 P < 0.705 143.9 P < 0.341 300.8 P < 0.536
Parent/Caregiver Education Level
Less than 9th grade 263 0.71 Reference 100.3 Reference 147.5 Reference 299.8 Reference
9-12th grade 372 0.74 P < 0.044 95.4 P < 0.001 142.3 P < 0.019 299.9 P < 0.978
High school Grad/GED 459 0.77 P < 0.001 93.9 P < 0.001 141.9 P < 0.008 304.2 P < 0.420
College or AA degree 522 0.76 P < 0.001 94.8 P < 0.001 141.9 P < 0.007 303.1 P < 0.537
College or greater 259 0.74 P < 0.048 96.3 P < 0.015 142.2 P < 0.028 297.9 P < 0.766
Unknown 86 0.75 P < 0.076 95.3 P < 0.032 144.9 P < 0.432 306.7 P < 0.428
Serum Cotinine
< 0.015 ng/mL 312 0.69 Reference 102.2 Reference 148.5 Reference 284.1 Reference
0.015-1.9 ng/mL 1284 0.74 P < 0.001 96.6 P < 0.001 143.9 P < 0.007 299.0 P < 0.001
≥2.0 ng/mL 365 0.85 P < 0.001 86.9 P < 0.001 134.8 P < 0.001 326.7 P < 0.001
High Cholesterol
Total Cholesterol < 170 mg/dL 1312 0.74 P < 0.310 96.1 P < 0.115 144.1 P < 0.005 298.1 P < 0.001
Total Cholesterol≥170 mg/dL 648 0.75 94.7 140.4 309.0
Table 3Mean creatinine, eGFR and uric acid, by sample characteristics(Continued)
Not Obese 1531 0.75 P < 0.016 94.8 P < 0.001 141.6 P < 0.001 290.9 P < 0.00
Obese 429 0.73 98.7 147.4 340.3
Insulin Status
HOMA-IR <4.39 767 0.76 P < 0.009 95.2 P < 0.001 142.4 P < 0.001 295.4 P < 0.001
HOMA-IR≥4.39 195 0.71 101.1 150.3 337.4
Blood Pressure Status
Blood Pressure <90th Percentile 1752 0.75 P < 0.503 95.4 P < 0.353 142.5 P < 0.272 300.2 P < 0.006
Blood Pressure≥90th Percentile 151 0.74 96.9 145.0 316.5
Table 4Bivariate analysis of total serum of perfluoroalkyl acids by demographics, anthropometric and clinical characteristics
Total Perfluoroalkyl Acids
N= 1961 Quartile 1
(<15.2 ng/mL)
Quartile 2 (15.2–22.1 ng/mL)
Quartile 3 (22.1–32.1 ng/mL)
Quartile 4 (≥32.1 ng/mL)
P-value
n, (%)
Overall 490 (25.0 %) 487 (24.8 %) 494 (25.2 %) 490 (25.0 %)
Sex
Male 211 (19.8 %) 234 (22.0 %) 294 (27.6 %) 325 (30.6 %) P < 0.001
Female 279 (31.1 %) 253 (28.2 %) 200 (22.3 %) 165 (18.4 %)
Race
Mexican American 205 (34.8 %) 168 (28.5 %) 121 (20.5 %) 95 (16.1 %) P < 0.001
Other Hispanics 68 (48.9 %) 33 (23.7 %) 26 (18.7 %) 12 (8.6 %)
Non-Hispanic white 84 (15.4 %) 128 (23.4 %) 160 (29.3 %) 175 (32.0 %)
Non-Hispanic black 107 (18.0 %) 136 (22.9 %) 169 (28.5 %) 182 (30.6 %)
Other race 26 (28.3 %) 22 (23.9 %) 18 (19.6 %) 26 (28.3 %)
Poverty to Income Ratio
First Quartile (<0.78) 138 (32.6 %) 101 (23.9 %) 98 (23.2 %) 86 (20.3 %) P < 0.001
Second quartile (0.78 to1.45) 133 (29.6 %) 104 (23.2 %) 116 (25.8 %) 96 (21.4 %)
Third Quartile (>1.46 to 2.92) 99 (21.25) 120 (25.6 %) 126 (26.9 %) 123 (26.3 %)
Fourth Quartile (>2.92) 82 (16.6 %) 130 (26.3 %) 125 (25.3 %) 158 (31.9 %)
Missing 38 (30.2 %) 32 (25.4 %) 29 (23.0 %) 27 (21.4 %)
Parent/Caregiver Education
Less than 9thgrade 112 (42.6 %) 77 (29.3 %) 49 (18.6 %) 25 (9.5 %) P < 0.001
9-12thgrade 94 (25.3 %) 98 (26.3 %) 110 (29.6 %) 70 (18.8 %)
High school Graduate or GED 105 (22.9 %) 109 (23.7 %) 118 (25.7 %) 127 (27.7 %)
College or AA degree 101 (19.4 %) 106 (20.3 %) 142 (27.2 %) 173 (33.1 %)
College graduate or greater 54 (20.9 %) 72 (27.8 %) 56 (21.6 %) 77 (29.7 %)
Unknown 24 (27.9 %) 25 (29.1 %) 19 (22.1 %) 18 (20.1 %)
Serum Cotinine
< 0.015 ng/mL 103 (33.0 %) 76 (24.4 %) 68 (21.8 %) 65 (20.8 %) P < 0.001
Table 5Multivariable regression of perfluoroalkyl acids with outcome measure of kidney function unadjusted for cholesterol
Creatinine (mg/dL) eGFR (min/mL/1.73 m2) Uric Acid (mg/dL)
Perfluorooctanoic acid (PFOA)
Quartile 1 (<2.5 ng/mL) Reference Reference Reference
Quartile 2 (2.5–3.5 ng/mL) 0.007 (−0.012 to 0.027) −2.81 (−7.16 to 1.53) 0.17 (–0.028 to 0.37)
Quartile 3 (3.5–4.7 ng/mL 0.021 (−0.008 to 0.050) −5.50 (−11.50 to 0.50) 0.13 (−0.030 to 0.29)
Quartile 4 (≥4.7 ng/mL) 0.029 (0.004 to 0.054)* −6.84 (−11.48 to−2.19)** 0.23 (0.071 to 0.39)**
Perfluorooctane sulfonic acid (PFOS)
Quartile 1 (<7.9 ng/mL) Reference Reference Reference
Quartile 2 (7.9–12.8 ng/mL) 0.021 (−0.007 to 0.049) −5.39 (−9.87 to−0.92)* 0.11 (−0.063 to 0.29)
Quartile 3 (12.8 19.4 ng/mL) 0.038 (0.008 to 0.068)* −7.25 (−12.25 to−2.25)** 0.045 (−0.10 to 0.19)
Quartile 4 (≥19.4 ng/mL) 0.040 (0.010 to 0.071)** −9.69 (−14.78 to−4.59)*** 0.20 (0.041 to 0.35)*
Perfluorononanoic Acid (PFNA)
Quartile 1 (<0.7 ng/mL) Reference Reference Reference
Quartile 2 (0.7–1.0 ng/mL) −0.003 (−0.035 to 0.029) 1.25 (−4.30 to 6.80) 0.011 (−0.17 to 0.19)
Quartile 3 (1.0–1.5 ng/mL) −0.018 (−0.046 to 0.009) 2.59 (−1.89 to 7.08) −0.027 (−0.19 to 0.14)
Quartile 4 (≥1.5 ng/mL) 0.0034 (−0.24 to 0.031) −1.2 (−5.62 to 3.22) 0.13 (−0.035 to 0.30)
Perfluorohexane Sulfonic acid (PFHxS)
Quartile 1 (<1 ng/mL) Reference Reference Reference
Quartile 2 (1–2 ng/mL) −0.000 (−0.029 to 0.029) 1.27 (−3.67 to 6.21) 0.053 (−0.12 to 0.23)
Quartile 3 (2–3.95 ng/mL) −0.007 (−0.037 to 0.023) 1.81 (−3.40 to 7.03) 0.052 (−0.13 to 0.23)
Quartile 4 (≥4 ng/mL) −0.008 (−0.036 to 0.020) −0.31 (−4.39 to 3.77) −0.057 (–0.23 to 0.11)
All models adjust for gender, poverty-income ratio, caregiver education, serum cotinine, prehypertension, insulin resistance, Body Mass Index, and race/ethnicity categories
Conversion factors for units: serum creatinine in mg/dL toμmol/L, ×88.4; serum uric acid in mg/dL toμmol/L, x59.48 eGFRestimated glomerular filtration rate
*p< 0.05 **p< 0.01 ***p< 0.001
Table 4Bivariate analysis of total serum of perfluoroalkyl acids by demographics, anthropometric and clinical characteristics (Continued)
≥2.0 ng/mL 51 (14.0 %) 99 (27.1 %) 106 (29 %) 109 (29.9 %)
High Cholesterol
Total Cholesterol < 170 mg/dL 345 (26.3 %) 331 (25.2 %) 327 (24.9 %) 309 (23.6 %) P < 0.097
Total Cholesterol≥170 mg/dL 145 (22.4 %) 156 (24.1 %) 166 (25.6 %) 181 (27.9 %)
Obesity Status
Not Obese 365 (23.8 %) 366 (23.9 %) 399 (20.1 %) 401 (26.25) P < 0.007
Obese 125 (29.1 %) 120 (28 %) 95 (22.1 %) 89 (20.8 %)
Insulin Status
HOMA-IR <4.39 191 (24.9 %) 178 (23.2 %) 208 (27.1 %) 190 (24.8 %) P < 0.001
HOMA-IR≥4.39 70 (35.9 %) 58 (29.7 %) 36 (18.5 %) 31 (15.9 %)
Blood Pressure Status
Blood Pressure <90th Percentile 437 (24.9 %) 433 (24.7 %) 441 (25.2 %) 441 (25.2 %) P < 0.674
Abbreviations
BP:Blood pressure; CDC: Centers for Disease Control and Prevention; CKD: Chronic Kidney Disease; Cr: Creatinine; eGFR: Estimated glomerular filtration rate; NCHS: National Center for Health Statistics; NHANES: National Health and Nutrition Examination Survey; PFAAs: perfluoroalkyl acids; PFHxS: perfluorohexane sulfonate; PFNA: perfluorononanoic acid; PFOS: perfluorooctane sulfonic acid; PFOA: perfluorooctanoic acid; UA: uric acid.
Competing interests
The authors declare that they have no competing interests.
Authors’contributions
LT, AK and HT designed the study, wrote initial drafts of the manuscript, obtained funding and submitted human subjects approvals. LMD participated in data analyses and reviewed manuscript drafts. All authors read and approved the final manuscript.
Acknowledgements
This work was supported in part by R01ES022972 (LT), and RO1DK100307 (LT & HT). In addition, we are grateful to the KIDS of NYU Foundation for support of this work. There are no financial conflicts of interest to report.
Author details
1Department of Pediatrics, New York University School of Medicine, 227 East
30th St, Room 735, New York, NY 10016, USA.2Department of Environmental Medicine, New York University School of Medicine, New York, NY, USA.
3
Department of Population Health, New York University School of Medicine, New York, NY, USA.4New York University Wagner School of Public Service, New York, NY, USA.5Department of Nutrition, Food Studies, and Public Health, New York University Steinhardt School of Culture, Education, and Human Development, New York, NY, USA.6New York University Global Institute of Public Health, New York, NY, USA.
Received: 13 August 2015 Accepted: 18 November 2015
References
1. Buck RC, Franklin J, Berger U, Conder JM, Cousins IT, de Voogt P, et al. Perfluoroalkyl and polyfluoroalkyl substances in the environment: terminology, classification, and origins. Integr Environ Assess Manag. 2011;7(4):513–41.
2. Trudel D, Horowitz L, Wormuth M, Scheringer M, Cousins IT, Hungerbühler K. Estimating Consumer Exposure to PFOS and PFOA. Risk Anal. 2008;28(2):251–69.
3. Calafat AM, Wong L-Y, Kuklenyik Z, Reidy JA, Needham LL. Polyfluoroalkyl chemicals in the US population: data from the National Health and Nutrition Examination Survey (NHANES) 2003–2004 and comparisons with NHANES 1999–2000. Environ Health Perspect. 2007;115(11):1596. 4. Qian Y, Ducatman A, Ward R, Leonard S, Bukowski V, Lan Guo N, et al.
Perfluorooctane sulfonate (PFOS) induces reactive oxygen species (ROS) production in human microvascular endothelial cells: role in endothelial permeability. J Toxicol Environ Health A. 2010;73(12):819–36.
Table 6Ordered logistic regression analysis of kidney function outcome measures against perfluoroalkyl acids
Odds Ratio for Higher Creatinine Quartile
Odds ratio for Lower eGFR Quartiles
Odds Ratio for Higher Uric Acid Quartiles
PFOA
Quartile 1 (<2.5 ng/mL) Reference Reference Reference
Quartile 2 (2.5–3.5 ng/mL) 1.19 (0.91, 1.56) 1.16 (0.85, 1.59) 1.30 (0.89, 1,89)
Quartile 3 (3.5–4.7 ng/mL 1.41 (0.95, 2.09) 1.54 (1.02, 2.33)* 1.24 (0.88, 1.74)
Quartile 4 (≥4.7 ng/mL) 1.59 (1.13, 2.25)** 1.69 (1.19, 2.38)** 1.49 (1.08, 2.06)*
PFOS
Quartile 1 (<7.9 ng/mL) Reference Reference Reference
Quartile 2 (7.9–12.8 ng/mL) 1.36 (0.93, 1.99) 1.37 (1.03, 1.82)* 1.15 (0.83, 1.58)
Quartile 3 (12.8 19.4 ng/mL) 1.64 (1.12, 2.41)* 1.54 (1.09, 2.17)* 1.08 (0.78, 1.51)
Quartile 4 (≥19.4 ng/mL) 1.70 (1.12, 2.59)* 1.96 (1.37, 2.86)*** 1.46 (1.07, 2.01)*
PFNA
Quartile 1 (<0.7 ng/mL) Reference Reference Reference
Quartile 2 (0.7–1.0 ng/mL) 1.11 (0.74, 1.66) 0.95 (0.671, 1.35) 1.16 (0.76, 1.79)
Quartile 3 (1.0–1.5 ng/mL) 0.87 (0.62, 1.21) 0.78 (0.55, 1.11) 1.02 (0.70, 1.49)
Quartile 4 (≥1.5 ng/mL) 1.28 (0.90, 1.81) 1.20 (0.85, 1.69) 1.39 (0.96, 2.01)
PFHxS
Quartile 1 (<1 ng/mL) Reference Reference Reference
Quartile 2 (1–2 ng/mL) 0.99 (0.66, 1.48) 0.99 (0.66, 1.49) 1.09 (0.79, 1.50)
Quartile 3 (2–3.95 ng/mL) 0.94 (0.64, 1.40) 0.88 (0.62, 1.25) 1.11 (0.77, 1.61)
Quartile 4 (≥4 ng/mL) 0.91 (0.63, 1.33) 1.09 (0.77, 1.54) 0.95 (0.69, 1.31)
All models control for Sex, poverty-income ratio, caregiver education, serum cotinine, prehypertension, insulin resistance, Body Mass Index, hypercholesterolemia and race/ethnicity categories. These ordered logistic regressions estimate one equation over all levels of the outcome variable and the coefficients shown per quartile of exposure represent the odds of being in the higher versus the lower quartiles of the outcome variable (or in the lower versus the higher quartiles in the case of eGFR)
PFOAperfluorononanoic acid,PFOSperfluorooctane sulfonic acid,PFNAperfluorononanoic acid,PFHxSperfluorohexane sulfonic acid,eGFRestimated glomerular filtration rate
5. Sutton TA, Mang HE, Campos SB, Sandoval RM, Yoder MC, Molitoris BA. Injury of the renal microvascular endothelium alters barrier function after ischemia. Am J Physiol Renal Physiol. 2003;285(2):F191–8.
6. Lau C, Anitole K, Hodes C, Lai D, Pfahles-Hutchens A, Seed J. Perfluoroalkyl acids: a review of monitoring and toxicological findings. Toxicol Sci. 2007;99(2):366–94.
7. Hoek G, Meliefste K, Cyrys J, Lewne M, Bellander T, Brauer M, et al. Spatial variability of fine particle concentrations in three European areas. Atmospheric Env. 2002;36:4077–88.
8. Post GB, Cohn PD, Cooper KR. Perfluorooctanoic acid (PFOA), an emerging drinking water contaminant: a critical review of recent literature. Environ Res. 2012;116:93–117.
9. Watkins DJ, Josson J, Elston B, Bartell SM, Shin HM, Vieira VM, et al. Exposure to perfluoroalkyl acids and markers of kidney function among children and adolescents living near a chemical plant. Environ Health Perspect. 2013;121(5):625–30.
10. Shankar A, Xiao J, Ducatman A. Perfluoroalkyl chemicals and chronic kidney disease in US adults. Am J Epidemiol. 2011;174(8):893–900.
11. Geiger SD, Xiao J, Shankar A. Positive Association Between Perfluoroalkyl Chemicals and Hyperuricemia in Children. Am J Epidemiol. 2013;177(11):1255–62. 12. Steenland K, Tinker S, Shankar A, Ducatman A. Association of
perfluorooctanoic acid (PFOA) and perfluorooctane sulfonate (PFOS) with uric acid among adults with elevated community exposure to PFOA. Environ Health Perspect. 2010;118(2):229–33.
13. Gleason JA, Post GB, Fagliano JA. Associations of perfluorinated chemical serum concentrations and biomarkers of liver function and uric acid in the US population (NHANES), 2007-2010. Environ Res. 2015;136:8–14. 14. Lin CY, Lin LY, Wen TW, Lien GW, Chien KL, Hsu SH, et al. Association between
levels of serum perfluorooctane sulfate and carotid artery intima-media thickness in adolescents and young adults. Int J Cardiol. 2013;168(4):3309–16. 15. Alper Jr AB, Chen W, Yau L, Srinivasan SR, Berenson GS, Hamm LL.
Childhood uric acid predicts adult blood pressure: the Bogalusa Heart Study. Hypertension. 2005;45(1):34–8.
16. Feig DI, Johnson RJ. Hyperuricemia in childhood primary hypertension. Hypertension. 2003;42(3):247–52.
17. Sundstrom J, Sullivan L, D'Agostino RB, Levy D, Kannel WB, Vasan RS. Relations of serum uric acid to longitudinal blood pressure tracking and hypertension incidence. Hypertension. 2005;45(1):28–33.
18. Forman JP, Choi H, Curhan GC. Plasma uric acid level and risk for incident hypertension among men. J Am Soc Nephrol. 2007;18(1):287–92. 19. Warady BA, Abraham AG, Schwartz GJ, Wong CS, Munoz A, Betoko A, et al.
Predictors of Rapid Progression of Glomerular and Nonglomerular Kidney Disease in Children and Adolescents: The Chronic Kidney Disease in Children (CKiD) Cohort. Am J Kidney Dis. 2015;65(6):878–88. 20. Kuklenyik Z, Reich JA, Tully JS, Needham LL, Calafat AM. Automated
solid-phase extraction and measurement of perfluorinated organic acids and amides in human serum and milk. Environ Sci Technol. 2004;38(13):3698–704. 21. National Center for Health Statistics. Laboratory Procedure Manual:
Creatinine in Refrigerated Serum: 2003-2004. [ Available at http://www.cdc. gov/nchs/data/nhanes/nhanes_03_04/l40_c_met_creatinine.pdf
(Accessed 12 August 2014)].
22. National Center for Health Statistics. Laboratory Procedure Manual: Creatinine in Refrigerated Serum: 2007-2008. [ Available at http://wwwn.cdc. gov/Nchs/Nhanes/2007-2008/BIOPRO_E.htm (Accessed 12 August 2014)]. 23. National Center for Health Statistics. Laboratory Procedure Manual:
Creatinine in Refrigerated Serum: 2005-2006 [ Available at http://www.cdc. gov/nchs/data/nhanes/nhanes_05_06/biopro_d_met_creatinine.pdf (Accessed 12 August 2014)]
24. Selvin E, Manzi J, Stevens LA, Van Lente F, Lacher DA, Levey AS, et al. Calibration of serum creatinine in the National Health and Nutrition Examination Surveys (NHANES) 1988-1994, 1999-2004. Am J Kidney Dis. 2007;50(6):918–26.
25. Schwartz GJ, Brion LP, Spitzer A. The use of plasma creatinine concentration for estimating glomerular filtration rate in infants, children, and adolescents. Pediatr Clin North Am. 1987;34(3):571–90.
26. National Center for Health Statistics. CDC Laboratory Procedure Manual: Uric Acid in Refrigerated Serum 2003-2004. [Available at http://www.cdc.gov/ nchs/data/nhanes/nhanes_03_04/l40_c_met_uric_acid.pdf (Accessed 12 August 2014)]
27. National Center for Health Statistics. CDC Laboratory Procedure Manual: Uric Acid in Refrigerated Serum 2009-2010 [ Available at http://www.cdc.gov/
NCHS/data/nhanes/nhanes_09_10/BIOPRO_F_met_uric%20acid.pdf (Accessed 12 August 2014)]
28. Ogden CL, Kuczmarski RJ, Flegal KM, Mei Z, Guo S, Wei R, et al. Centers for Disease Control and Prevention 2000 growth charts for the United States: improvements to the 1977 National Center for Health Statistics version. Pediatrics. 2002;109(1):45–60.
29. National High Blood Pressure Education Program Working Group on High Blood Pressure in Children and Adolescents. The fourth report on the diagnosis, evaluation, and treatment of high blood pressure in children and adolescents. Pediatrics. 2004;114(2 Suppl 4th Report):555–76.
30. Viazzi F, Antolini L, Giussani M, Brambilla P, Galbiati S, Mastriani S, et al. Serum uric acid and blood pressure in children at cardiovascular risk. Pediatrics. 2013;132(1):e93–99.
31. Lee JM, Okumura MJ, Davis MM, Herman WH, Gurney JG. Prevalence and determinants of insulin resistance among US adolescents a population-based study. Diabetes Care. 2006;29(11):2427–32.
32. García-Esquinas E, Loeffler LF, Weaver VM, Fadrowski JJ, Navas-Acien A. Kidney Function and Tobacco Smoke Exposure in US Adolescents. Pediatrics. 2013;131(5):e1415–23.
33. Wilson K, Finkelstein J, Blumkin A, Best D, Klein J. Micronutrient levels in children exposed to secondhand tobacco smoke. Nicotine Tob Res. 2011;13(9):800–8.
34. Tonelli M, Isles C, Craven T, Tonkin A, Pfeffer MA, Shepherd J, et al. Effect of Pravastatin on Rate of Kidney Function Loss in People With or at Risk for Coronary Disease. Circulation. 2005;112(2):171–8.
35. American Academy of Pediatrics. National Cholesterol Education Program: report of the expert panel on blood cholesterol levels in children and adolescents. Pediatrics. 1992;89(3):525–7.
36. White SS, Fenton SE, Hines EP. Endocrine disrupting properties of perfluorooctanoic acid. J Steroid Biochem Mol Biol. 2011;127(1-2):16–26. 37. Lanphear BP, Hornung R, Khoury J, Yolton K, Baghurst P, Bellinger DC, et al.
Low-Level Environmental Lead Exposure and Children’s Intellectual Function: An International Pooled Analysis. Environ Health Perspect. 2005;113(7):894–9. 38. Maisonet M, Näyhä S, Lawlor DA, Marcus M. Prenatal exposures to
perfluoroalkyl acids and serum lipids at ages 7 and 15 in females. Environ Int. 2015;82:49–60.
39. Steenland K, Fletcher T, Savitz DA. Epidemiologic evidence on the health effects of perfluorooctanoic acid (PFOA). Environ Health Perspect. 2010;118(8):1100–8.
40. Gallo V, Leonardi G, Genser B, Lopez-Espinosa MJ, Frisbee SJ, Karlsson L, et al. Serum perfluorooctanoate (PFOA) and perfluorooctane sulfonate (PFOS) concentrations and liver function biomarkers in a population with elevated PFOA exposure. Environ Health Perspect. 2012;120(5):655–60. 41. Cui L, Zhou Q-F, Liao C-Y, Fu J-J, Jiang G-B. Studies on the toxicological
effects of PFOA and PFOS on rats using histological observation and chemical analysis. Arch Environ Contam Toxicol. 2009;56(2):338–49. 42. Rogers JM, Ellis-Hutchings RG, Grey BE, Zucker RM, Norwood Jr J, Grace CE,
et al. Elevated blood pressure in offspring of rats exposed to diverse chemicals during pregnancy. Toxicol Sci. 2014;137(2):436–46.
43. Sanchez-Lozada LG, Lanaspa MA, Cristobal-Garcia M, Garcia-Arroyo F, Soto V, Cruz-Robles D, et al. Uric acid-induced endothelial dysfunction is associated with mitochondrial alterations and decreased intracellular ATP
concentrations. Nephron Exp Nephrol. 2012;121(3-4):e71–78.
44. Eraly SA, Vallon V, Rieg T, Gangoiti JA, Wikoff WR, Siuzdak G, et al. Multiple organic anion transporters contribute to net renal excretion of uric acid. Physiol Genomics. 2008;33(2):180–92.
45. Kamei K, Konta T, Hirayama A, Suzuki K, Ichikawa K, Fujimoto S, et al. A slight increase within the normal range of serum uric acid and the decline in renal function: associations in a community-based population. Nephrol Dial Transplant. 2014;29(12):2286–92.
46. C8 Science Panel: Probable link evaluation. Available at http://www. c8sciencepanel.org/prob_link.html (Accessed 15 August 2014). 2014. 47. Stayner L, Steenland K, Dosemeci M, Hertz-Picciotto I. Attenuation of
exposure-response curves in occupational cohort studies at high exposure levels. Scand J Work Environ Health. 2003;29(4):317–24.
48. Genuis SJ. Elimination of persistent toxicants from the human body. Hum Exp Toxicol. 2011;30(1):3–18.
49. Genuis SJ, Birkholz D, Ralitsch M, Thibault N. Human detoxification of perfluorinated compounds. Public Health. 2010;124(7):367–75.
51. Benninghoff AD, Bisson WH, Koch DC, Ehresman DJ, Kolluri SK, Williams DE. Estrogen-Like Activity of Perfluoroalkyl Acids In Vivo and Interaction with Human and Rainbow Trout Estrogen Receptors In Vitro. Toxicol Sci. 2011;120(1):42–58.
52. Trasande L, Sathyanarayana S, Trachtman H. Dietary phthalates and low-grade albuminuria in US children and adolescents. Clin J Am Soc Nephrol. 2014;9(1):100–9.
53. Trasande L, Sathyanarayana S, Spanier AJ, Trachtman H, Attina TM, Urbina EM. Urinary phthalates are associated with higher blood pressure in childhood. J Pediatr. 2013;163(3):747–753.e741.
54. Trasande L, Attina TM, Trachtman H. Bisphenol A exposure is associated with low-grade urinary albumin excretion in children of the United States. Kidney Int. 2013;83(4):741–8.
55. Han X, Snow TA, Kemper RA, Jepson GW. Binding of Perfluorooctanoic Acid to Rat and Human Plasma Proteins. Chem Res Toxicol. 2003;16(6):775–81. 56. White CA, Akbari A, Doucette S, Fergusson D, Hussain N, Dinh L, et al.
Estimating GFR using serum beta trace protein: accuracy and validation in kidney transplant and pediatric populations. Kidney Int. 2009;76(7):784–91. 57. Long-Chain Perfluorinated Chemicals (PFCs) [http://www2.epa.gov/
assessing-and-managing-chemicals-under-tsca/long-chain-perfluorinated-chemicals-pfcs]. Accessed 19 November 2015.
58. Glynn A, Berger U, Bignert A, Ullah S, Aune M, Lignell S, et al. Perfluorinated alkyl acids in blood serum from primiparous women in Sweden: serial sampling during pregnancy and nursing, and temporal trends 1996-2010. Environ Sci Technol. 2012;46(16):9071–9.
• We accept pre-submission inquiries
• Our selector tool helps you to find the most relevant journal • We provide round the clock customer support
• Convenient online submission • Thorough peer review
• Inclusion in PubMed and all major indexing services • Maximum visibility for your research
Submit your manuscript at www.biomedcentral.com/submit