R E S E A R C H A R T I C L E
Open Access
Predicting dementia risk in primary care:
development and validation of the
Dementia Risk Score using routinely
collected data
K. Walters
1*, S. Hardoon
1, I. Petersen
1, S. Iliffe
1, R. Z. Omar
2, I. Nazareth
1and G. Rait
1Abstract
Background:Existing dementia risk scores require collection of additional data from patients, limiting their use in practice. Routinely collected healthcare data have the potential to assess dementia risk without the need to collect further information. Our objective was to develop and validate a 5-year dementia risk score derived from primary healthcare data.
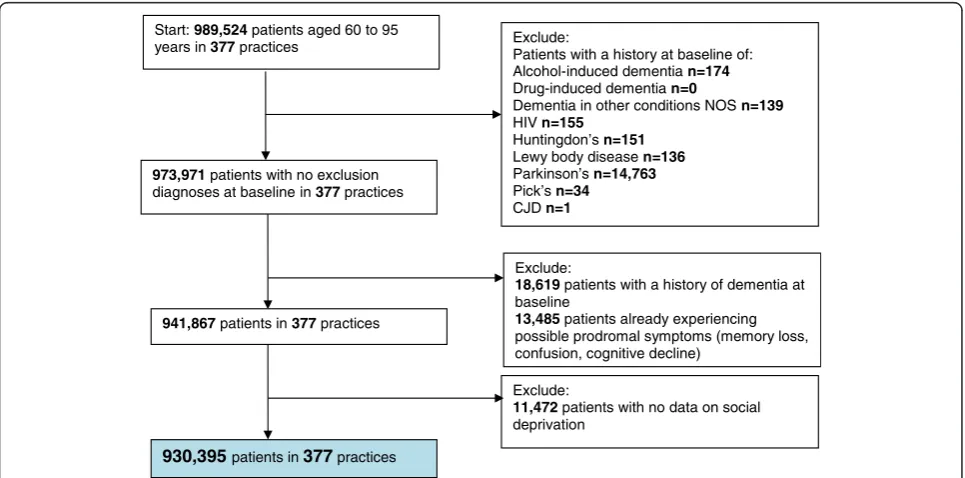
Methods:We used data from general practices in The Health Improvement Network (THIN) database from across the UK, randomly selecting 377 practices for a development cohort and identifying 930,395 patients aged 60–95 years without a recording of dementia, cognitive impairment or memory symptoms at baseline. We developed risk algorithm models for two age groups (60–79 and 80–95 years). An external validation was conducted by validating the model on a separate cohort of 264,224 patients from 95 randomly chosen THIN practices that did not contribute to the development cohort. Our main outcome was 5-year risk of first recorded dementia diagnosis. Potential predictors included sociodemographic, cardiovascular, lifestyle and mental health variables.
Results:Dementia incidence was 1.88 (95 % CI, 1.83–1.93) and 16.53 (95 % CI, 16.15–16.92) per 1000 PYAR for those aged 60–79 (n = 6017) and 80–95 years (n = 7104), respectively. Predictors for those aged 60–79 included age, sex, social deprivation, smoking, BMI, heavy alcohol use, anti-hypertensive drugs, diabetes, stroke/TIA, atrial fibrillation, aspirin, depression. The discrimination and calibration of the risk algorithm were good for the 60–79 years model; D statistic 2.03 (95 % CI, 1.95–2.11), C index 0.84 (95 % CI, 0.81–0.87), and calibration slope 0.98 (95 % CI, 0.93–1.02). The algorithm had a high negative predictive value, but lower positive predictive value at most risk thresholds.
Discrimination and calibration were poor for the 80–95 years model.
Conclusions:Routinely collected data predicts 5-year risk of recorded diagnosis of dementia for those aged 60–79, but not those aged 80+. This algorithm can identify higher risk populations for dementia in primary care. The risk score has a high negative predictive value and may be most helpful in‘ruling out’those at very low risk from further testing or intensive preventative activities.
Keywords:Dementia, Primary care, Risk assessment, Routinely collected data
* Correspondence:[email protected]
1Research Department of Primary Care & Population Health, University College London, Rowland Hill St, London NW3 2PF, UK
Full list of author information is available at the end of the article
Background
More than 115 million people are predicted to have de-mentia by 2050 [1], with huge associated health and social care costs [2]. There is both epidemiological [3, 4] and policy [5] support for the identification and management of modifiable risk factors for dementia to delay dementia onset. Around a third of Alzheimer’s disease cases might be attributable to potentially modifiable risk factors (diabetes, mid-life hypertension, mid-life obesity, de-pression, physical inactivity, smoking, low education) [3]. It has been estimated that a reduction in the seven main modifiable risk factors by 10–25 % would pre-vent an estimated 1–3 million dementia cases world-wide [4]. There is a strong drive internationally for clinicians to be more pro-active in dementia diagnosis [6, 7]. There is, however, a limited evidence base for current approaches to dementia screening and case-finding [8, 9] and further work needs to be completed to validate new methods across different settings, in-cluding primary care [9].
Many multi-factorial prognostic dementia risk models have been developed based on neuropsychological testing and sociodemographic, health, lifestyle, and environmental variables from a range of cohort studies, e.g. [10–20]. These have had variable discriminating power [10, 11], there is no one model that is recommended for population based set-tings [11], and none are widely used in practice. These risk scores entail collecting extra information from patients that would not form part of routine clinical care for the general population, for example, on fish oil intake [20], pesticide ex-posure [20], needing assistance with money or medication [19], years of education [12, 19, 20], depression symptom score [19, 20], genotype [12–14], or neuropsychological testing [13, 15, 17, 18], making these scores potentially more difficult and costly to implement to large populations in non-specialized clinical settings. One tool has recently been developed as a brief screening indicator to identify a high risk population for cognitive screening in primary care, using data from four cohort studies [19]. However, three of the seven factors in this tool are not routinely recorded in General Practitioner (GP) records in the United Kingdom (UK), and would have to be collected from patients indi-vidually. Validated risk scores developed using routinely collected primary care data have been used in practice for other disease areas, such as cardiovascular disease predic-tion, where they performed better than standard algorithms (e.g. Framingham) originally derived from cohort studies [21]. These scores can be easy to implement and calculated without collecting extra new information from the patient. They can be used to risk stratify an eligible practice popula-tion, as the process is automated and uses data already in medical records. No dementia risk model has yet been de-veloped and validated using routinely collected primary care data in the general population. Our study objectives
were to develop and validate a 5-year dementia risk score utilizing routinely collected data from a large nationally representative primary care database in the UK.
Methods
Study design
Cohort studies using routinely collected data; develop-ment and validation of a 5-year risk score for predicting newly recorded dementia diagnoses.
Setting and data source
We used The Health Improvement Network (THIN) primary care database, which derives data from routine clinical practice in the UK [22]. Around 6 % of General Practices in the UK contribute data to the THIN data-base, which contains nearly 12 million patients and is broadly representative of the UK population [22, 23]. Data is collected longitudinally during routine care and includes consultations, symptoms, diagnoses, investiga-tions, health measurements, prescripinvestiga-tions, surgical proce-dures, and referrals. Diagnoses from secondary care and other health information received by the practice are coded and entered using Read codes, a hierarchical coding system which maps onto ICD-10 codes, but which also includes symptom descriptions. THIN data is collected and anon-ymized centrally and linked by postal (zip) code for 150 households to population census data, including neigh-bourhood deprivation (quintiles of Townsend deprivation index) [24]. Diagnostic and prescribing information are generally well recorded and accurate [25, 26] and have been successfully used in numerous studies [22], including dementia [27–29]. Further, THIN data are subject to a range of quality assurance procedures [30, 31]. A validation study of dementia recording suggested a specificity of a GP recorded dementia diagnosis of 83 % and no false negatives in a small sample without recorded dementia [27].
We randomly selected 377 practices from 472 eligible practices providing acceptable quality data to THIN during our study period for a development cohort. The remaining 95 randomly selected eligible practices formed a com-pletely separate validation cohort.
Participants
less than a year’s follow-up data, to allow time for patient history and risk factor information to be recorded (Fig. 1 and Additional file 1: Figure A1).
Follow-up period
Follow-up time was restricted to a maximum of 5 years in both cohort studies. The start of follow-up was the latest of: 1) January 1, 2000; 2) when the individual turned 60 years; 3) one year following new registration with a THIN practice; 4) one year after the practice met standard criteria for accurate recording of deaths, consult-ation, health measurements, and prescribing [30, 31]. The end date was the earliest of dementia incident date, 5 years follow-up, patient died, patient developed an exclusion diagnosis (as listed above), patient left practice, practice left THIN database, or December 31, 2011.
Main outcome
Newly recorded dementia diagnoses, including Alzheimer’s disease, vascular dementia, and unspecified or mixed de-mentia, but excluding dementia diagnoses associated with Parkinson’s disease, Lewy body dementia, Huntingdon, Picks, HIV, and drug-induced and alcohol-related dementia (Read code lists available from the authors) were the pri-mary outcome.
Risk factor measurements
Based on potential risk factors for dementia [3, 4, 32] available in THIN, we examined the following as pre-dictor variables in the risk model:
(1) Sociodemographic measures: age (years), sex, social deprivation (quintiles of Townsend Index), calendar year at baseline (to account for temporal trends). (2) Health status/lifestyle measurements: smoking status
up to 5 years prior to baseline (current, non-smoker or ex-smoker), body mass index (BMI), lipids (total cholesterol/ high density lipoprotein (HDL) cholesterol ratio), systolic blood pressure (SBP), history of heavy alcohol use (more than 56 units per week for men/49 units per week for women), or a Read-code entry in their medical records indicating an alcohol problem.
(3) Medical diagnoses: diabetes, coronary heart disease (CHD), stroke/transient ischemic attack (TIA), or atrial fibrillation at any time prior to baseline. Current (in 12 months prior to baseline) depression diagnosis/treatment with antidepressant medication, anxiety diagnosis/treatment with anxiolytic medication.
(4) Prescription medication: As listed in (3) and anti-hypertensive drugs, hypnotic medication, statins, aspirin and other non-steroidal anti-inflammatory drugs (NSAIDs). Patients were identified as exposed to medications if they had received at least two consecutive prescriptions in the 12 months before baseline.
Analysis
For both the development and validation cohort studies the study population was divided into two groups: those aged 60–79 years and aged 80–95 at baseline. At age
Start:989,524 patients aged 60 to 95
years in377practices Exclude:
Patients with a history at baseline of: Alcohol-induced dementia n=174 Drug-induced dementia n=0
Dementia in other conditions NOS n=139 HIV n=155
Huntingdon’s n=151 Lewy body disease n=136 Parkinson’s n=14,763 Pick’s n=34 CJDn=1 973,971 patients with no exclusion
diagnoses at baseline in377practices
Exclude:
18,619patients with a history of dementia at baseline
13,485patients already experiencing possible prodromal symptoms (memory loss, confusion, cognitive decline)
941,867patients in377practices
Exclude:
11,472patients with no data on social deprivation
930,395 patients in377practices
80 years, a sharp increased risk of dementia has previ-ously been found [19], and in our population there were differences in the distribution of risk factors and their associations with dementia in those aged 60–79 years and older individuals. We considered additional stratifi-cation by sex but age-adjusted risk factor associations with dementia in men and women were similar, justifying combining both sexes in a single model. Separate model development was carried out for the two age groups in the development cohort and separate validation and calibration was performed for each age group in the validation cohort. Analyses were performed using Stata version 12.1.
Sample size calculation
We conservatively estimated that 20 events were re-quired per coefficient to fit a risk model based on studies evaluating the relationship between the number of events and the performance of a risk prediction model, which have shown that 15 events at least may be re-quired to achieve a satisfactory level of model calibration [33]. There were a total of 25 coefficients for all the pre-dictors initially considered, corresponding to 500 de-mentia events needed. Applying an inflation factor to adjust for clustering within practices of 10.741 for the 60–79 years age model (based on intra-class correlation coefficient of 0.00117, estimated from the data, and a mean cluster size of 2,122 people aged 60–79 years per practice), corresponded to a total of 500 × 10.741 = 5,371 dementia events. For the 80–95 years model, the infla-tion factor was 10.915 (based on intra-class correlainfla-tion coefficient of 0.00863 and a mean cluster size of 346 people aged 80–95 years per practice), which corresponded to a total of 500 × 10.915 = 5,458 dementia events.
Missing data imputation
We used the two-fold Fully Conditional Specification al-gorithm method for multiple imputation of longitudinal clinical datasets to impute missing data for both fixed (smoking and height) and time-varying variables (total cholesterol and HDL cholesterol, SBP and weight) in both the development and validation cohorts [34]. This algorithm is an efficient way to use the full longitudinal patient record rather than just the baseline measure-ments to inform the imputation. Missing data in the validation cohort was imputed separately from that in the development cohort. The remaining variables were complete. The imputation model included all variables in the analysis model, plus the outcome and cumulative hazard function. In the backwards elimination process, the variables were included in the final model if retained in 7 out of 10 imputed datasets to avoid over-selection of the variables [35].
Development cohort: model development
For each age group (60–79 years and 80–95 years), we derived the dementia risk score using a Cox proportional hazards regression model, with robust standard errors to account for clustering of individuals within general prac-tices. The assumption of proportional hazards was checked using plots of the log cumulative hazard func-tion and Schoenfeld residuals. Continuous variables were centred and the assumption of a linear relationship was assessed using fractional polynomials, visual checks by plotting graphs of the log hazard ratio by increasing category of the continuous variable, and by inclusion of squared and cubic terms in the Cox models; transfor-mations were made when linear relationships were not confirmed.
All variables were included in the full model prior to backwards elimination. We used backwards elimination to determine which variables should be retained, using the Akaike Information Criteria. After the elimination process we considered the interaction terms systolic blood pressure*anti-hypertensive medication and lipid ratio*statin prescriptions. Interactions were retained if significant and clinically meaningful.
Validation cohort: validation and calibration
For each age group, the model developed using the de-velopment cohort was applied to the validation cohort, to assess performance. We assessed the discriminative performance of the dementia risk models by computing the Uno’s C [36] and Royston’s D [37] statistics for the validation cohort. Uno’s C and Royston’s D statistics were chosen as they have been shown to be less biased in the presence of censored data than other discrimina-tive statistics [36, 37]. Each validation statistic was esti-mated separately for each imputed validation dataset, and then combined using Rubin’s rules to obtain an overall validation statistic. For Uno’s C statistic we calcu-lated confidence intervals from bootstrapping. A random sub-sample of 15 % of the validation cohort was used as the vast size of the dataset made computation of boot-strap confidence intervals for the full sample unfeasible. We assessed calibration by comparing the observed and predicted dementia risk in the validation cohort per decile of predicted risk, and computing the calibration slope. We calculated the sensitivity, specificity, positive predictive value (PPV), and negative predictive value (NPV) using a range of potential risk thresholds, to explore the clinical utility of the risk algorithms.
Results
Development cohort study
which 800,013 were aged 60–79 years and 130,382 aged 80–95 years at baseline (Fig. 1).
Development cohort aged 60–79 years
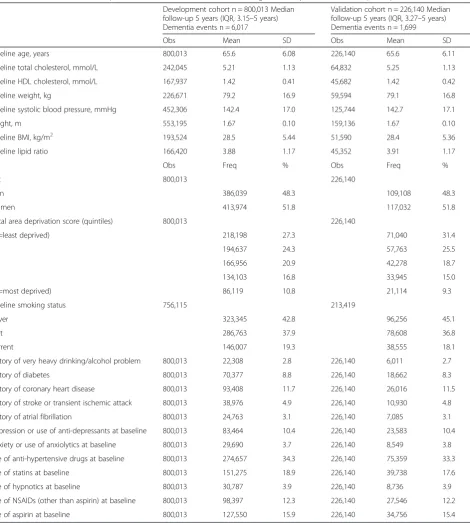
Baseline characteristics There were 413,974 (52 %) women in the 60–79 years development cohort, the mean age at baseline was 65.6 years (SD 6.1 years; Table 1).
Missing data on health measurements are detailed in Additional file 1: Table A.1, with characteristics after multiple imputation in Table A.2.
Incidence of dementia In the development cohort there were 6,017 new diagnoses in 800,013 individuals with 3,205,190 Person Years at Risk (PYAR), corresponding to a crude overall incidence of dementia of 1.88/1000
Table 1Characteristics of development and validation cohorts for those aged 60–79 years (before multiple imputation) Development cohort n = 800,013 Median
follow-up 5 years (IQR, 3.15–5 years) Dementia events n = 6,017
Validation cohort n = 226,140 Median follow-up 5 years (IQR, 3.27–5 years) Dementia events n = 1,699
Obs Mean SD Obs Mean SD
Baseline age, years 800,013 65.6 6.08 226,140 65.6 6.11
Baseline total cholesterol, mmol/L 242,045 5.21 1.13 64,832 5.25 1.13
Baseline HDL cholesterol, mmol/L 167,937 1.42 0.41 45,682 1.42 0.42
Baseline weight, kg 226,671 79.2 16.9 59,594 79.1 16.8
Baseline systolic blood pressure, mmHg 452,306 142.4 17.0 125,744 142.7 17.1
Height, m 553,195 1.67 0.10 159,136 1.67 0.10
Baseline BMI, kg/m2 193,524 28.5 5.44 51,590 28.4 5.36
Baseline lipid ratio 166,420 3.88 1.17 45,352 3.91 1.17
Obs Freq % Obs Freq %
Sex 800,013 226,140
Men 386,039 48.3 109,108 48.3
Women 413,974 51.8 117,032 51.8
Local area deprivation score (quintiles) 800,013 226,140
1 (=least deprived) 218,198 27.3 71,040 31.4
2 194,637 24.3 57,763 25.5
3 166,956 20.9 42,278 18.7
4 134,103 16.8 33,945 15.0
5 (=most deprived) 86,119 10.8 21,114 9.3
Baseline smoking status 756,115 213,419
Never 323,345 42.8 96,256 45.1
Past 286,763 37.9 78,608 36.8
Current 146,007 19.3 38,555 18.1
History of very heavy drinking/alcohol problem 800,013 22,308 2.8 226,140 6,011 2.7
History of diabetes 800,013 70,377 8.8 226,140 18,662 8.3
History of coronary heart disease 800,013 93,408 11.7 226,140 26,016 11.5
History of stroke or transient ischemic attack 800,013 38,976 4.9 226,140 10,930 4.8
History of atrial fibrillation 800,013 24,763 3.1 226,140 7,085 3.1
Depression or use of anti-depressants at baseline 800,013 83,464 10.4 226,140 23,583 10.4
Anxiety or use of anxiolytics at baseline 800,013 29,690 3.7 226,140 8,549 3.8
Use of anti-hypertensive drugs at baseline 800,013 274,657 34.3 226,140 75,359 33.3
Use of statins at baseline 800,013 151,275 18.9 226,140 39,738 17.6
Use of hypnotics at baseline 800,013 30,787 3.9 226,140 8,736 3.9
Use of NSAIDs (other than aspirin) at baseline 800,013 98,397 12.3 226,140 27,546 12.2
PYAR (95 % CI, 1.83–1.93) for 60–79 year olds. This in-cluded 1,831 newly recorded diagnoses of Alzheimer’s dementia, 1,308 of vascular dementia and 2,878 of un-specified or mixed dementia during follow-up.
Associations of risk factors with new GP recorded dementia diagnoses within 5 years Newly recorded dementia diagnoses were associated with increasing age, female sex, calendar year, and living in a deprived area (Additional file 1: Table A.3). There were positive associ-ations with current smoking, hazardous/harmful alcohol drinking, and history of stroke/TIA, diabetes, CHD, atrial fibrillation, or current depression/anti-depressant drug, anxiety/anxiolytic drug, hypnotic drug, and aspirin use. There were no significant associations with NSAIDs (excluding aspirin) and anti-hypertensive drugs. There was a small negative association with both BMI and systolic blood pressure.
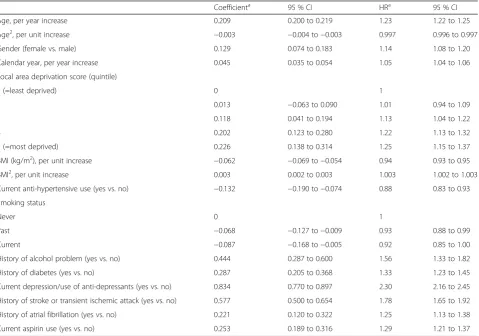
Selection of variables for risk model Following back-wards elimination, age, sex, deprivation, calendar year, BMI, current anti-hypertensive use, smoking status, hazardous/
harmful alcohol drinking, current depression, current as-pirin use, and history of diabetes, stroke, TIA and atrial fib-rillation were all retained in the model (Table 2). Because statin use, lipid ratio, and SBP were all eliminated in the backwards elimination, interaction terms for statin use*lipid ratio and anti-hypertensive use*SBP were not considered.
Development cohort aged 80–95 years
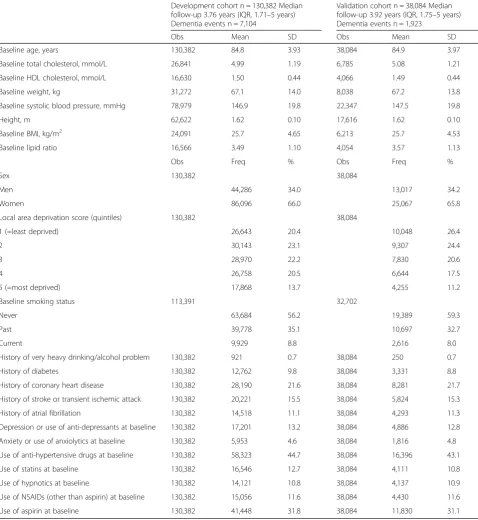
Baseline characteristics There were 86,096 (66 %) women in the 80–95 years development cohort, with a mean age at baseline of 85 years (SD 3.9 years; Table 3). Missing data on health measurements are reported in Additional file 1: Table A.1. Characteristics after mul-tiple imputation are reported in Table A.4.
Incidence of dementia In the 80–95 years development cohort there were 1,483 newly recorded diagnoses of Alzheimer’s dementia, 1,331 of vascular dementia, and 4,290 of unspecified or mixed dementia during follow-up. In total, there were 7,104 new diagnoses in 429, 670 PYAR, corresponding to a crude incidence of dementia
Table 2Final dementia risk model for cohort aged 60–79 years after backwards elimination (from development cohort)
Coefficienta 95 % CI HRa 95 % CI
Age, per year increase 0.209 0.200 to 0.219 1.23 1.22 to 1.25
Age2, per unit increase −0.003 −0.004 to−0.003 0.997 0.996 to 0.997
Gender (female vs. male) 0.129 0.074 to 0.183 1.14 1.08 to 1.20
Calendar year, per year increase 0.045 0.035 to 0.054 1.05 1.04 to 1.06
Local area deprivation score (quintile)
1 (=least deprived) 0 1
2 0.013 −0.063 to 0.090 1.01 0.94 to 1.09
3 0.118 0.041 to 0.194 1.13 1.04 to 1.22
4 0.202 0.123 to 0.280 1.22 1.13 to 1.32
5 (=most deprived) 0.226 0.138 to 0.314 1.25 1.15 to 1.37
BMI (kg/m2), per unit increase −0.062 −0.069 to−0.054 0.94 0.93 to 0.95
BMI2, per unit increase 0.003 0.002 to 0.003 1.003 1.002 to 1.003
Current anti-hypertensive use (yes vs. no) −0.132 −0.190 to−0.074 0.88 0.83 to 0.93
Smoking status
Never 0 1
Past −0.068 −0.127 to−0.009 0.93 0.88 to 0.99
Current −0.087 −0.168 to−0.005 0.92 0.85 to 1.00
History of alcohol problem (yes vs. no) 0.444 0.287 to 0.600 1.56 1.33 to 1.82
History of diabetes (yes vs. no) 0.287 0.205 to 0.368 1.33 1.23 to 1.45
Current depression/use of anti-depressants (yes vs. no) 0.834 0.770 to 0.897 2.30 2.16 to 2.45
History of stroke or transient ischemic attack (yes vs. no) 0.577 0.500 to 0.654 1.78 1.65 to 1.92
History of atrial fibrillation (yes vs. no) 0.221 0.120 to 0.322 1.25 1.13 to 1.38
Current aspirin use (yes vs. no) 0.253 0.189 to 0.316 1.29 1.21 to 1.37
a
Coefficients and hazard ratios (HRs) are obtained by building Cox models separately within each of the 10 imputation datasets and then combining the results using Rubin’s rules. Baseline 5-year survival function, So(5) = 0.9969
of 16.53/1000 PYAR (95 % CI, 16.15–16.92) for those aged 80–95 years at baseline.
Associations of risk factors with new GP recorded dementia diagnosis within 5 yearsNew dementia diag-noses were associated with increasing age and female sex (Additional file 1: Table A.3). There were positive as-sociations with history of stroke/TIA, diabetes, atrial
fibrillation, statin prescriptions, hazardous/harmful alco-hol drinking, current depression/anti-depressant drugs, anxiety/anxiolytic drugs, hypnotic drugs and aspirin use. There were no significant associations with living in a deprived area, CHD, and total cholesterol/HDL ratio. There was a small negative association with current smoking, BMI, systolic blood pressure, anti-hypertensive drugs, and NSAIDs (excluding aspirin).
Table 3Characteristics of development and validation cohorts for those aged 80–95 years (before imputation)
Development cohort n = 130,382 Median follow-up 3.76 years (IQR, 1.71–5 years) Dementia events n = 7,104
Validation cohort n = 38,084 Median follow-up 3.92 years (IQR, 1.75–5 years) Dementia events n = 1,923
Obs Mean SD Obs Mean SD
Baseline age, years 130,382 84.8 3.93 38,084 84.9 3.97
Baseline total cholesterol, mmol/L 26,841 4.99 1.19 6,785 5.08 1.21
Baseline HDL cholesterol, mmol/L 16,630 1.50 0.44 4,066 1.49 0.44
Baseline weight, kg 31,272 67.1 14.0 8,038 67.2 13.8
Baseline systolic blood pressure, mmHg 78,979 146.9 19.8 22,347 147.5 19.8
Height, m 62,622 1.62 0.10 17,616 1.62 0.10
Baseline BMI, kg/m2 24,091 25.7 4.65 6,213 25.7 4.53
Baseline lipid ratio 16,566 3.49 1.10 4,054 3.57 1.13
Obs Freq % Obs Freq %
Sex 130,382 38,084
Men 44,286 34.0 13,017 34.2
Women 86,096 66.0 25,067 65.8
Local area deprivation score (quintiles) 130,382 38,084
1 (=least deprived) 26,643 20.4 10,048 26.4
2 30,143 23.1 9,307 24.4
3 28,970 22.2 7,830 20.6
4 26,758 20.5 6,644 17.5
5 (=most deprived) 17,868 13.7 4,255 11.2
Baseline smoking status 113,391 32,702
Never 63,684 56.2 19,389 59.3
Past 39,778 35.1 10,697 32.7
Current 9,929 8.8 2,616 8.0
History of very heavy drinking/alcohol problem 130,382 921 0.7 38,084 250 0.7
History of diabetes 130,382 12,762 9.8 38,084 3,331 8.8
History of coronary heart disease 130,382 28,190 21.6 38,084 8,281 21.7
History of stroke or transient ischemic attack 130,382 20,221 15.5 38,084 5,824 15.3
History of atrial fibrillation 130,382 14,518 11.1 38,084 4,293 11.3
Depression or use of anti-depressants at baseline 130,382 17,201 13.2 38,084 4,886 12.8
Anxiety or use of anxiolytics at baseline 130,382 5,953 4.6 38,084 1,816 4.8
Use of anti-hypertensive drugs at baseline 130,382 58,323 44.7 38,084 16,396 43.1
Use of statins at baseline 130,382 16,546 12.7 38,084 4,111 10.8
Use of hypnotics at baseline 130,382 14,121 10.8 38,084 4,137 10.9
Use of NSAIDs (other than aspirin) at baseline 130,382 15,056 11.6 38,084 4,430 11.6
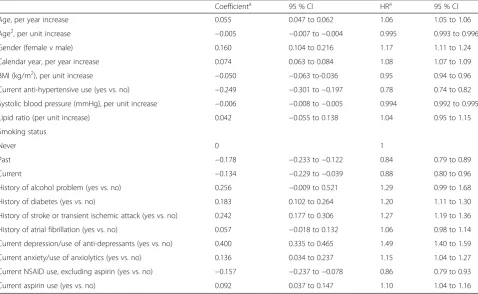
Selection of variables for risk model Following back-wards elimination, age, sex, calendar year, BMI, current anti-hypertensive use, SBP, lipid ratio, smoking status, hazardous/harmful alcohol drinking, current depression/ anti-depressants, current anxiety/anxiolytics, current as-pirin use, current other NSAID use, and history of dia-betes, stroke, or TIA and atrial fibrillation were all retained in the model (Table 4). As statin use was excluded, the interaction term statin use*lipid ratio was not considered. An interaction term for SBP*anti-hypertensive use was considered, but was not statistically significant (P= 0.6) and therefore was not included.
Validation cohort study
We identified 264,224 eligible patients aged 60–95 years in 95 practices for the validation cohort, of which 226,140 were aged 60–79 years and 38,084 were aged 80–95 years at baseline (Additional file 1: Figure A.1).
Validation cohort aged 60–79 years
Baseline characteristics/incidence of dementia The characteristics of the validation cohort were similar to the development cohort (Table 1). Missing data on health mea-surements are reported in Additional file 1: Table A.1, with
characteristics after multiple imputation in Table A.2. In-cidence rates for dementia were similar to those in the development cohort, with 1,699 new diagnoses in 226,140 individuals with 915,380 PYAR, corresponding to a crude overall incidence of dementia of 1.86/1000 PYAR (95 % CI, 1.77–1.95) for 60–79 year olds. This included 528 newly recorded diagnoses of Alzheimer’s dementia, 384 of vascular dementia, and 787 of unspeci-fied or mixed dementia during follow-up.
Discrimination and calibration The model performed well in terms of discrimination, with a Royston’s D stat-istic of 2.03 (95 % CI, 1.95–2.11) and Uno’s C index 0.84 (95 % CI, 0.81–0.87). The calibration slope suggested good calibration (0.98, 95 % CI, 0.93–1.02).
Risk classification Utilizing a range of possible cut-offs to indicate‘high risk’for dementia, the specificity of the risk algorithm was high but with lower sensitivity, and there was a high NPV, but a low PPV (Table 5). For ex-ample, if we chose a threshold to define high risk of 2 %, the specificity would be 85.15 %, sensitivity 58.36 %, PPV 2.89, and NPV 99.63. We include details of how to calculate the risk of dementia for a new patient in Additional file 1.
Table 4Final dementia risk model for cohort aged 80–95 years after backwards elimination (development cohort)
Coefficienta 95 % CI HRa 95 % CI
Age, per year increase 0.055 0.047 to 0.062 1.06 1.05 to 1.06
Age2, per unit increase −0.005 −0.007 to−0.004 0.995 0.993 to 0.996
Gender (female v male) 0.160 0.104 to 0.216 1.17 1.11 to 1.24
Calendar year, per year increase 0.074 0.063 to 0.084 1.08 1.07 to 1.09
BMI (kg/m2), per unit increase −0.050 −0.063 to-0.036 0.95 0.94 to 0.96
Current anti-hypertensive use (yes vs. no) −0.249 −0.301 to−0.197 0.78 0.74 to 0.82
Systolic blood pressure (mmHg), per unit increase −0.006 −0.008 to−0.005 0.994 0.992 to 0.995
Lipid ratio (per unit increase) 0.042 −0.055 to 0.138 1.04 0.95 to 1.15
Smoking status
Never 0 1
Past −0.178 −0.233 to−0.122 0.84 0.79 to 0.89
Current −0.134 −0.229 to−0.039 0.88 0.80 to 0.96
History of alcohol problem (yes vs. no) 0.256 −0.009 to 0.521 1.29 0.99 to 1.68
History of diabetes (yes vs. no) 0.183 0.102 to 0.264 1.20 1.11 to 1.30
History of stroke or transient ischemic attack (yes vs. no) 0.242 0.177 to 0.306 1.27 1.19 to 1.36
History of atrial fibrillation (yes vs. no) 0.057 −0.018 to 0.132 1.06 0.98 to 1.14
Current depression/use of anti-depressants (yes vs. no) 0.400 0.335 to 0.465 1.49 1.40 to 1.59
Current anxiety/use of anxiolytics (yes vs. no) 0.136 0.034 to 0.237 1.15 1.04 to 1.27
Current NSAID use, excluding aspirin (yes vs. no) −0.157 −0.237 to−0.078 0.86 0.79 to 0.93
Current aspirin use (yes vs. no) 0.092 0.037 to 0.147 1.10 1.04 to 1.16
a
Coefficients and hazard ratios (HRs) are obtained by building Cox models separately within each of the 10 imputation datasets and then combining the results using Rubin’s rules. Baseline 5 year survival function, So(5) =−0.9277
Validation cohort aged 80–95 years
Baseline characteristics/incidence of dementia The characteristics of those aged 80–95 years in the valid-ation cohort were similar to the development cohort (Table 3). Missing data on health measurements are re-ported in Additional file 1: Table A.1, with characteristics after multiple imputation in Table A.3. Incidence rates for dementia were similar to those in the development co-hort, with 1,923 new diagnoses in 38,084 individuals with 127,510 PYAR, corresponding to a crude overall incidence of dementia of 15.08/1000 PYAR (95 % CI, 14.42–15.77) for 80–95 year olds. This included 408 newly recorded diagnoses of Alzheimer’s dementia, 364 of vascular dementia, and 1,151 of unspecified or mixed dementia during follow-up.
Discrimination and calibration The model from the development cohort performed poorly in terms of dis-crimination (Royston’s D statistic 0.86, 95 % CI, 0.76–0.95 and Uno’s C index 0.56, 95 % CI, 0.55–0.58) and calibra-tion (calibracalibra-tion slope 1.04, 95 % CI, 0.89–1.18) when ap-plied to the validation cohort. As this model performed poorly we have not reported on risk classification.
Discussion
This study developed risk algorithms for predicting a new recorded dementia diagnosis in two age groups in primary care. In our validation study, the dementia risk algorithm developed for the 60–79 year old population performed well, but the algorithm for the older 80–95 years population did not. Our model is the first to be de-rived entirely from routinely collected health data, which can be calculated without collecting additional information from the patient. In people aged between 60–79 years, the dementia risk score included records of depression, stroke, high alcohol consumption, diabetes, atrial fibrillation, as-pirin use, smoking, decreasing weight, and untreated blood pressure. Aspirin use may be a marker for underlying vas-cular risk. The directions of associations of some factors, such as weight and cholesterol, have been shown to change in later life with the onset of disability, frailty and cognitive
decline and potential pre-clinical dementia [38, 39]. In our study, the ‘high risk’ population may include those with pre-clinical or undetected/recorded dementia, which may explain some of the associations observed with individual factors. Our algorithm uses routinely collected healthcare data to predict the risk of a GP recorded diagnosis within 5 years, and the profile of risk factors within the score is different to those aimed at identifying future risk, for example mid-life risk scores for dementia [40].
At a low threshold of 1 %, our risk algorithm had a sensitivity of 78 % and specificity of 73 %. With thresh-olds of 2 % or above, our risk algorithm had higher spe-cificity (85 %) but a correspondingly lower sensitivity (58 %). In previous prediction models derived from co-hort studies, models have generally had either high spe-cificity with low sensitivity or vice versa [10, 11], and the choice of threshold will depend on the intended use.
Strengths and limitations
Our development cohort study included more than 900,000 older people from across the UK registered with THIN General Practices, with more than 13,000 new dementia events recorded. The findings are likely to be generalizable to the UK population, but may not be generalizable to other different healthcare settings. The data source includes longitudinal data on a wide range of potential risk factors, including demographic factors, lifestyle, heath status measurements, medical history/diagnoses, and drugs. We had power to con-sider a wide range of potentially important risk factors, in comparison to cohort studies with smaller samples [10–20]. In those aged 60–79 years, we had good re-cording of data for most factors, and for missing data at baseline we used robust multiple imputation tech-niques utilizing the entire patient record, taking into account the longitudinal records rather than relying solely on baseline parameters.
Using routinely collected data to develop the risk al-gorithm has some inherent limitations. It may be less complete in terms of potential predictor variables than co-horts designed for research. The older cohort (80–95 years) had fewer routine measurements of health status such as Table 5Risk classification using the 60–79 years dementia risk algorithm when applied to validation cohort
Cut off for high risk Sensitivity Specificity PPV NPV Patients classified as high risk, n (%)
Patients classified as high risk who develop dementia, n (%)
Patients classified as low risk, n (%)
Patients classified as low risk who develop dementia, n (%)
1 % 77.70 73.05 2.14 99.77 61,803 (27.33) 1,320 (2.14) 164,337 (72.67) 379 (0.23)
2 % 58.36 85.15 2.89 99.63 34,323 (15.18) 992 (2.89) 191,817 (84.82) 707 (0.37)
5 % 19.39 97.03 4.71 99.38 6,989 (3.09) 329 (4.71) 219,151 (96.91) 1,370 (0.62)
10 % 5.62 99.52 8.20 99.29 1,164 (0.51) 95 (8.2) 224,976 (99.49) 1,604 (0.71)
20 % 0.72 99.96 10.87 99.25 113 (0.05) 12 (10.87) 226,027 (99.95) 1,687 (0.75)
BMI and lipid profile. The current validation applies to use of the risk score in the case where the GP has complete in-formation on the factors in the model. There were low levels of missing data in some individuals on smoking sta-tus and BMI for those 60–79 years, which we imputed for our analysis. For all other factors in the final model, if missing, the factor was presumed to be absent.
Some potential risk factors, such as family history of de-mentia, physical activity or educational status, are poorly recorded in routine UK primary care and could not be included. Studies suggest that chronic and significant medical diagnoses entered in electronic records are likely to be accurate [25]. Other evidence suggests dementia is under-recorded in primary care [41]. Our incidence rates for dementia were lower than rates reported in studies using screening, particularly for those over 80 years [42]; however, there is some evidence that dementia prevalence is stabilizing more recently, despite population ageing [43], and our study is based on more contemporary data. This potential under-recording of dementia diagnoses in GP records may lead to an underestimation of the true predictive power of the risk score. In common with most risk models, we only accounted for baseline variables and for time-varying factors, exposure status may change during the follow-up period. Routinely collected data has the advantage of reflecting the data normally available to a clinician in practice.
Implications
We used routinely collected primary care data to derive a relatively simple new risk algorithm, predicting a new GP recorded dementia diagnosis within 5 years, which worked well in those aged 60–79 years, but not in older age groups. This supports the previous suggestion that given the steep rise in risk of dementia at 80 years, it would be reasonable to test for dementia beyond this point on the basis of age alone [19]. It is likely that risk scores using traditional risk factors will not perform well in this population, and a different approach might be needed to identify a higher risk group aged 80 or above using, for example, measures of frailty.
Our new dementia risk algorithm for 60–79 year olds can be added to clinical software systems and a practice could, for example, run this risk model on all eligible people and offer those at risk more detailed testing or spe-cific preventive management. Using a range of thresholds, there was good specificity but lower sensitivity, and a very high NPV but a low PPV. This risk algorithm may be most helpful to‘rule out’those at low risk from dementia case finding programs. This might avoid unnecessary in-vestigations and anxiety for those at very low risk and make these programs more cost-effective. The risk algo-rithm may enable the identification of ‘at risk’groups to approach for future research studies. We report a range of
thresholds to allow clinicians or researchers to select the threshold that gives the optimum balance of sensitivity and specificity for dementia risk, depending on the intended use.
Further research should be undertaken to explore the performance of the Dementia Risk Score in different settings and populations, including variations in per-formance in areas where the prevalence, detection, and recording of dementia by GPs is very low or very high. We also need to further understand how the tool might be used in practice, the ethical implications, and what the impact of this might be for older people, clinicians, and the potential costs for health services.
Conclusion
Routinely collected health data can predict five year risk of recorded diagnosis of dementia in primary care for in-dividuals aged 60-79 years, but not for those aged 80 years or more. This risk score can be used to identify higher risk populations for dementia in primary care. The risk score has a high negative predictive value and may be most helpful in‘ruling out’those at very low risk from further testing.
Availability of data and materials
Codelists, Do-files to construct the Dementia Risk Score, and data are available from the corresponding author, Dr. Kate Walters.
Ethics
The NHS South-East Multi-centre Research Ethics Committee approved the scheme for THIN to provide anonymous patient data to researchers. Scientific approval for this study was obtained from THIN Scientific Review Committee in October 2012.
Additional file
Additional file 1:Supplementary tables(DOCX 46 kb)
Abbreviations
BMI:Body mass index; CHD: Coronary Heart Disease; GP: General Practitioner; HDL: High Density Lipoprotein; NSAIDS: Non-steroidal anti-inflammatory drugs; NPV: Negative predictive value; PPV: Positive predictive value; PYAR: Person years at risk; THIN: The Health Improvement Network primary care database; SBP: Systolic blood pressure; TIA: Transient ischemic attack.
Competing interests
The authors declare that they have no competing interests.
Authors’contributions
Acknowledgements
The“Predicting dementia risk in primary care: development and validation of a risk score using routinely collected data”study is funded by the National Institute for Health Research (NIHR) School for Primary Care Research (SPCR), UK (http://www.nihr.ac.uk/funding/school-for-primary-care-research.htm). RO was funded by the NIHR UCLH/UCL Biomedical Research Centre. This article presents independent research funded by the NIHR, UK. The views expressed are those of the authors and not necessarily those of the NHS, the NIHR or the Department of Health. The funder has had no role in the study design, in the collection, analysis, and interpretation of data, in the writing of the manuscript, or decision to submit for publication.
Author details
1Research Department of Primary Care & Population Health, University College London, Rowland Hill St, London NW3 2PF, UK.2Department of Statistical Science, University College London, Gower Street, London WC1E 6BT, UK.
Received: 30 September 2015 Accepted: 16 December 2016
References
1. Alzheimer’s Disease International. World Alzheimer Report 2009. London: Alzheimer’s Disease International; 2009.
2. Alzheimer’s Disease International. World Alzheimer Report 2010: The Global Economic Impact of Dementia. London: Alzheimer’s Disease International; 2010. 3. Norton S, Matthews FE, Barnes D, Yaffe K, Brayne C. Potential for primary
prevention of Alzheimer’s disease: an analysis of population-based data. Lancet Neurol. 2014;13:788–94.
4. Barnes DE, Yaffe K. The projected effect of risk factor reduction on Alzheimer’s disease prevalence. Lancet Neurol. 2011;10:819–28.
5. Lincoln P, Fenton K, Alessi C, Prince M, Brayne C, Wortmann M, et al. The Blackfriars Consensus on brain health and dementia. Lancet. 2014;383(9931): 1805–6.
6. G8 Dementia Summit 2014. https://www.gov.uk/government/publications/ g8-dementia-summit-global-action-against-dementia/.
Accessed 12 January 2016.
7. Boorson S, Frank L, Bayley PJ, Boustani M, Dean M, Lin PJ, et al. Improving dementia care: the role of screening and detection of cognitive impairment. Alzheimers Dement. 2013;9:151–9.
8. Fox C, Lafortune L, Boustani M, Dening T, Rait G, Brayne C. Screening for dementia–is it a no brainer? Int J Clin Pract. 2013;67(11):1076–80. doi:10. 1111/ijcp.12239.
9. Stephan BC, Brayne C. Risk factors and screening methods for detecting dementia: a narrative review. J Alzheimers Dis. 2014;42 Suppl 4:S329–38. doi: 10.3233/JAD-141413.
10. Stephan BC, Kurth T, Matthews FE, Brayne C, Dufouil C. Dementia risk prediction in the population: are screening models accurate? Nat Rev Neurol. 2010;6:318–26. 11. Tang EYH, Harrison SL, Errington L, Gordon MF, Visser PJ, Novak G, et al.
Current developments in dementia risk prediction modelling: an updated systematic review. PLoS One. 2015;10(9), e0136181. doi:10.1371/journal.pone. 0136181.
12. Kivipelto M, Ngandu T, Laatikainen T, Winblad B, Soininen H, Tuomilehto J. Risk score for the prediction of dementia risk in 20 years among middle aged people: a longitudinal, population-based study. Lancet Neurol. 2006;5: 735–41.
13. Barnes DE, Covinsky KE, Whitmer RA, Kuller LH, Lopez OL, Yaffe K. Predicting risk of dementia in older adults: the late-life dementia risk index. Neurology. 2009;73:173–9.
14. Reitz C, Tang MX, Schupf N, Manly JJ, Mayeux R, Luchsinger JA. A summary risk score for the prediction of Alzheimer disease in elderly persons. Arch Neurol. 2010;67:835–41.
15. Jessen F, Wiese B, Bickel H, Eifflander-Gorfer S, Fuchs A, Kaduszkiewicz H, et al. Prediction of dementia in primary care patients. PLoS One. 2011;6, e16852. 16. Song X, Mitnitski A, Rockwood K. Nontraditional risk factors combine to
predict Alzheimer disease and dementia. Neurology. 2011;77:227–34. 17. Wolfsgruber S, Jessen F, Wiese B, Stein J, Bickel H, Mösch E, et al. The CERAD
neuropsychological assessment battery total score detects and predicts Alzheimer disease dementia with high diagnostic accuracy. Am J Geriatric Psych. 2014;22(10):1017–28. doi:10.1016/j.jagp.2012.08.021.
18. Restaino M, Matthews FE, Minett T, Albanese E, Brayne C, Stephan BCM. Predicting risk of 2-year incident dementia using the camcog total and subscale scores. Age Ageing. 2013;42(5):649–53. doi:10.1093/ageing/aft082. 19. Barnes DE, Beiser AS, Lee A, Langer KM, Koyama A, Pries SR, et al. Development
and validation of a brief dementia screening indicator for primary care. Alzheimers Dement. 2014;10(6):656–65.e1. doi:10.1016/j.jalz.2013.11.006. 20. Anstey KJ, Cherbuin N, Herath PM, Qiu C, Kuller LH, Lopez OL, et al. A self-report
risk index to predict occurrence of dementia in three independent cohorts of older adults: the ANU-ADRI. PLoS One. 2014;9(1), e86141. doi:10.1371/journal. pone.0086141.
21. Collins GS, Altman D. Predicting the 10 year risk of cardiovascular disease in the United Kingdom: independent and external validation of an updated version of QRISK2. BMJ. 2012;344, e4181.
22. The Health Improvement Network. London: The Health Improvement Network. 2015. http://csdmruk.cegedim.com/. Accessed 12 January 2016. 23. Blak BT, Thompson M, Dattani H, Bourke A. Generalisability of The Health Improvement Network (THIN) database: demographics, chronic disease prevalence and mortality rates. Inform Prim Care. 2011;19:251–5. 24. Townsend P, Phillimore P, Beattie A. Inequalities in health in the northern
region. Newcastle-upon-Tyne: Northern Regional Health Authority and University of Bristol; 1986.
25. Lewis JD, Schinnar R, Bilker WB, Wang X, Strom BL. Validation studies of the health improvement network (THIN) database for pharmacoepidemiology research. Pharmacoepidemiol Drug Saf. 2007;16:393–401.
26. Ruigómez A, Martín-Merino E, Rodríguez LA. Validation of ischemic cerebrovascular diagnoses in the health improvement network (THIN). Pharmacoepidemiol Drug Saf. 2010;19:579–85.
27. Dunn N, Mullee M, Perry VH, Holmes C. Association between dementia and infectious disease: evidence from a case–control study. Alzheimer Dis Assoc Disord. 2005;19:91–4.
28. Rait G, Walters K, Bottomley C, Petersen I, Iliffe S, Nazareth I. Survival of people with clinical diagnosis of dementia in primary care: cohort study. BMJ. 2010; 341:c3584.
29. Grant R, Drennan V, Rait G, Petersen I, Iliffe S. First diagnosis and management of incontinence in older people with and without dementia in primary care: a cohort study using The Health Improvement Network primary care database. PLoS Med. 2013;10, e1001505.
30. Maguire A, Blak BT, Thompson M. The importance of defining periods of complete mortality reporting for research using automated data from primary care. Pharmacoepidemiol Drug Saf. 2009;18(1):76–83.
31. Horsfall L, Walters K, Petersen I. Identifying periods of acceptable computer usage in primary care research databases. Pharmacoepidemiol Drug Saf. 2013;22(1):64–9.
32. Di Marco LY, Marzo A, Muñoz-Ruiz M, Ikram MA, Kivipelto M, Ruefenacht D, et al. Modifiable lifestyle factors in dementia: a systematic review of longitudinal observational cohort studies. J Alz Dis. 2014;42:119–35. doi:10.3233/JAD-132225. 33. Harrell FE. Regression modeling strategies with applications to linear
models. Logistic Regression, and Survival Analysis Series: Springer Series in Statistics. Harrell FE. 1st ed. 2002. Corr. 2nd printing 2001, XXIII.
34. Welch CA, Petersen I, Bartlett JW, White IR, Marston L, Morris RW, et al. Evaluation of a two-fold fully conditional multiple imputation for longitudinal electronic health record data. Stat Med. 2014;33:3725–37. doi:10.1002/sim.6184. 35. Wood AM, White IR, Royston P. How should variable selection be performed
with multiply imputed data? Stat Med. 2008;27:3227–46.
36. Uno H, Cai T, Pencina MJ, D'Agostino RB, Wei LJ. On the C-statistics for evaluating overall adequacy of risk prediction procedures with censored survival data. Stat Med. 2011;30(10):1105–17.
37. Royston P, Sauerbrei W. A new measure of prognostic separation in survival data. Stat Med. 2004;23:723–48.
38. Anstey KJ, Lipnicki DM, Low LF. Cholesterol as a risk factor for dementia and cognitive decline: A systematic review of prospective studies with meta-analysis. Am J Geriatric Psychiat. 2008;16:343–54.
39. Anstey KJ, Cherbuin N, Budge M, Young J. Body mass index in midlife and late-life as a risk factor for dementia: A meta-analysis of prospective studies. Obes Rev. 2011;12:e426–37. doi:10.1111/j.1467-789X.2010.00825.x. 40. Exalto LG, Quesenberry CP, Barnes D, Kivipelto M, Biessels GJ, Whitmer RA.
Midlife risk score for the prediction of dementia four decades later. Alzheimers Demen. 2014;10(5):562–70. doi:10.1016/j.jalz.2013.05.1772. 41. Boustani M, Peterson B, Hanson L, Harris R, Lohr K. Screening for dementia
42. Schrijvers EM, Verhaaren BF, Koudstaal PJ, Hofman A, Ikram MA, Breteler MM. Is dementia incidence declining? Trends in dementia incidence since 1990 in the Rotterdam Study. Neurology. 2012;78:1456–63.
43. Wu YT, Fratiglioni L, Matthews FE, Lobo A, Breteler MM, Skoog I, et al. Dementia in western Europe: epidemiological evidence and implications for policy making. Lancet Neurol. 2016;15(1):116–24. doi:10.1016/S1474-4422(15)00092-7.
• We accept pre-submission inquiries
• Our selector tool helps you to find the most relevant journal
• We provide round the clock customer support
• Convenient online submission
• Thorough peer review
• Inclusion in PubMed and all major indexing services • Maximum visibility for your research
Submit your manuscript at www.biomedcentral.com/submit