VOLUME 38, ARTICLE 16, PAGES 373
,
400
PUBLISHED 26 JANUARY 2018
http://www.demographic-research.org/Volumes/Vol38/16/ DOI: 10.4054/DemRes.2018.38.16
Research Article
A network approach to studying cause-of-death
interrelations
Viviana Egidi
Michele Antonio Salvatore
Giulia Rivellini
Silvia D’Angelo
© 2018 Egidi, Salvatore, Rivellini & D’Angelo.
This open-access work is published under the terms of the Creative Commons Attribution 3.0 Germany (CC BY 3.0 DE), which permits use, reproduction, and distribution in any medium, provided the original author(s) and source are given credit.
1 Introduction and objectives 374
2 Data and method 375
2.1 Data 375
2.2 Fundamentals of social network analysis: from theory to mortality analysis
376
2.3 The raw adjacency matrix and its normalization 380
3 Results 381
3.1 The MCOD network 381
3.2 The MCOD network of strongest relationships: nodes-cause
indicators 382
3.3 MCOD networks: analytical and graphical comparison of the strongest relationships
384
4 Discussion and conclusion 388
5 Acknowledgements 392
References 393
A network approach to studying cause-of-death interrelations
Viviana Egidi1Michele Antonio Salvatore2
Giulia Rivellini3
Silvia D’Angelo1
Abstract
BACKGROUNDMultiple causes of death describe complex death processes marked by the simultaneous presence of several diseases and conditions, primarily at older ages.
OBJECTIVE
We intend to explore the opportunity offered by the Social Network Analysis (SNA) in the study of multiple relationships in the causes of death.
METHODS
SNA allowed us to reconstruct the complex system of relationships linking the causes of death mentioned in the same death certificate for Italian men and women aged 65 years and over in 2011. The causes can be represented as actors of a network where the relational tie establishes a linkage between a cause mentioned together with another. The strength of this association is represented by the frequency of the joint mentioning in the same certificate controlling for the confounding effect due to the different prevalence of the causes.
RESULTS
The analysis clearly brought out that causes of death describe a very dense system of relationships. Considering only the strongest associations, the graphical analysis showed subgroups of causes, within which cross-references are very frequent while mentions external to the group are rare. Moreover, SNA concepts and instruments allowed us to identify causes playing important roles in death processes and mortality patterns.
1 Sapienza Università di Roma, Rome, Italy. 2 Istituto Nazionale di Statistica (ISTAT), Rome, Italy.
CONCLUSIONS
SNA has proved to be very powerful in identifying the relationships between causes of death, on which health policies should take action to further reduce mortality risks of elderly persons.
CONTRIBUTION
The method was able to highlight complex structures composing subgroups of diseases, offering a clearer picture of the characteristics of death processes than the analyses conducted so far have allowed.
1. Introduction and objectives
As mortality at older ages is frequently a consequence of complex pathological patterns caused by the interaction of many diseases (Janssen 1940), the underlying cause of death may not reflect the complexity of the process leading to death (Dorn and Moriyama 1964). The entire set of causes listed in the death certificate as multiple causes of death (MCOD) is a more appropriate portrayal of actual mortality risks among elderly people. With the increasing use of automated coding systems to capture information from death certificates, data on both underlying and contributing causes is now widely available, and many studies are exploring the added value of the MCOD approach in analyzing mortality risks.
process, as well as preventing the identification of diseases and conditions that play an active role in pathological patterns.
To overcome these limitations, we employ social network analysis (SNA), a set of methods commonly used to analyze social relations between actors acting in complex systems with multiple relationships. In practice, the causes of death mentioned in death certificates can be viewed as a network, where the association among actors (the causes of death) represents the frequency with which each cause of death is mentioned with any others in death certificates. The MCOD network meets the formal requirements for using this method in terms of the interdependence of entities and actions as actors in the network and the relationships between them. Clearly, the meaning assigned here to entities and actions is quite different from that of classical SNA applications; in the present case, entities refer to the causes of death mentioned in the death certificate, and relationship between two causes refers to joint mention in a given certificate.
2. Data and method
2.1 DataData on causes of death was drawn from the Italian National Vital Statistics Death Registry, which is managed by the Italian National Institute of Statistics (ISTAT), based on death certificate information reported by certifying physicians. Following WHO recommendations, the Italian certificate comprises two parts. Part I records the diseases or conditions that led directly to death and is designed to identify the underlying cause of death. Part II records any other significant condition that unfavorably influenced the course of the morbid process but did not relate directly to the condition causing death.
After acquiring the information in digital format, an automated coding system
(CODSAN II) assigns a ICD-10 classification code to each condition and identifies the underlying cause by applying a set of rules established by WHO. CODSAN II was introduced in 1995 as an adaptation of two systems: the American Classification of Medical Entities (ACME) and the American Mortality Medical Indexing, Classification and Retrieval (MICAR) system (ISTAT 2004).
purposes and with at least one per thousand of total mentioned causes among men or women aged 65 and over (see Table A-1 in the Appendix). These are organized as 15 major groups, corresponding largely to ICD-10 chapters. In this list, any differences between men and women relate exclusively to differences in physiology. Some of the conditions reported by the certifying physician involve ill-defined causes or mechanisms of death (e.g., cardiac arrest, respiratory failure) that shed no light on the mortality process, and all mentions of these conditions (with the exception of senility) were excluded from the analysis. The average number of causes of death mentioned in the death certificates of all persons over 65 who died in Italy in 2011 was 3.3 (3.4 for men and 3.3 for women).
2.2 Fundamentals of social network analysis: from theory to mortality analysis
Used mainly in the analysis of social interactions, social network analysis (SNA) is an integrated set of techniques for analyzing relations among actors, based on the language of graph theory and matrix algebra. Interest in SNA has grown rapidly since 1990, marked by a great diversity of new quantitative applications within what is now an established paradigm. The social network perspective and methods are now widely used in the behavioral sciences and in research on epidemiology, organizations, economics, industrial engineering, sex, drug abuse, and the spread of AIDS, as well as by criminologists and physicists (see Rivellini 2006). However, social network analysis of mortality remains relatively unexplored.
In general, SNA seeks to understand “linkages among social entities and the implications of these linkages” (Wasserman and Faust 1994: 17). The approach centers on the key concepts of the ‘actor’ (which can be an individual, a collective social unit, or a corporate or conceptual entity) and ‘relational ties’ (which link actors to one another).
The defining feature of a tie is that it establishes a linkage between a pair of actors; a social network consists of a finite set or sets of actors and the relation or relations defined on them. The presence of relational information is a critical and defining feature of a social network (Wasserman and Faust 1994: 18).
network analysis facilitates the study of relationships among systems of actors, where a system comprises ties among members of some groups.
Depending on the number of sets of actors (or ‘mode’), we can distinguish two types of network: ‘one-mode’ and ‘two-mode.’ The more common type is the one-mode network, comprising a single set of actors and the relations that connect them. A two-mode or affiliation network structure comprises two sets of units (e.g., people and events) and the relations that connect the two sets (e.g., participation of people in social events) (Wasserman and Faust 1994).
Graph theory helps to visualize a social network and also provides a set of primitive concepts referring to social structural properties. From this perspective, a network can be represented as a graph, in which a set of ‘nodes’ is connected by ‘arches’ or ‘edges.’ Where the relation is directional, the corresponding graph is directed, and lines (arches) are orientated – that is, the presence of a line from node ni to
node nj does not imply the presence of another line in the opposite direction.
Nondirectional relations correspond to undirected graphs, meaning that lines (edges) are not orientated; for instance, in the case of a scientific collaboration or co-authorship, association, or affiliation, the network is visualized by a nondirectional graph consisting of a set of nodes and a set of undirected edges connecting those nodes. In such cases, the relation between ni and nj is symmetric or reciprocal, and the generic tie is defined
as xij (i÷j), where xij = 1 if at least one tie is observed between actor/author i (i = 1,
…,n) and j (j = 1,…, n – 1) (i.e., if a paper is co-authored, or ifi andj belong to the
same social club); otherwise, xij = 0 and by definition xij = xji (see Rivellini, Rizzi, and
Zaccarin 2006).
The number of lines incident to each node in a graph is called the node’s ‘degree.’ This can be understood as a measure of the ‘activity’ of the actor it represents and forms the basis for measures of ‘centrality.’ A graph’s ‘density’ is the proportion of lines actually present in the graph (in relation to the possible maximum) (see Wasserman and Faust 1994: 101). Where social network data also provides information about the strength or intensity of each tie, this is known as a ‘valued’ graph, in which each line bears a value. In the case of a co-authorship network, the number of co-authored papers determines the intensity of relations, and each line in the graph has a value that reflects the strength or intensity of the relation.
edge thickness indicates the number of times that two causes of death are mentioned together in a death certificate. Because our network involves a single set of actors (the causes of death), we are dealing with a one-mode multiple cause of death network (MCOD network).
We selected the following indicators from those generally used to describe networks because they support measurements that are of relevance to cause of death interrelations:
ž the set of nodes (of sizeN), coincident with the selected causes of death;
ž the set of lines (of sizeL), representing relations among nodes or ties connecting nodes;
ž density (Χ) (as already mentioned) is the proportion of potential lines actually present in the network; a denser network indicates higher complexity of death processes, where multiple causes are mentioned in the same certificate;
ž average degree, expressing the average number of links per node – that is, the average number of relations involving a specific cause of death; and
ž number of isolate nodes: the number of nodes having no links to others – that is, causes of death that are not jointly mentioned with others.
It might also be of interest to look for clusters in the data – where a cluster is defined as a cohesive subset of nodes – as a means of partitioning nodes into subsets, within which node connections are dense (cohesive subset) but between which connections are sparse. The quality of the partition then relates to the presence or absence of edges joining pairs of nodes that fall into different clusters. In the case of a perfect partition, the frequency of external edges – that is, edges linking pairs of nodes that fall into different subsets – is null. Conversely, the partition becomes less perfect as the frequency of external edges moves away from zero. Borgatti’s γ (Freeman 2011) can be useful in this context; this index is based on the correlation between the observed pattern of edges linking nodes and a perfect partitioning, where γ varies between –1 and 1. A value of –1 indicates that no internal edges and all possible external edges are present; conversely, a value of 1 describes a perfect partition of the nodes. The index measures “the degree to which the observed partitioning approaches the ideal” (Freeman 2011).
ž Degree centrality (CD(ni))4 is the number of links connecting a nodeni to the
others. This is the simplest definition of node centrality in the sense that central nodes must be the most active because they have most ties to other nodes in the network. In our application, a node-cause’s degree centrality indicates the number of jointly mentioned causes of death (direct connection);
ž closeness centrality (CC(ni))5 is an alternative view of node centrality, based
on closeness or geodesic distance (length of the shortest path between a pair of nodes). This measure indicates how close a node is to all others in the set of nodes. In our application, a node-cause is ‘close’ to the others if it is reachable from another node (i.e., when there is a path linking the two nodes) and the concept of closeness can be translated as being connected directly and indirectly (via a short path) to other causes;
ž betweenness centrality (CB(ni))6 refers to the role of certain nodes in
connecting nonadjacent nodes. This measure is again based on geodesic distance and shows which nodes exert some control over interactions between two nonadjacent nodes. Interactions between two nonadjacent actors depend on these ‘nodes in the middle’ – that is, those between the others – which have some control over paths in the graph (generally called ‘gatekeeper’ nodes). A node is central, then, if it lies between other nodes on their geodesics; large betweenness centrality means that the node lies between many other nodes. In our application, a cause of death has large betweenness centrality if it is frequently mentioned along with causes that are not otherwise mentioned together, serving as a ‘bridge’ between different death processes.
To obtain values of closeness and betweenness centrality that were comparable across nodes and networks, we used the normalized indicators C’C(ni)7 and C’B(ni),8
which vary between 0 and 1. More specifically, C’C(ni) equals unity when the node is
adjacent to all other nodes – that is, when the node is maximally close to all others.
4 C
D(ni) =d(ni) =∑ = ∑ whered(ni) is the degree of the nodeni,xij is the tie linking the nodesni and
njand, vice versa,xji is the tie linking nodesnj andni.
5
C ( ) = ∑ d(n ; n ) whereN is the total number of nodes in the connected component to whichni
belongs andd(ni; nj) is the number of lines in the geodesic linking nodesni andnj.
6
C ( ) = ∑ ( )/ wheregjk(ni) is the number of shortest paths or geodesic distances between
nodesnj andnk that include the nodeni, andgik is the total number of shortest paths or geodesic distances
between nodesnj andnk (including or not including nodeni).
7
C′ ( ) =
∑ ( ; ) = ( − 1)C ( )
C’B(ni) equals unity when a node is a ‘gatekeeper’ for all other nodes (see Wasserman
and Faust 1994).
2.3 The raw adjacency matrix and its normalization
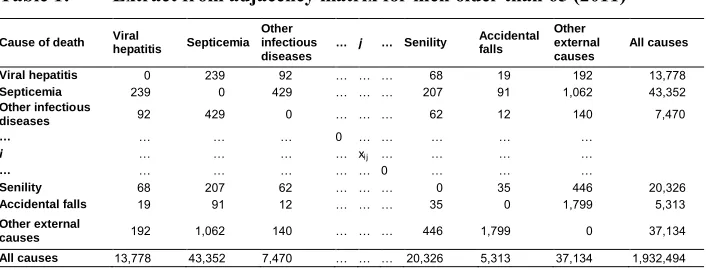
The basic information is arranged as a symmetric matrix, with a row and a column for each cause of deathi, where the generic cellxij expresses the joint frequency – that is, the number of times that cause i is jointly mentioned with cause j. As already mentioned, this is viewed as an adjacency matrix, and nodes linked by a joint frequency that differs from zero are said to be adjacent. In our application, two causes of death are adjacent if they are mentioned at least once in the same certificate. The values along the diagonal of the matrix (expressing the relations of nodes with themselves) are set to zero. Table 1 is an example of such a matrix.
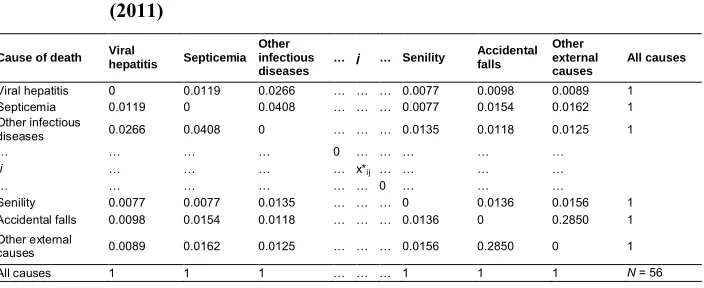
The observed data indicates a strong correlation between joint and marginal frequencies of causes – that is, the most frequent associations relate to the most common causes of death. To eliminate this confounding effect on relationships among causes, it was necessary to normalize the matrix by reducing all causes to the same marginal frequency. We normalized the original matrix by means of the iterative proportional fitting (IPF) method – a mathematical procedure in which the original values are gradually adjusted to simultaneously fit the desired row and column marginals sufficiently well (Wong 1992; Norman 1999). We adopted the constraint that all causes of death should have row and column marginal frequencies of 1. IPF maintains almost unchanged the relationships between causes and the symmetry of the matrix.
Table 1: Extract from adjacency matrix for men older than 65 (2011)
Cause of death Viral
hepatitis Septicemia
Other infectious diseases
… j … Senility Accidental
falls
Other external causes
All causes
Viral hepatitis 0 239 92 … … … 68 19 192 13,778
Septicemia 239 0 429 … … … 207 91 1,062 43,352
Other infectious
diseases 92 429 0 … … … 62 12 140 7,470
… … … … 0 … … … … …
i … … … … xij … … … …
… … … … 0 … … …
Senility 68 207 62 … … … 0 35 446 20,326
Accidental falls 19 91 12 … … … 35 0 1,799 5,313
Other external
causes 192 1,062 140 … … … 446 1,799 0 37,134
In the normalized matrix, the generic cell valuex*
ij expresses the joint frequency of
causesi andj as a proportion of the marginal value of the row and column, where all causes have a marginal frequency of 1 (Table 2).
Table 2: Extract from normalized adjacency matrix for men older than 65 (2011)
Cause of death Viral
hepatitis Septicemia
Other infectious diseases
… j … Senility Accidental
falls
Other external causes
All causes
Viral hepatitis 0 0.0119 0.0266 … … … 0.0077 0.0098 0.0089 1
Septicemia 0.0119 0 0.0408 … … … 0.0077 0.0154 0.0162 1
Other infectious
diseases 0.0266 0.0408 0 … … … 0.0135 0.0118 0.0125 1
… … … … 0 … … … … …
i … … … … x*ij … … … …
… … … 0 … … …
Senility 0.0077 0.0077 0.0135 … … … 0 0.0136 0.0156 1
Accidental falls 0.0098 0.0154 0.0118 … … … 0.0136 0 0.2850 1
Other external
causes 0.0089 0.0162 0.0125 … … … 0.0156 0.2850 0 1
All causes 1 1 1 … … … 1 1 1 N= 56
3. Results
3.1 The MCOD network
The MCOD network produces a high-density graph for men and women in which each cause is jointly mentioned with almost all other causes at least once, the average number of connections of each of the 56 nodes-cause reaches almost 55, and the density of the graph is 99.2% for both men (1,527 actual links from a possible 1,540) and women (1,528 actual links from a possible 1,540).
3.2 The MCOD network of strongest relationships: nodes-cause indicators
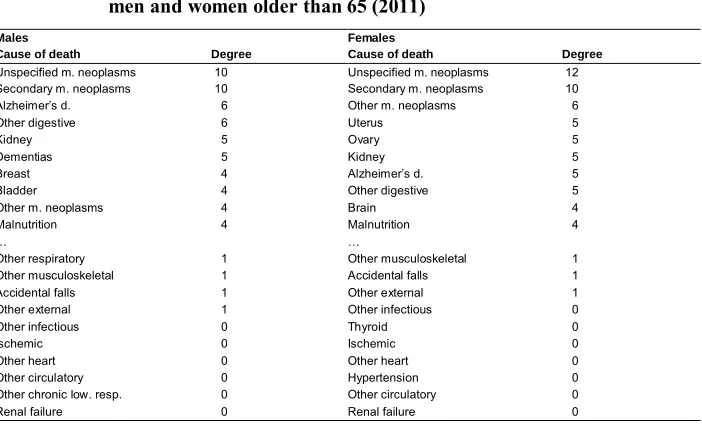
The most active nodes-cause are ‘Unspecified’ and ‘Secondary malignant neoplasms,’9
which have the largest value of degree centrality (10–12) for both men and women (Table 3). The following rankings show some slight differences. For women, malignant neoplasms (‘Uterus,’ ‘Ovary,’ ‘Kidney,’ and those in the residual category ‘Other malignant neoplasms’) have the highest degree; for men, certain non-neoplastic diseases (‘Alzheimer’s disease,’ ‘Other diseases of the digestive system,’ and ‘Dementias’) are more frequently mentioned with other causes.
At the bottom of the rankings are causes that have weak relationships with others. More specifically, these include six isolate nodes-cause for men and seven for women, most of which are diseases of the circulatory system: heart diseases (both ischemic and not) and ‘Other circulatory diseases’ (except ‘Cerebrovascular’ diseases connected to ‘Other nervous diseases’), as well as ‘Hypertension’ for women. Other isolate nodes-cause common to both genders are ‘Renal failure’ and the residual category ‘Other infectious and parasitic diseases.’ ‘Other chronic lower respiratory diseases’ are specific to men, and ‘Thyroid’ disorders are specific to women.
Table 3: Degree centrality of nodes-cause: First 10 and last 10 in rankings for men and women older than 65 (2011)
Males Females
Cause of death Degree Cause of death Degree
Unspecified m. neoplasms 10 Unspecified m. neoplasms 12
Secondary m. neoplasms 10 Secondary m. neoplasms 10
Alzheimer’s d. 6 Other m. neoplasms 6
Other digestive 6 Uterus 5
Kidney 5 Ovary 5
Dementias 5 Kidney 5
Breast 4 Alzheimer’s d. 5
Bladder 4 Other digestive 5
Other m. neoplasms 4 Brain 4
Malnutrition 4 Malnutrition 4
… …
Other respiratory 1 Other musculoskeletal 1
Other musculoskeletal 1 Accidental falls 1
Accidental falls 1 Other external 1
Other external 1 Other infectious 0
Other infectious 0 Thyroid 0
Ischemic 0 Ischemic 0
Other heart 0 Other heart 0
Other circulatory 0 Hypertension 0
Other chronic low. resp. 0 Other circulatory 0
Renal failure 0 Renal failure 0
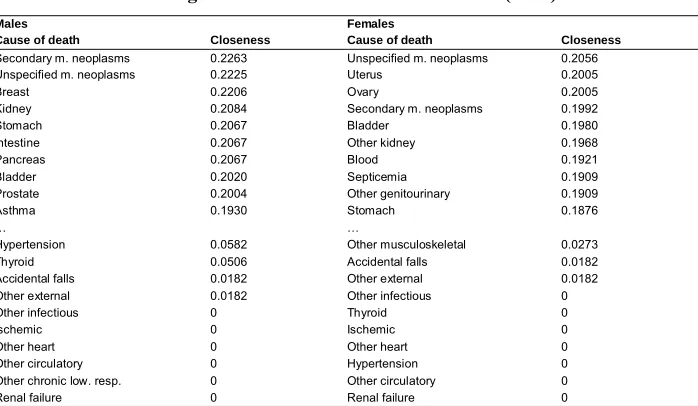
In relation to closeness centrality, the highest values are for malignant neoplasms and ‘Asthma’ among men; among women, some non-neoplastic diseases of the ‘Blood’ and of the genitourinary system (e.g., ‘Other kidney’ and ‘Other genitourinary’ diseases) play the same role, as does ‘Septicemia’ (Table 4).
Table 4: Normalized closeness centrality of nodes-cause: First 10 and last 10 in rankings for men and women older than 65 (2011)
Males Females
Cause of death Closeness Cause of death Closeness
Secondary m. neoplasms 0.2263 Unspecified m. neoplasms 0.2056
Unspecified m. neoplasms 0.2225 Uterus 0.2005
Breast 0.2206 Ovary 0.2005
Kidney 0.2084 Secondary m. neoplasms 0.1992
Stomach 0.2067 Bladder 0.1980
Intestine 0.2067 Other kidney 0.1968
Pancreas 0.2067 Blood 0.1921
Bladder 0.2020 Septicemia 0.1909
Prostate 0.2004 Other genitourinary 0.1909
Asthma 0.1930 Stomach 0.1876
… …
Hypertension 0.0582 Other musculoskeletal 0.0273
Thyroid 0.0506 Accidental falls 0.0182
Accidental falls 0.0182 Other external 0.0182
Other external 0.0182 Other infectious 0
Other infectious 0 Thyroid 0
Ischemic 0 Ischemic 0
Other heart 0 Other heart 0
Other circulatory 0 Hypertension 0
Other chronic low. resp. 0 Other circulatory 0
Renal failure 0 Renal failure 0
Table 5: Normalized betweenness centrality of nodes-cause: First 10 and last 10 in rankings for men and women older than 65 (2011)
Males Females
Cause of death Betweenness Cause of death Betweenness
Secondary m. neoplasms 0.1646 Septicemia 0.2618
Breast 0.1595 D. skin 0.2424
Other digestive 0.1549 Unspecified m. neoplasms 0.1784
Unspecified m. neoplasms 0.1420 Other kidney 0.1783
Asthma 0.1357 Alzheimer’s d. 0.1764
Other acute low. resp. 0.1258 Other genitourinary 0.1743
Kidney 0.0751 Haematopoietic 0.1085
Brain 0.0721 Blood 0.1059
Stomach 0.0707 Other acute low. resp. 0.1025
Other genitourinary 0.0574 Other digestive 0.0893
… …
Cerebrovascular 0 Other heart 0
Hypertension 0 Cerebrovascular 0
Other circulatory 0 Hypertension 0
Other chronic low. resp. 0 Other circulatory 0
Other respiratory 0 Asthma 0
Other musculoskeletal 0 Other respiratory 0
Renal failure 0 Other musculoskeletal 0
Other d. 0 Renal failure 0
Accidental falls 0 Accidental falls 0
Other external 0 Other external 0
3.3 MCOD networks: analytical and graphical comparison of the strongest relationships
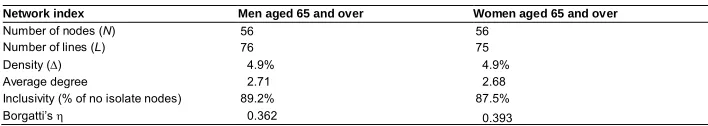
Table 6 synthesizes the structural characteristics of the MCOD networks, considering only the strongest relationships between causes of death. Looking at joint frequencies higher than the adopted threshold (4.3%), we observe 76 edges for men and 75 edges for women, with a density of 4.9% for both genders. The average degree is 2.7 – in other words, there are, on average, 2.7 incident edges (i.e., causes jointly mentioned) per node-cause for both men and women. While there is no difference in the number of nodes-cause, a slightly higher value of inclusivity for men is validated by the lower value of Borgatti’sγ. For both men and women, the values of this index show a very low positive correlation between the observed pattern of edges and perfect partitioning. Despite a slightly higher value of Borgatti’s γ for women, the partition appears substantially similar for males and females.
Table 6: Comparison of the two MCOD networks describing the strongest links (> 95th percentile) between causes of death in men and women
older than 65 (2011)
Network index Men aged 65 and over Women aged 65 and over
Number of nodes (N) 56 56
Number of lines (L) 76 75
Density (Χ) 4.9% 4.9%
Average degree 2.71 2.68
Inclusivity (% of no isolate nodes) 89.2% 87.5%
Borgatti’sγ 0.362 0.393
The graphs in Figures 1 and 2 show the strongest relationships between causes of death in men and women aged 65 and over; nodes-cause are color-coded by group based on the 15 chapters of the ICD-10 classification (see Table A-1 in the Appendix). The thickness of edges connecting nodes-cause is proportional to the values of the corresponding joint frequencies in the analyzed death certificates.
Figures 1 and 2 clearly show why neoplasms (blue) have the highest centrality indicator values for both men and women. These constitute a highly connected subgraph, indicating that when a neoplasm is mentioned in a death certificate, other mentions in the same certificate are generally neoplasms. Among these, ‘Unspecified’ and ‘Secondary’ neoplasms play a highly active role in the network, with lines (joint mentions) connecting them to almost all other cancers. Some neoplasms that are localized in specific organs connect this group with diseases affecting the same organ – for example, the malignant ‘Brain’ neoplasm is frequently mentioned in conjunction with ‘Epilepsia’ and the residual category ‘Other diseases of the nervous system.’ Similarly, the malignant ‘Bladder’ neoplasm is connected to ‘Other diseases of kidney,’ which are in turn connected to malignant ‘Prostate’ and ‘Breast’ neoplasms in men, and to malignant ‘Ovary’ and ‘Uterus’ neoplasms in women.
Malignant ‘Pancreas,’ ‘Intestine,’ and (in men) ‘Stomach’ neoplasms connect cancers to diseases of the digestive system, and the malignant ‘Lung’ neoplasm is connected to ‘Other diseases of the respiratory system,’ malignant neoplasm of ‘Liver’ to ‘Viral hepatitis,’ ‘Chronic liver disease,’ and ‘Other diseases of the digestive system.’ The final group includes ‘Benign neoplasms’ and malignant neoplasms localized in the lymphatic system and ‘Haematopoietic’ tissue; in men, both are connected to diseases of the ‘Blood.’
system and the residual group ‘Other diseases’ differs between the genders, in part because of physiological differences. For men, this includes ‘Hyperplasia of prostate’ and ‘Thyroid’ disorders, connecting with the subgraph of ‘Obesity’ and ‘Diabetes’ mellitus. For women, there is no evident connection between the two subgraphs; rather, the ‘Obesity’ subgraph is connected to mental and nervous diseases through certain diseases of the respiratory system.
For both men and women, the final group in Figures 1 and 2 is a dyad formed by two external causes that are frequently mentioned together in older people’s death certificates: ‘Accidental falls’ and ‘Other external causes’ (mainly due to unspecified factors causing fractures or events of undetermined intent).
Within some subgraphs, very thick edges indicate strong relationships between pairs or groups of causes. For both genders, this is the case for edges linking malignant neoplasms of ‘Liver,’ ‘Viral hepatitis,’ and ‘Chronic liver disease’; malignant neoplasms of ‘Lung’ and ‘Pancreas’ to ‘Secondary malignant neoplasms’; malignant ‘Brain’ neoplasm to ‘Epilepsia’ and ‘Other diseases of the nervous system’; and the edge connecting ‘Accidental falls’ and ‘Other external’ causes. For women, equally strong relations can be observed between malignant ‘Ovary’ neoplasms and ‘Secondary malignant neoplasms’; malignant ‘Kidney’ and ‘Bladder’ neoplasms; and malignant neoplasms of ‘Bladder’ and ‘Uterus’ and ‘Other diseases of kidney’ and ureter.
Figure 1: Graph of the strongest links between causes of death (> 95th
percentile) for men older than 65 (Italy, 2011)
Figure 2: Graph of the strongest links between causes of death (> 95th
4. Discussion and conclusion
To analyze relationships between causes of death among Italians aged 65 and over, we adopted a social network approach as a means of revealing the complex relations linking diseases or disorders reported on death certificates. The analysis confirmed that the system as a whole is very dense, in the sense that each cause of death is jointly mentioned with each of the others at least once. However, as expressed by frequency of joint mention, the strength of relationships is generally very low. The paper focuses on associations with normalized frequencies higher than 4.3% after controlling for the confounding effects of differing prevalence of causes.
The method helped to identify the particular roles played by certain causes. Some of these are mentioned very frequently in conjunction with others; some are very close to others in the sense of sharing many direct and indirect connections; some occur in different pathological patterns (homogeneous or otherwise), serving as a bridge between different death processes. For example, some diseases of the genitourinary or digestive system and some chronic or acute respiratory diseases act mainly as complications of the main process.
Additionally, the method identified subgroups of causes, within which cross-references have higher frequencies while mentions external to the group are rare. This is the case for neoplasms, which constitute a very connected subsystem in which cross-references between different sites are very frequent and extremely high when there is mention of ‘Secondary’ and ‘Unspecified’ malignant neoplasms. Within this subsystem, some cancer localization is jointly mentioned with non-neoplastic diseases affecting the same organ. These results confirm many of the associations already identified for France and Italy by Désesquelles et al. (2012); using a different approach, they also offered explanations for some of the observed associations. Here, framed by the complex web of relationships that link cancers to each other and to other diseases, the observed associations provide a clearer picture of the characteristics of processes where neoplasm is mentioned among the certified causes of death.
The same can be said of mental disorders and diseases of the nervous system, which form a very dense subsystem with their consequences. Looking at this group, the process of physical deterioration accompanying mental and nervous diseases is evident in “difficulties in swallowing and eating causing nutritional deficiencies, regurgitation and pneumonitis, immobility resulting in bedsores” (Désesquelles et al. 2014: 296). These clearly relate to the diseases and conditions mentioned by physicians in death certificates and are equally well represented in the MCOD network graph.
women of the category ‘chronic liver diseases’ in this age group), and neoplasm of the liver (Perz et al. 2006; El-Serag 2012). This is especially the case in countries (like Italy) that have no tradition of alcohol abuse (WHO Global Information System on Alcohol and Health).
The link between obesity and diabetes – especially type 2 diabetes – is also clearly confirmed by the literature (Leong and Wilding 1999; Mokdad et al. 2003). According to Ahmad (2016), the two are ‘kith and kin,’ both because they are biologically related and because obesity plays a major role in diabetes onset. Their combined effect causes multiple complications, including cardiovascular diseases; the strong association with hypertensive diseases in older men is a clear consequence. In women, the strong association with chronic respiratory diseases, including asthma, reflects the association identified in the literature between obesity and chronic respiratory dysfunction (Littleton 2012). This relationship has been widely studied, and the interaction between Body Mass Index (BMI) and asthma has proved to be stronger in women than in men, probably due to increased levels of female sex hormones in obese women (Poulain 2006). Other associations with obesity are also of interest, including the link with rheumatoid arthritis and osteoarthrosis (‘Arthritis’ on the graph) in men, linking the ‘Obesity’ subgroup with that centered on ‘Arthritis.’ Obesity is an established risk factor for arthritis onset (Mehrotra, Chudy, and Thomas 2003) and worst outcomes (Ajeganova, Andersson, and Hafström 2013). The relation is partly accounted for by physical inactivity, which is in turn a consequence of both obesity and arthritis. However, other unknown mechanisms may also play a role, owing mainly to the chronic inflammatory processes caused by obesity (Crowson et al. 2013). At the same time, a similar underlying etiology justifies the proposed association between rheumatoid ‘Arthritis’ and ‘Hyperplasia of prostate’ among elderly men (Tzeng et al. 2015), and thyroid hormones (mainly triiodothyronine or T3) are responsible for the association between ‘Hyperplasia of prostate’ and ‘Thyroid’ disorders (Gupta et al. 2006; Eldhose et al. 2016).
For many cardiovascular diseases, which are widely diffused in death processes but indiscriminately associated with other causes, their particular nature is clearly visible in results. Along with other diseases of the circulatory system, ischemic and nonischemic heart diseases are the main causes of death for elderly people in Italy, but in mortality processes they describe patterns in which other causes do not play a specific role. The only exceptions are cerebrovascular diseases, which are associated with diseases of the nervous system and, in men, hypertensive diseases associated with obesity.
The social network approach has proved effective in illuminating the complexity of relationships between causes of death when compared to more traditional statistical approaches, such as those assessing the relationships between variables by comparing cause-of-death profiles in different groups of units (Frova et al. 2009). In the present case, this assertion was further supported by applying Latent Class Analysis (LCA) (Lazarsfeld and Henry 1968) to the same data. Using ten starting values and the BIC (Schwarz 1978) and ICL (Biernacki, Celeux, and Govaert 2000) as criteria to determine the number of classes, we obtained a solution entailing 25 latent classes for both males and females. However, as the substantial computational burden prevented us from using more than ten different starting values, therefore the obtained solutions may well correspond to local optima. Interpretation of the classes was difficult because of high internal heterogeneity values (measured by an entropy index), with distinct cause-of-death profiles allocated to the same class. We were far from a situation of a satisfactory latent class separation occurring when each variable is strongly associated only with a given set of classes, so that a group of classes is characterized by a specific set of variables. This was a consequence of the high dimension and sparseness of the data, which required a higher number of classes. However, we were unable to increase the number of estimated classes because model parameter estimation was highly demanding in terms of computing time. As we said before, our use of ten different starting points to avoid local maxima or spurious solutions may not be considered completely satisfactory. As a single replication of a latent class model with 30 classes takes about 580 minutes (male data), a higher number of replications would have exceeded the available computing time.
Where data is extremely sparse, as in the present empirical application, SNA’s direct focus on relationships between causes of death allows immediate selection of the strongest associations, and this provided us with clearer results.
recognized and coded so that the underlying cause can be identified by uniform application of WHO rules. In this way, coder arbitrariness is eliminated, ensuring that all causes reported in the death certificate are coded to the same standard, significantly enhancing the general quality of coding and identification of underlying causes.
Certification problems are more complex; while some relate to the certification process as a whole (involving both underlying and contributing causes), others relate specifically to contributing causes. According to WHO rules, the certifying physician must report the diseases or conditions leading directly to death (Part I of the certificate), as well as any other significant condition that unfavorably influenced the course of morbidity although unrelated to the condition directly causing death (Part II). A number of factors may affect data accuracy during this phase. First of all, there are problems that relate to the state of current medical knowledge, as well as to the incomplete knowledge of the certifying physician regarding the particular process leading to death. Inadequate training of physicians in relation to the relevance of certification may lead to inaccurate reporting even when the death process, its complications, and other diseases eventually affecting the outcome are correctly identified.
All of these sources of error may be cause-dependent and clearly affect cause-of-death statistics, but they are not specific to MCOD studies. Conversely, errors may be reduced by adopting the MCOD approach, facilitating identification of the underlying cause even in cases of inaccurate certification. We cannot rule out the possible effect of certification and coding errors on some of the results presented here, and we have no way of directly assessing their impact. However, as the associations obtained using cause-of-death data align well with the findings of medical and epidemiological studies (generally based on data about incidence or prevalence of diseases), there are grounds for optimism about the reliability of our results. The present focus on the most frequent jointly mentioned causes of death also makes these findings less sensitive to slight distortions. Désesquelles et al. (2010, 2012) present a thorough discussion of certification and coding errors affecting Italian multicause mortality data and their possible impact on multicause mortality rates and relationships between causes. Additionally, Désesquelles et al. (2010, 2014, 2015) address specific causes of death, dealing respectively with cancer, Alzheimer’s disease, and infectious diseases. In light of existing evidence that Italian MCOD data is of relatively high quality, we have confidence in the reliability of our results. Moreover, we are convinced that more intensive use of mortality data may further enhance quality by increasing awareness of these issues among all those involved in data collection and treatment.
Increased care among certifying physicians and new causes of death codification tools support better understanding of the complex risk patterns associated with causes of death at older ages. A second positive outcome of this study relates to method. Although applied in a nonstandard field, SNA has proved powerful as a means of identifying relationships between causes of death. These concepts and instruments have made it possible to identify causes that play an important role in the death process and in mortality patterns involving multiple interacting causes. While still operating on relationships linking paired causes of death, the method proved effective in highlighting complex structures described by subgroups of diseases, disorders, and conditions that should inform health policies in seeking to improve the health status of elderly people and further reduce mortality risks.
5. Acknowledgements
References
Ahmad, S.I. (2016). Obesity and diabetes. In: Ahmad, S.I. and Imam, S.K. (eds.).
Obesity: A practical guide. Cham: Springer International: 117–130.
doi:10.1007/978-3-319-19821-7_9.
Ajeganova, S., Andersson, M.L., and Hafström, I. (2013). Association of obesity with worse disease severity in rheumatoid arthritis as well as with comorbidities: A long-term followup from disease onset. Arthritis Care and Research 65(1): 78– 87.doi:10.1002/acr.21710.
Biernacki, C., Celeux, G., and Govaert, G. (2000). Assessing a mixture model for clustering with the integrated classification likelihood. IEEE Transactions on
Pattern Analysis and Machine Intelligence 22(7): 719–725. doi:10.1109/34.
865189.
Coste, J. and Jougla, E. (1994). Mortality from rheumatoid arthritis in France, 1970– 1990. International Journal of Epidemiology 23(3): 545–552. doi:10.1093/ije/ 23.3.545.
Crowson, C.S., Matteson, E.L., Davis, J.M., and Gabriel, S.E. (2013). Contribution of obesity to the rise of rheumatoid arthritis. Arthritis Care and Research 65(1): 71–77.doi:10.1002/acr.21660.
Désesquelles, A.F. and Meslé, F. (2004). Intérêt de l’analyse des causes multiples dans l’étude de la mortalité aux grands âges: L’exemple français.Cahiers Québécois
de Démographie33(1): 83–116.doi:10.7202/010853ar.
Désesquelles, A.F., Demuru, E., Salvatore, M.A., Pappagallo, M., Frova, L., Meslé, F., and Egidi, V. (2014). Mortality from Alzheimer’s disease, Parkinson’s disease, and dementias in France and Italy: A comparison using the multiple cause-of-death approach. Journal of Aging and Health 26(2): 283–315. doi:10.1177/ 0898264313514443.
Désesquelles, A.F., Demuru, E., Pappagallo, M., Frova, L., Meslé, F., and Egidi, V. (2015). After the epidemiologic transition: A reassessment of mortality from infectious diseases among over-65s in France and Italy.International Journal of
Public Health 60(8): 961–967.doi:10.1007/s00038-015-0704-9.
Désesquelles, A.F., Salvatore, M.A., Frova, L., Pace, M., Pappagallo, M., Meslé, F., and Egidi, V. (2010). Revisiting the mortality of France and Italy with the multiple-cause-of-death approach. Demographic Research 23(28): 771–806.
Désesquelles, A.F., Salvatore, M.A., Pappagallo, M., Frova, L., Pace, M., Meslé, F., and Egidi, V. (2012). Analysing multiple causes of death: Which methods for which data? An application to the cancer-related mortality in France and Italy.
European Journal of Population 28(4): 467–498.doi:10.1007/s10680-012-927
2-3.
Dorn, H.F. and Moriyama, I.M. (1964). Uses and significance of multiple cause tabulations for mortality statistics. American Journal of Public Health 54(3): 400–406.doi:10.2105/AJPH.54.3.400.
Eldhose, A., Nandeesha, H., Dorairajan, L.N., Sreenivasulu, K., and Vani, A.V. (2016). Thyroid and parathyroid hormones in benign prostatis hyperplasia. British
Journal of Biomedical Science 28: 1–3.
El-Serag, H.B. (2012). Epidemiology of viral hepatitis and hepatocellular carcinoma.
Gastroenterology142: 1264–1273.doi:10.1053/j.gastro.2011.12.061.
Eurostat (2012). European short list for causes of death [electronic resource]. Luxemburg: Eurostat. http://ec.europa.eu/eurostat/ramon/nomenclatures/index. cfm?TargetUrl=LST_NOM_DTL&StrNom=COD_2012&StrLanguageCode=E N&IntPcKey=&StrLayoutCode=HIERARCHIC.
Freeman, L.C. (2011). A well-behaved alternative to the modularity index [electronic resource]. Irvine: University of California, Irvine. http://moreno.ss.uci.edu/ 92.pdf.
Frova, L., Salvatore, M.A., Pappagallo, M., and Egidi, V. (2009). The multiple cause of death approach to analyse mortality patterns.Genus65(1): 1–21.
Fuhrman, C., Jougla, E., Nicolau, J., Eilstein, D., and Delmas, M.C. (2006). Deaths from chronic obstructive pulmonary disease in France, 1979–2002: A multiple-cause analysis.Thorax61(11): 930–934.doi:10.1136/thx.2006.061267.
Gupta, A., Gupta, S., Pavuk, M., and Roehrbom, C.G. (2006). Anthropometric and metabolic factors and risk of benign prostatic hyperplasia: A prospective study of Air Force veterans. Urology 68(6): 1198–1205. doi:10.1016/j.urology.2006. 09.034.
ISTAT (2004). Applying ACS to causes of death statistics in Italy: Some clues on implementation, bridge coding and further steps. Rome: ISTAT (Essays 13). Janssen, T.A. (1940). Importance of tabulating multiple causes of death. American
Lazarsfeld, P. and Henry, N. (1968). Latent structure analysis. Boston: Houghton Mifflin Harcourt.
Leong, K.S. and Wilding, J.P. (1999). Obesity and diabetes. Best Practice and
Research: Clinical Endocrinology and Metabolism 13(2): 221–237.doi:10.1053/
beem.1999.0017.
Littleton, S.W. (2012). Impact of obesity on respiratory function. Respirology 17(1): 43–49.doi:10.1111/j.1440-1843.2011.02096.x.
Mackenbach, J.P., Kunst, A., Lautenbach, H., Bijlsma, F., and Oei, Y.B. (1995). Competing causes of death: An analysis using multiple-cause-of-death data from the Netherlands. American Journal of Epidemiology 141(5): 466–475.
doi:10.1093/oxfordjournals.aje.a117449.
Manton, K.G. (1986). Cause specific mortality patterns among the oldest old: Multiple cause of death trends 1968 to 1980. Journal of Gerontology 41(2): 282–289.
doi:10.1093/geronj/41.2.282.
Manton, K.G. and Myers, G.C (1987). Recent trends in multiple-caused mortality 1968 to 1992: Age and cohort components.Population Research and Policy Review6: 161–176.doi:10.1007/BF00149207.
Manton, K.G. and Stallard, E. (1982). Temporal trends in U.S. multiple cause of death mortality data: 1968 to 1977. Demography 19(4): 527–547. doi:10.2307/2061 017.
Mehrotra, C., Chudy, N., and Thomas, V. (2003). Obesity and physical inactivity among Wisconsin adults with arthritis.Wisconsin Medical Journal 102(7): 24– 28.
Mokdad, A.H., Ford, E.S., Bowman, B.A., Dietz W.H., Vinicor, F., Bales, V.S., and Marks, J.S. (2003). Prevalence of obesity, diabetes, and obesity-related health risk factors, 2001.JAMA 289(1): 76–79.doi:10.1001/jama.289.1.76.
Nizard, A. and Munoz-Pérez, F. (1993). Alcool, tabac et mortalité en France depuis 1950: Essai d’évaluation des décès dus à la consommation d’alcool et de tabac en 1986.Population 48(3): 571–607.doi:10.2307/1534096.
Perz, J.F., Armstrong, G.L., Farrington, L.A., Hutin Y.J.F., and Bell, B.P. (2006). The contributions of Hepatitis B virus and Hepatitis C virus infections to cirrhosis and primary liver cancer worldwide. Journal of Hepatology 45(4): 529–538.
doi:10.1016/j.jhep.2006.05.013.
Poulain, M., Doucet, M., Major G.C., Drapeau, V., Sériès, F., Boulet, L.F., Tremblay, A., and Maltais, F. (2006). The effect of obesity on chronic respiratory diseases: Pathophysiology and therapeutic strategies.CMAJ 174(9): 1293–1299.doi:10.15 03/cmaj.051299.
Redelings, M.D., Sorvillo, F., and Simon, P. (2006). A comparison of underlying cause and multiple causes of death: US vital statistics, 2000–2001. Epidemiology
17(1): 100–103.doi:10.1097/01.ede.0000187177.96138.c6.
Redelings, M.D., Wise, M., and Sorvillo, F. (2007). Using multiple cause-of-death data to investigate associations and causality between conditions listed on the death certificate. American Journal of Epidemiology 166(1): 104–108. doi:10.1093/ aje/kwm037.
Rivellini, G. (2006).Network analysis: From theory to applications. Paper presented at Atti della XLIII Riunione Scientifica della SIS, Turin, Italy, July 14–16, 2006. Rivellini, G., Rizzi, E., and Zaccarin, S. (2006). The science network in Italian
population research: An analysis according to the social network perspective.
Scientometrics 67(3): 407–418.doi:10.1556/Scient.67.2006.3.5.
Romon, I., Jougla, E., Balkau, B., and Fagot Campagna, A. (2008). The burden of diabetes-related mortality in France in 2002: An analysis using both underlying and multiple causes of death. European Journal of Epidemiology 23(5): 327– 334.doi:10.1007/s10654-008-9235-5.
Schwarz, G. (1978). Estimating the dimension of a model. Annals of Statistics 6(2): 461–464.doi:10.1214/aos/1176344136.
Stallard, E. (2002). Underlying and multiple cause mortality at advanced ages: United States 1980–1998.North American Actuarial Journal6(3): 64–87.doi:10.1080/ 10920277.2002.11073999.
Wasserman, S. and Faust, K. (1994). Social network analysis: Methods and
applications. New York: Cambridge University Press. doi:10.1017/CBO978
0511815478.
Wing, S. and Manton, K.G. (1981). A multiple cause of death analysis of hypertension-related mortality in North Carolina, 1968–1977. American Journal of Public
Health71(8): 823–830.doi:10.2105/AJPH.71.8.823.
Wise, M.E. and Sorvillo, F. (2005). Hepatitis A-related mortality in California, 1989– 2000: Analysis of multiple-coded death data.American Journal of Public Health
95(5): 900–905.doi:10.2105/AJPH.2003.035485.
Wong, D.V.S. (1992). The reliability of using the iterative proportional fitting procedure. Professional Geographer 44(3): 340–348. doi:10.1111/j.0033-0124. 1992.00340.x.
Appendix
Table A-1: List of selected causes of death
Group # Abbreviation Groups and subgroups ICD-10 code
1 Infectious and parasitic diseases
Viral hepatitis Viral hepatitis B15-B19, B94.2
Septicemia Septicemia A40-A41
Other infectious Other infectious and parasitic diseases (A00-B99) excluding Supra codes
2 Neoplasms
Lip, oral, pharynx Malignant neoplasm of lip, oral cavity, pharynx C00-C14
Stomach Malignant neoplasm of stomach C16
Intestine Malignant neoplasm of small intestine, colon, rectum,and anus, and other/ill-defined digestive organs C17-C21, C26
Liver Malignant neoplasm of liver, intrahepatic bile ducts,gallbladder, and other unspecified parts of biliary tract C22-C24
Pancreas Malignant neoplasm of pancreas C25
Lung Malignant neoplasm of larynx andtrachea/bronchus/lung C32-C34
Breast Malignant neoplasm of breast C50
Uterus Malignant neoplasm of cervix uteri and other parts ofuterus C53-C55
Ovary Malignant neoplasm of ovary C56
Prostate Malignant neoplasm of prostate C61
Kidney Malignant neoplasm of kidney C64
Bladder Malignant neoplasm of bladder C67
Haematopoietic Malignant neoplasm of lymph/haematopoietic tissue C81-C96
Brain Malignant neoplasm of eye, brain, and other parts ofcentral nervous system C69-C72
Secondary m. neoplasm Secondary malignant neoplasm C77-C79
Unspecified m. neoplasm Malignant neoplasm of ill-defined/unspecified/independent (primary) multiple sites C76, C80, C97
Other m. neoplasm Other malignant neoplasms (C00-C99) excluding Supra codes
Benign neoplasms Benign neoplasms, in situ neoplasms, and neoplasmsof uncertain or unknown behaviour D00-D09, D10-D36, D37-D48
3 Blood Diseases of the blood(-forming organs), immunol.disorders D50-D89
4 Endocrine, nutritional, and metabolic diseases
Diabetes Diabetes mellitus E10-E14
Malnutrition Malnutrition and other nutritional deficiencies E40-E64
Obesity Obesity E65-E68
Thyroid Disorders of thyroid gland E00-E07
Other endocrine Other endocrine, nutritional, and metabolic diseases (E00-E90) excluding Supra codes
5 Mental and behavioral disorders
Dementias Dementias (excluding Alzheimer’s) F01, F03, G31.0, G31.1, G31.8,
G31.9
Other mental Other mental and behavioral disorders
Table A-1: (Continued)
Group # Abbreviation Groups and subgroups ICD-10 code
6 Diseases of the nervous system
Epilepsia Epilepsia G40-G41
Alzheimer’s d. Alzheimer’s disease G30
Parkinson’s d. Parkinson’s disease G20, G21
Other nervous Other diseases of the nervous system (G00-G98) excluding (G31.0, G31.1G31.8, G31.9, G31.2, and Supra codes)
7 Diseases of the circulatory system
Ischemic Ischemic heart diseases I20-I25
Other heart Other heart diseases I30-I33, I39-I45, I47-I48, I49.1-I52,I00-I09
Cerebrovascular Cerebrovascular diseases I60-I69
Hypertension Hypertensive diseases I10-I15
Other circulatory Other diseases of the circulatory system (I00-I99) excluding (I46, I49.0,I95.9, I99, and Supra codes)
8 Diseases of the respiratory system
Pneumonia Pneumonia J12-J18
Other acute low. resp. Other acute lower respiratory diseases J00-J09, J19-J22
Asthma Asthma J45-J46
Other chronic low. resp. Other chronic lower respiratory diseases J40-J44
Lung d. Lung diseases due to external agents J60-J70
Other respiratory Other diseases of the respiratory system (J00-J99) excluding (J96.0, J96.9,
and Supra codes)
9 Diseases of the digestive system
Ulcer Ulcer of stomach, duodenum, and jejunum K25-K28
Chronic liver d. Chronic liver disease K70, K73-K74
Other digestive Other diseases of the digestive system (K00-K93) excluding Supra codes
10 Skin diseases Diseases of the skin and subcutaneous tissue L00-L99
11 Diseases of the musculoskeletal system/connectivetissue
Arthritis Rheumatoid arthritis and osteoarthrosis M05-M06, M15-M19
Other musculoskeletal Other diseases of the musculoskeletalsystem/connective tissue (M00-M99) excluding Supra codes
12 Diseases of the genitourinary system
Renal failure Renal failure N17-N19
Other kidney Other diseases of kidney and ureter N00-N16
Hyperpl. prost. Hyperplasia of prostate N40
Other genitourinary Other diseases of the genitourinary system (N00-N99) excluding Supra codes
13 Other d.
Other diseases (including: complications of pregnancy, childbirth and puerperium; certain conditions originating in the perinatal period; congenital malformations and chromosomal abnormalities; diseases of the eye and adnexia; diseases of the ear and mastoid process; and SIDS)
O00-O99, (P00-P96) excluding P28.5, Q00-Q99, H00-H59, H60-H95, R95
14 Other symptoms, signs, abnormal findings,ill-defined causes °
Table A-1: (Continued)
Group # Abbreviation Groups and subgroups ICD-10 code
15 External cause
Accidental falls Accidental falls W00-W19
Other external Other external causes
(S, T, V, W, X, Y, F10.0, F11.0, F12.0, F13.0, F14.0, F15.0, F16.0,F17.0, F18.0, F19.0) excluding Supra codes