R E S E A R C H A R T I C L E
Open Access
The UKCAT-12 study: educational attainment,
aptitude test performance, demographic and
socio-economic contextual factors as predictors
of first year outcome in a cross-sectional
collaborative study of 12 UK medical schools
I C McManus
1,2*, Chris Dewberry
3, Sandra Nicholson
4and Jonathan S Dowell
5Abstract
Background:Most UK medical schools use aptitude tests during student selection, but large-scale studies of predictive validity are rare. This study assesses the United Kingdom Clinical Aptitude Test (UKCAT), and its four sub-scales, along with measures of educational attainment, individual and contextual socio-economic background factors, as predictors of performance in the first year of medical school training.
Methods:A prospective study of 4,811 students in 12 UK medical schools taking the UKCAT from 2006 to 2008 as a part of the medical school application, for whom first year medical school examination results were available in 2008 to 2010.
Results:UKCAT scores and educational attainment measures (General Certificate of Education (GCE): A-levels, and so on; or Scottish Qualifications Authority (SQA): Scottish Highers, and so on) were significant predictors of outcome. UKCAT predicted outcome better in female students than male students, and better in mature than non-mature students. Incremental validity of UKCAT taking educational attainment into account was significant, but small. Medical school performance was also affected by sex (male students performing less well), ethnicity (non-White students performing less well), and a contextual measure of secondary schooling, students from secondary schools with greater average attainment at A-level (irrespective of public or private sector) performing less well. Multilevel modeling showed no differences between medical schools in predictive ability of the various measures. UKCAT sub-scales predicted similarly, except that Verbal Reasoning correlated positively with
performance on Theory examinations, but negatively with Skills assessments.
(Continued on next page)
* Correspondence:[email protected]
1UCL Medical School, University College London, Gower Street, London WC1E 6BT, UK
2Research Department of Clinical, Educational and Health Psychology, Division of Psychology and Language Sciences, University College London, Gower Street, London WC1E 6BT, UK
Full list of author information is available at the end of the article
© McManus et al.; licensee BioMed Central Ltd. This is an open access article distributed under the terms of the Creative Commons Attribution License (http://creativecommons.org/licenses/by/2.0), which permits unrestricted use, distribution, and reproduction in any medium, provided the original work is properly cited.
McManuset al. BMC Medicine
(Continued from previous page)
Conclusions:This collaborative study in 12 medical schools shows the power of large-scale studies of medical education for answering previously unanswerable but important questions about medical student selection, education and training. UKCAT has predictive validity as a predictor of medical school outcome, particularly in mature applicants to medical school. UKCAT offers small but significant incremental validity which is operationally valuable where medical schools are making selection decisions based on incomplete measures of educational attainment. The study confirms the validity of using all the existing measures of educational attainment in full at the time of selection decision-making. Contextual measures provide little additional predictive value, except that students from high attaining secondary schools perform less well, an effect previously shown for UK universities in general.
Keywords:Medical student selection, Educational attainment, Aptitude tests, UKCAT, Socio-economic factors, Contextual measures
Background
For many years the primary criterion used to select med-ical school applicants world-wide has been measures of educational attainment. In the UK, General Certificate of Education (GCE) A-levels, for those educated in England, Wales and Northern Ireland, and Scottish Quali-fications Authority (SQA) Highers for most of those ed-ucated in Scotland, have been the norm. A-levels have been shown to be valid predictors of outcome, both during the medical course [1] and later in medical careers [2], and for university education in general [3], and more generally in Europe, secondary school grades are predictive of university performance [4]. Educational at-tainment is also important in medical student selection in many countries, such as Australia, Denmark, Iran, The Netherlands [5], New Zealand and Thailand [6]. However, in recent years the continued reliance on such attainment measures as the sole or principal basis for medical student selection has been questioned for three reasons. First, A-levels and Scottish Highers, which are typically taken in the final year of secondary school, have over the past two decades shown continual increases in grades attained (so-called,‘grade inflation’). The result is that a large proportion of UK applicants to medical schools now achieve the highest grades (a ceiling effect), so that discriminating between them for the purpose of selection is increasingly problematic. Second, selection on the basis of A-level and Scottish Higher grades may be construed as unfair, because students who have attended selective schools, including independent sec-ondary schools charging high fees, tend to obtain higher grades than others, although this in part may reflect dif-ferent intake profiles. Third, there are concerns that aca-demic assessment alone may not necessarily select the candidates that possess the behavioral or non-cognitive attributes thought desirable in medical students and doctors. As a consequence, able but economically or so-cially disadvantaged children attending comprehensive secondary schools might be less likely to obtain a place
at medical school than students of equal ability attend-ing selective or private sector secondary schools. Arisattend-ing from such concerns has also been a growing awareness of the paucity of large-scale, longitudinal studies which have examined performance in medical school in rela-tion to a wide range of measures collected during selec-tion. Without such studies it is difficult to assess the validity and defensibility of the processes currently used to select medical students.
In response to these challenges, most UK medical schools in recent years have used aptitude tests as a sup-plementary selection technique. An aptitude test usually consists of a series of multiple choice sub-tests. Sub-tests are developed to assess specific aptitudes thought to be relevant for performance at medical school (for example, numerical ability and verbal ability). Unlike secondary school examinations, which measure attain-ment in relation to a particular discipline (for example, chemistry), aptitude tests are specifically designed to measure intellectual and behavioral capacity, and the po-tential to perform well in a particular role. Furthermore, aptitude tests offer considerable operational advantages: they can be taken in standardized settings by anyone, whatever their cultural or educational background, at geographical locations all over the world; they can assess people against items for which the difficulty level has been pre-established; they can be completed in a short time (typically less than three hours); and candidates’ performance on the test can be computed immediately. Although aptitude tests are used in medical selection in many countries including Australia [7], Chile [8], Germany [9,10], Pakistan [11], Italy [12], Mexico [13], Switzerland [14], the United States [15,16] and the UK [17,18], research on the extent to which they successfully predict medical performance is patchy. Given the high-stakes nature of medical selection it is clearly important to establish the predictive validity of aptitude tests, and the extent to which they add value to more traditional approaches to selection, such as previous educational
McManuset al. BMC Medicine 2013, 11:244 Page 2 of 25
attainment, using datasets large enough to provide sub-stantial statistical power. Here we report the results of the first large-scale analysis of the predictive and incre-mental validity of UK Clinical Aptitude Test (UKCAT), the aptitude test used in the selection of medical stu-dents in most UK medical schools.
Aptitude tests can be used as a stand-alone selection device or, more typically, to supplement the existing in-formation on which selection decisions are made, such as a candidate’s secondary school attainment, Univer-sities and Colleges Admissions Service (UCAS) personal statements and medical school interview performance. Because these tests can be specifically designed to differ-entiate between highly able candidates, and to do so in relation to the particular characteristics required in the medical profession, they can potentially discriminate ap-propriately between those with equally good attainment at A Level and Scottish Highers. In addition, by measur-ing the extent to which candidates’ possess aptitudes relevant to the medical profession, rather than their level of school-related educational attainment, aptitude tests may help to widen participation in medicine [19].
The two main aptitude tests currently in operation in the United Kingdom are the UK Clinical Aptitude Test (UKCAT) [20], which is the principle interest of the present study, and the Biomedical Admissions Test (BMAT) [21,22]. For admission in 2013, UKCAT is be-ing used by 26 UK medical schools, and BMAT by 4 UK medical schools. If aptitude tests are to be of added value in addressing the problem of ceiling effects in edu-cational qualifications, they must predict the future per-formance of medical school candidates over and above that provided by A-levels and Scottish Highers [23]. In addition, if they are to widen participation in the medical profession, it is desirable that scores on UKCAT and BMAT should be less strongly associated with selective secondary schooling than A levels or Scottish Highers.
At present, both UKCAT and BMAT are somewhat controversial [23,24], mainly because of concerns about how well they predict performance at medical school. However, there is also concern over the cost deterring poorer applicants and the effects of coaching [25], which in general can have an effect size of about .26 [26]. To date there have been four studies of the predictive ability of UKCAT [17,27-29], all of which are moderately small (Ns = 292, 307, 204 and 146), and have widely varying conclusions, from a study suggesting the test provides no significant prediction [30] to claims of significant pre-dictive ability [17]. Additionally, one study [31] found no relationship between UKCAT scores and scores on ad-missions interviews. An important consideration in de-termining the validity of any aptitude test is that as well as demonstrating predictive validity in its own right, it should also show incremental validity when used with
current and accepted methods of selection, which at present for medicine are primarily achievement tests taken in secondary education, coupled in many cases with interviews. That is particularly important as tests such as the American Medical College Admission Test (MCAT), which have both aptitude and attainment com-ponents, typically find that most of the prediction is due to the attainment component, rather than the aptitude component [32].
Given the widespread adoption of UKCAT for medical school selection since its introduction in 2006 [33], a more comprehensive examination of the extent to which the test can successfully predict performance and widen participa-tion is required. In this article we address this issue by examining the relationships among multiple predictors of medical school performance (including UKCAT, A levels and Scottish Highers, and a broad range of contextual and socio-cultural measures, including selective schooling), in relation to the first year medical school performance of 4,811 students studying at 12 English and Scottish medical schools in three cohorts who took the UKCAT in 2006 to 2008, entered medical school in 2007 to 2009, and com-pleted their first year in 2008 to 2010.
Although the primary impetus for the present study was to evaluate UKCAT in the context of medical stu-dent selection, the UKCAT-12 study can also be used to address a wider set of important issues. As yet there has been no large-scale, prospective study of medical student performance drawing on a wide range of measures which might predict that performance (including de-tailed socio-economic background measures) across a substantial sample of medical schools. UKCAT-12 pro-vides exactly that, giving not only a platform from which to ask many questions about the nature of medical stu-dent selection and education and the assessment of the effects of a large number of different background mea-sures, but also allowing a determination of the extent to which different measures might have different predictive values in different medical schools. Although, therefore, a prime interest of the present study is to evaluate UKCAT, it also represents the first, long-term, large-scale study of medical student training in the UK. Im-portant features of the present analysis are that the sample is large (nearly 5,000 students), it is diverse and representative of a range of medical schools (12 medical schools taking part), it is extended over time (the data being collected across several years), and there is a‘hard’ outcome measure in the form of medical school examin-ation results on a continuous scale. That means the current study has high statistical power, and also makes it possible to compare medical schools in order to assess the degree to which the conclusions can be generalized across medical schools. Thus, the accumulating database associated with the UKCAT provides an important
McManuset al. BMC Medicine 2013, 11:244 Page 3 of 25
opportunity not only to assess the effectiveness of the UKCAT, but also to assess the influence of a far broader range of issues concerning how educational, demo-graphic and social factors influence medical school out-come, including those assessed with the ‘contextual measures’ which will soon be available for routine use during selection.
Aims of the analysis
The present analysis takes into account the aims which UKCAT set for itself [20,34], as well as various previous studies of aptitude tests (and the criticisms of those studies). It therefore looks at:
◦The predictive validity of A-levels and Scottish Highers for performance in the first year of medical school studies.
◦The predictive validity of UKCAT for performance in the first year of medical school studies.
◦The incremental validity of UKCAT over and above existing measures of educational attainment, both General Certificates of Secondary Education (GCSEs)/ AS-levels/A-levels and Scottish Highers/Advanced Highers.
◦The specific predictive ability, with and without taking educational attainment into account, of the four subscales of UKCAT.
◦An assessment of whether‘Theory‘and‘Skills’ measures at medical school are predicted differently by educational attainment and UKCAT aptitude measures. ◦An assessment of whether the predictive validity of any of the measures is different in the 12 medical schools that have taken part in the study.
◦The role of demographic and socio-economic factors in moderating any of the findings.
It should be noted that the present study is restricted to medical school entrants and, therefore, it cannot look more generally at how social and other factors relate to educational attainment and UKCAT performance in the entire set of medical school applicants (rather than en-trants). The analysis also considers only simple predictor-outcome correlations, and makes no attempt to calculate construct validity, taking into account the unreliability of predictor and outcome measures, restriction of range due to selection, and the right-censorship of predictor vari-ables such as A-level scores. All of that is considered in a separate paper, which carries out a meta-regression of construct validity not only in the UKCAT-12 study, but also in five other cohort studies [35].
Methods
The primary dataset for the UKCAT-12 study consists of the 4,811 students in three separate cohorts, who
entered medical school in 2007, 2008 or 2009, and for whom outcome measures were available at the end of their first academic year. For those cohorts, UKCAT was used in selection by 23, 25 and 26 medical schools. The secondary datasets contained data on a range of other measures, including prior educational achieve-ment, socioeconomic background, and so on. Many of the secondary measures are missing, either for structural reasons (for example, some socio-economic measures are only available for England; A-levels were not avail-able for mature entrants; and so on) and others were also sporadically missing, probably mostly at random. Some secondary measures do not describe individual students, but instead are contextual variables, describ-ing not the students themselves, but features of the edu-cational and socioeconomic environment in which the students lived prior to joining medical school (for ex-ample, aggregated measures of the attainment of the sec-ondary school attended, socio-economic measures of the local community where the student lived, and so on). Contextual measures need to be treated with care, but have been included not only for their sociological inter-est, but also because similar measures are now provided routinely by UCAS, and have been shown to relate to achievement at the BMAT aptitude test [36]. Table 1 summarizes the many measures which were in the ana-lysis, and more detailed information can also be found in the UKCAT-12 Technical Report [34]. The measures can be divided into six broad categories.
Variables are indicated by their SPSS variable names (in bold) to reduce ambiguity.
1. MEDICAL SCHOOL OUTCOME DATA. Medical schools provided information on overall outcome on a four-point scale (passed all exams at first attempt; passed after re-sitting exams; repeating the first year; and leaving the course), which we called
OutcomeFirstYear4pt.Average percentage marks on assessments were also available for most students (OverallMark), and for many students separate marks were also available for‘theory’and‘skills’ assessments (TheoryMarkandSkillsMark; see Table1). The overall, theory and skills marks were all based on marks attained at the first attempt. 2. PRIOR EDUCATIONAL ATTAINMENT, AND SO
ON. Information on prior educational attainment was provided by UCAS, consisting of Scottish Higher and Advanced Higher results for students from Scotland (collectively SQA qualifications), and A-level, AS-level and GCSE results for other students (collectively GCE qualifications). Educational qualifications are always complex to analyze, because different candidates take different examinations with different structures and grading
McManuset al. BMC Medicine 2013, 11:244 Page 4 of 25
Table 1 Summary of variables in the analysis
Category Variables used in the analysis Notes and comments
Medical school outcome data
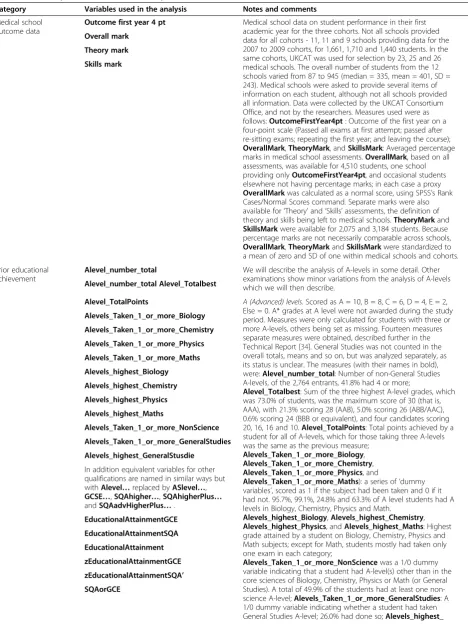
Outcome first year 4 pt Medical school data on student performance in their first academic year for the three cohorts. Not all schools provided data for all cohorts - 11, 11 and 9 schools providing data for the 2007 to 2009 cohorts, for 1,661, 1,710 and 1,440 students. In the same cohorts, UKCAT was used for selection by 23, 25 and 26 medical schools. The overall number of students from the 12 schools varied from 87 to 945 (median = 335, mean = 401, SD = 243). Medical schools were asked to provide several items of information on each student, although not all schools provided all information. Data were collected by the UKCAT Consortium Office, and not by the researchers. Measures used were as follows:OutcomeFirstYear4pt: Outcome of the first year on a four-point scale (Passed all exams at first attempt; passed after re-sitting exams; repeating the first year; and leaving the course); OverallMark,TheoryMark, andSkillsMark: Averaged percentage marks in medical school assessments.OverallMark, based on all assessments, was available for 4,510 students, one school providing onlyOutcomeFirstYear4pt, and occasional students elsewhere not having percentage marks; in each case a proxy OverallMarkwas calculated as a normal score, using SPSS’s Rank Cases/Normal Scores command. Separate marks were also available for‘Theory’and‘Skills’assessments, the definition of theory and skills being left to medical schools.TheoryMarkand SkillsMarkwere available for 2,075 and 3,184 students. Because percentage marks are not necessarily comparable across schools, OverallMark,TheoryMarkandSkillsMarkwere standardized to a mean of zero and SD of one within medical schools and cohorts. Overall mark
Theory mark
Skills mark
Prior educational achievement
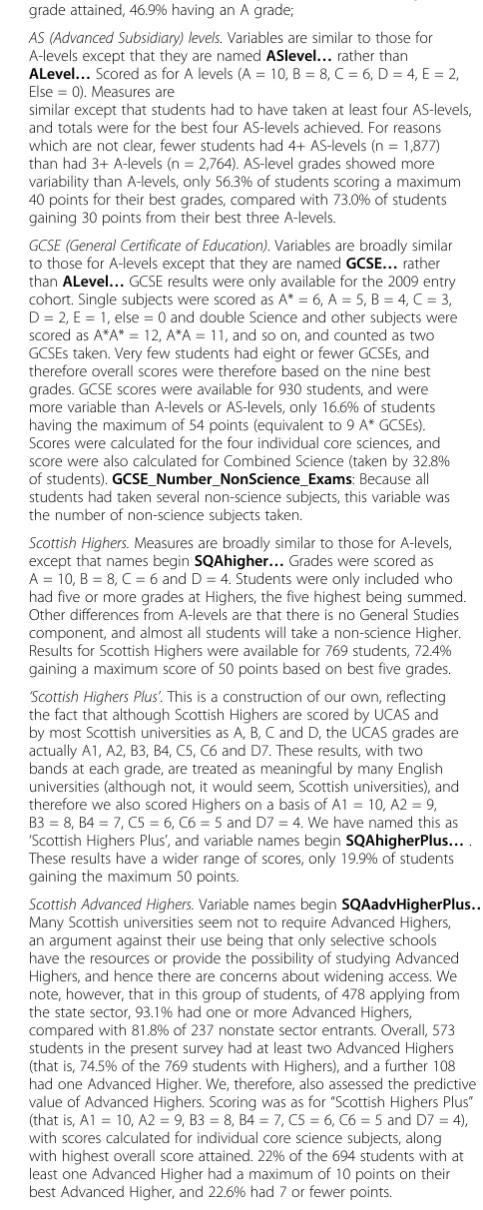
Alevel_number_total We will describe the analysis of A-levels in some detail. Other examinations show minor variations from the analysis of A-levels which we will then describe.
Alevel_number_total Alevel_Totalbest
Alevel_TotalPoints A (Advanced) levels.Scored as A = 10, B = 8, C = 6, D = 4, E = 2, Else = 0. A* grades at A level were not awarded during the study period. Measures were only calculated for students with three or more A-levels, others being set as missing. Fourteen measures separate measures were obtained, described further in the Technical Report [34]. General Studies was not counted in the overall totals, means and so on, but was analyzed separately, as its status is unclear. The measures (with their names in bold), were:Alevel_number_total: Number of non-General Studies A-levels, of the 2,764 entrants, 41.8% had 4 or more;
Alevel_Totalbest: Sum of the three highest A-level grades, which was 73.0% of students, was the maximum score of 30 (that is, AAA), with 21.3% scoring 28 (AAB), 5.0% scoring 26 (ABB/AAC), 0.6% scoring 24 (BBB or equivalent), and four candidates scoring 20, 16, 16 and 10.Alevel_TotalPoints: Total points achieved by a student for all of A-levels, which for those taking three A-levels was the same as the previous measure;
Alevels_Taken_1_or_more_Biology, Alevels_Taken_1_or_more_Chemistry, Alevels_Taken_1_or_more_Physics, and
Alevels_Taken_1_or_more_Maths): a series of‘dummy variables’, scored as 1 if the subject had been taken and 0 if it had not. 95.7%, 99.1%, 24.8% and 63.3% of A level students had A levels in Biology, Chemistry, Physics and Math.
Alevels_highest_Biology,Alevels_highest_Chemistry, Alevels_highest_Physics, andAlevels_highest_Maths: Highest grade attained by a student on Biology, Chemistry, Physics and Math subjects; except for Math, students mostly had taken only one exam in each category;
Alevels_Taken_1_or_more_NonSciencewas a 1/0 dummy variable indicating that a student had A-level(s) other than in the core sciences of Biology, Chemistry, Physics or Math (or General Studies). A total of 49.9% of the students had at least one non-science A-level;Alevels_Taken_1_or_more_GeneralStudies: A 1/0 dummy variable indicating whether a student had taken General Studies A-level; 26.0% had done so;Alevels_highest_ Alevels_Taken_1_or_more_Biology
Alevels_Taken_1_or_more_Chemistry
Alevels_Taken_1_or_more_Physics
Alevels_Taken_1_or_more_Maths
Alevels_highest_Biology
Alevels_highest_Chemistry
Alevels_highest_Physics
Alevels_highest_Maths
Alevels_Taken_1_or_more_NonScience
Alevels_Taken_1_or_more_GeneralStudies
Alevels_highest_GeneralStusdie
In addition equivalent variables for other qualifications are named in similar ways but withAlevel…replaced byASlevel…, GCSE…,SQAhigher…,SQAhigherPlus… andSQAadvHigherPlus….
EducationalAttainmentGCE
EducationalAttainmentSQA
EducationalAttainment
zEducationalAttainmentGCE
zEducationalAttainmentSQA’
SQAorGCE
McManuset al. BMC Medicine 2013, 11:244 Page 5 of 25
Table 1 Summary of variables in the analysis(Continued)
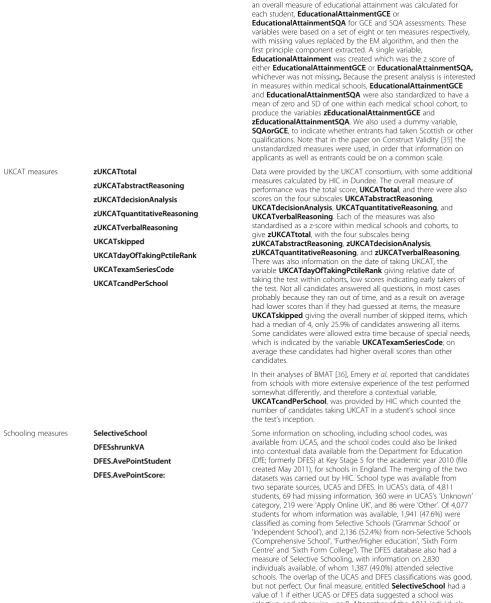
GeneralStudies: For students taking General Studies, the highest grade attained, 46.9% having an A grade;
AS (Advanced Subsidiary) levels.Variables are similar to those for A-levels except that they are namedASlevel…rather than ALevel…Scored as for A levels (A = 10, B = 8, C = 6, D = 4, E = 2, Else = 0). Measures are
similar except that students had to have taken at least four AS-levels, and totals were for the best four AS-levels achieved. For reasons which are not clear, fewer students had 4+ AS-levels (n = 1,877) than had 3+ A-levels (n = 2,764). AS-level grades showed more variability than A-levels, only 56.3% of students scoring a maximum 40 points for their best grades, compared with 73.0% of students gaining 30 points from their best three A-levels.
GCSE (General Certificate of Education). Variables are broadly similar to those for A-levels except that they are namedGCSE…rather thanALevel…GCSE results were only available for the 2009 entry cohort. Single subjects were scored as A* = 6, A = 5, B = 4, C = 3, D = 2, E = 1, else = 0 and double Science and other subjects were scored as A*A* = 12, A*A = 11, and so on, and counted as two GCSEs taken. Very few students had eight or fewer GCSEs, and therefore overall scores were therefore based on the nine best grades. GCSE scores were available for 930 students, and were more variable than A-levels or AS-levels, only 16.6% of students having the maximum of 54 points (equivalent to 9 A* GCSEs). Scores were calculated for the four individual core sciences, and score were also calculated for Combined Science (taken by 32.8% of students).GCSE_Number_NonScience_Exams: Because all students had taken several non-science subjects, this variable was the number of non-science subjects taken.
Scottish Highers.Measures are broadly similar to those for A-levels, except that names beginSQAhigher…Grades were scored as A = 10, B = 8, C = 6 and D = 4. Students were only included who had five or more grades at Highers, the five highest being summed. Other differences from A-levels are that there is no General Studies component, and almost all students will take a non-science Higher. Results for Scottish Highers were available for 769 students, 72.4% gaining a maximum score of 50 points based on best five grades. ‘Scottish Highers Plus’. This is a construction of our own, reflecting the fact that although Scottish Highers are scored by UCAS and by most Scottish universities as A, B, C and D, the UCAS grades are actually A1, A2, B3, B4, C5, C6 and D7. These results, with two bands at each grade, are treated as meaningful by many English universities (although not, it would seem, Scottish universities), and therefore we also scored Highers on a basis of A1 = 10, A2 = 9, B3 = 8, B4 = 7, C5 = 6, C6 = 5 and D7 = 4. We have named this as ‘Scottish Highers Plus’, and variable names beginSQAhigherPlus…. These results have a wider range of scores, only 19.9% of students gaining the maximum 50 points.
Scottish Advanced Highers.Variable names beginSQAadvHigherPlus…. Many Scottish universities seem not to require Advanced Highers, an argument against their use being that only selective schools have the resources or provide the possibility of studying Advanced Highers, and hence there are concerns about widening access. We note, however, that in this group of students, of 478 applying from the state sector, 93.1% had one or more Advanced Highers, compared with 81.8% of 237 nonstate sector entrants. Overall, 573 students in the present survey had at least two Advanced Highers (that is, 74.5% of the 769 students with Highers), and a further 108 had one Advanced Higher. We, therefore, also assessed the predictive value of Advanced Highers. Scoring was as for“Scottish Highers Plus” (that is, A1 = 10, A2 = 9, B3 = 8, B4 = 7, C5 = 6, C6 = 5 and D7 = 4), with scores calculated for individual core science subjects, along with highest overall score attained. 22% of the 694 students with at least one Advanced Higher had a maximum of 10 points on their best Advanced Higher, and 22.6% had 7 or fewer points.
McManuset al. BMC Medicine 2013, 11:244 Page 6 of 25
Table 1 Summary of variables in the analysis(Continued)
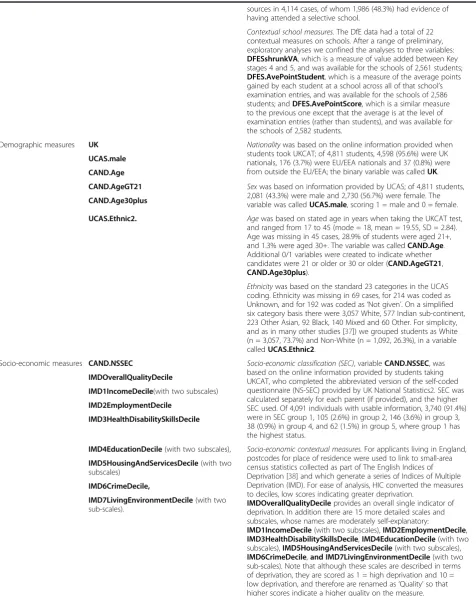
Overall measures of educational attainment.As described in the text, an overall measure of educational attainment was calculated for each student,EducationalAttainmentGCEor
EducationalAttainmentSQAfor GCE and SQA assessments. These variables were based on a set of eight or ten measures respectively, with missing values replaced by the EM algorithm, and then the first principle component extracted. A single variable,
EducationalAttainmentwas created which was the z score of eitherEducationalAttainmentGCEorEducationalAttainmentSQA, whichever was not missing.Because the present analysis is interested in measures within medical schools,EducationalAttainmentGCE andEducationalAttainmentSQAwere also standardized to have a mean of zero and SD of one within each medical school cohort, to produce the variableszEducationalAttainmentGCEand zEducationalAttainmentSQA. We also used a dummy variable, SQAorGCE, to indicate whether entrants had taken Scottish or other qualifications. Note that in the paper on Construct Validity [35] the unstandardized measures were used, in order that information on applicants as well as entrants could be on a common scale. UKCAT measures zUKCATtotal Data were provided by the UKCAT consortium, with some additional
measures calculated by HIC in Dundee. The overall measure of performance was the total score,UKCATtotal, and there were also scores on the four subscalesUKCATabstractReasoning, UKCATdecisionAnalysis,UKCATquantitativeReasoning, and UKCATverbalReasoning. Each of the measures was also standardised as a z-score within medical schools and cohorts, to givezUKCATtotal, with the four subscales being
zUKCATabstractReasoning,zUKCATdecisionAnalysis, zUKCATquantitativeReasoning, andzUKCATverbalReasoning, There was also information on the date of taking UKCAT, the variableUKCATdayOfTakingPctileRankgiving relative date of taking the test within cohorts, low scores indicating early takers of the test. Not all candidates answered all questions, in most cases probably because they ran out of time, and as a result on average had lower scores than if they had guessed at items, the measure UKCATskippedgiving the overall number of skipped items, which had a median of 4, only 25.9% of candidates answering all items. Some candidates were allowed extra time because of special needs, which is indicated by the variableUKCATexamSeriesCode; on average these candidates had higher overall scores than other candidates.
zUKCATabstractReasoning
zUKCATdecisionAnalysis
zUKCATquantitativeReasoning
zUKCATverbalReasoning
UKCATskipped
UKCATdayOfTakingPctileRank
UKCATexamSeriesCode
UKCATcandPerSchool
In their analyses of BMAT [36], Emeryet al.reported that candidates from schools with more extensive experience of the test performed somewhat differently, and therefore a contextual variable, UKCATcandPerSchool, was provided by HIC which counted the number of candidates taking UKCAT in a student’s school since the test’s inception.
Schooling measures SelectiveSchool Some information on schooling, including school codes, was available from UCAS, and the school codes could also be linked into contextual data available from the Department for Education (DfE; formerly DFES) at Key Stage 5 for the academic year 2010 (file created May 2011), for schools in England. The merging of the two datasets was carried out by HIC. School type was available from two separate sources, UCAS and DFES. In UCAS’s data, of 4,811 students, 69 had missing information, 360 were in UCAS’s‘Unknown’ category, 219 were‘Apply Online UK’, and 86 were‘Other’. Of 4,077 students for whom information was available, 1,941 (47.6%) were classified as coming from Selective Schools (‘Grammar School’or ‘Independent School’), and 2,136 (52.4%) from non-Selective Schools (‘Comprehensive School’,‘Further/Higher education’,‘Sixth Form Centre’and‘Sixth Form College’). The DFES database also had a measure of Selective Schooling, with information on 2,830 individuals available, of whom 1,387 (49.0%) attended selective schools. The overlap of the UCAS and DFES classifications was good, but not perfect. Our final measure, entitledSelectiveSchoolhad a value of 1 if either UCAS or DFES data suggested a school was selective, and otherwise was 0. Altogether of the 4,811 individuals in the Primary Database, information was available for one or both DFESshrunkVA
DFES.AvePointStudent
DFES.AvePointScore:
McManuset al. BMC Medicine 2013, 11:244 Page 7 of 25
Table 1 Summary of variables in the analysis(Continued)
sources in 4,114 cases, of whom 1,986 (48.3%) had evidence of having attended a selective school.
Contextual school measures. The DfE data had a total of 22 contextual measures on schools. After a range of preliminary, exploratory analyses we confined the analyses to three variables: DFESshrunkVA, which is a measure of value added between Key stages 4 and 5, and was available for the schools of 2,561 students; DFES.AvePointStudent, which is a measure of the average points gained by each student at a school across all of that school’s examination entries, and was available for the schools of 2,586 students; andDFES.AvePointScore, which is a similar measure to the previous one except that the average is at the level of examination entries (rather than students), and was available for the schools of 2,582 students.
Demographic measures UK Nationalitywas based on the online information provided when students took UKCAT; of 4,811 students, 4,598 (95.6%) were UK nationals, 176 (3.7%) were EU/EEA nationals and 37 (0.8%) were from outside the EU/EEA; the binary variable was calledUK. UCAS.male
CAND.Age
CAND.AgeGT21 Sexwas based on information provided by UCAS; of 4,811 students, 2,081 (43.3%) were male and 2,730 (56.7%) were female. The variable was calledUCAS.male, scoring 1 = male and 0 = female. CAND.Age30plus
UCAS.Ethnic2. Agewas based on stated age in years when taking the UKCAT test, and ranged from 17 to 45 (mode = 18, mean = 19.55, SD = 2.84). Age was missing in 45 cases, 28.9% of students were aged 21+, and 1.3% were aged 30+. The variable was calledCAND.Age. Additional 0/1 variables were created to indicate whether candidates were 21 or older or 30 or older (CAND.AgeGT21, CAND.Age30plus).
Ethnicitywas based on the standard 23 categories in the UCAS coding. Ethnicity was missing in 69 cases, for 214 was coded as Unknown, and for 192 was coded as‘Not given’. On a simplified six category basis there were 3,057 White, 577 Indian sub-continent, 223 Other Asian, 92 Black, 140 Mixed and 60 Other. For simplicity, and as in many other studies [37]) we grouped students as White (n = 3,057, 73.7%) and Non-White (n = 1,092, 26.3%), in a variable calledUCAS.Ethnic2.
Socio-economic measures CAND.NSSEC Socio-economic classification (SEC), variableCAND.NSSEC, was based on the online information provided by students taking UKCAT, who completed the abbreviated version of the self-coded questionnaire (NS-SEC) provided by UK National Statistics2. SEC was calculated separately for each parent (if provided), and the higher SEC used. Of 4,091 individuals with usable information, 3,740 (91.4%) were in SEC group 1, 105 (2.6%) in group 2, 146 (3.6%) in group 3, 38 (0.9%) in group 4, and 62 (1.5%) in group 5, where group 1 has the highest status.
IMDOverallQualityDecile
IMD1IncomeDecile(with two subscales) IMD2EmploymentDecile
IMD3HealthDisabilitySkillsDecile
IMD4EducationDecile(with two subscales), Socio-economic contextual measures.For applicants living in England, postcodes for place of residence were used to link to small-area census statistics collected as part of The English Indices of Deprivation [38] and which generate a series of Indices of Multiple Deprivation (IMD). For ease of analysis, HIC converted the measures to deciles, low scores indicating greater deprivation.
IMDOverallQualityDecileprovides an overall single indicator of deprivation. In addition there are 15 more detailed scales and subscales, whose names are moderately self-explanatory:
IMD1IncomeDecile(with two subscales),IMD2EmploymentDecile, IMD3HealthDisabilitySkillsDecile,IMD4EducationDecile(with two subscales),IMD5HousingAndServicesDecile(with two subscales), IMD6CrimeDecile,and IMD7LivingEnvironmentDecile(with two sub-scales). Note that although these scales are described in terms of deprivation, they are scored as 1 = high deprivation and 10 = low deprivation, and therefore are renamed as‘Quality’so that higher scores indicate a higher quality on the measure. IMD5HousingAndServicesDecile(with two
subscales) IMD6CrimeDecile,
IMD7LivingEnvironmentDecile(with two sub-scales).
McManuset al. BMC Medicine 2013, 11:244 Page 8 of 25
schemes, and candidates have chosen to study different subjects. Four medical schools were from Scotland and eight from the rest of the UK, entrants to the former mostly, but not entirely, taking Scottish Highers rather than A-levels. No easy solution is possible for the difficult problem of equating the two different sets of results [37], and we have followed the approach of Tiffinet al.[19] in converting Scottish Highers and A-levels to z-scores, which can then be combined. The Technical Report [34] describes an extensive set of preliminary analyses of the wide range of different measures of attainment (see Table1). Briefly, each of the 42 derived scores for A-levels, AS-levels and GCSEs was correlated withOverallScore(TR Table1a,b). Multiple regressions suggested that only a subset of eight measures (TR Table2) showed independent predictions of outcome. Missing values for these eight measures were replaced by expectation-minimization (EM) imputation, the resulting 8 x 8 correlation matrix factor analyzed, the first principle component extracted, (which has a mean of zero and SD of one), and scores on that were used as an optimal summary measure of attainment at A-level, AS-level and GCSE. A similar process was carried out for the 51 derived measures of Highers,‘Highers Plus’and Advanced Highers, each of which was correlated withOverallScore(TR Table3). Ten independent predictors were found, missing values replaced by imputation, and the first principle
component extracted (TR Table4). Since the principle components for the two analyses were both on standardized scales, they could be combined to provide an optimal summary measure of
Educational Attainmentfor the majority of students. Educational attainment measures differ between medical schools and between cohorts, but because the main interest in this study is prediction within medical schools, we have standardized Educational Attainmentwithin cohorts and medical schools, resulting in the variable we call
zEducational Attainment. It should be noted that educational qualifications were only available in most cases for non-mature students (age less than 21). Although statistically optimal, and hence good for assessing underlying processes using as much information as possible, we realize thatzEducational Attainmentdoes not reflect the current selection processes, and therefore we also report results for the more conventional measures of three best A-levels, four best AS-A-levels, nine best GCSEs, five best Scottish Highers, five best Scottish“Highers Plus” (which includes finer definition of bands within grades), and the best Scottish Advanced Higher. 3. UKCAT SCORES. The main measures from UKCAT
were the scores on the cognitive tests, the total score,UKCATtotal, and the scores on the four subtests,UKCATabstractReasoning,
UKCATdecisionAnalysis,
UKCATquantitativeReasoningand
Table 2 Correlations of UKCAT sub-scores with outcomes
Abstract reasoning
Decision analysis
Quantitative reasoning
Verbal reasoning
OverallMark SkillsMark TheoryMark
Abstract reasoning(zUKCATabstractReasoning) 1 .196*** .190*** .114*** .080*** .053** .052* (4,811) (4,811) (4,811) (4,811) (3,184) (2,075) Decision analysis(zUKCATdecisionAnalysis) .196*** 1 .156*** .146*** .090*** .056*** .077***
(4,811) (4,811) (4,811) (4,811) (3,184) (2,075)
Quantitative reasoning
(zUKCATquantitativeReasoning)
.190*** .156*** 1 .213*** .076*** .044* .079***
(4,811) (4,811) (4,811) (4,811) (3,184) (2,075)
Verbal reasoning(zUKCATverbalReasoning) .114*** .146*** .213*** 1 .115*** .028 .177***
(4,811) (4,811) (4,811) (4,811) (3,184) (2,075)
Total UKCAT score(zUKCATtotal) .604*** .655*** .583*** .591*** .148*** .075*** .160*** (4,811) (4,811) (4,811) (4,811) (4,811) (3,184) (2,075) Educational attainment(zEducationalAttainment) .144*** .131*** .133*** .087*** .362*** .210*** .351*** (3,432) (3,432) (3,432) (3,432) (3,432) (2,240) (1,407) Three best A-levels(Alevels_TotalBest) .123*** .121*** .127*** .062** .177*** .096*** .248*** (2,764) (2,764) (2,764) (2,764) (2,764) (2,000) (1,250)
Five best highers(SQAhighers_TotalBest) .083* .129*** .202*** .070 .003 .027 .074
(769) (769) (769) (769) (769) (298) (199)
Correlations of the UKCAT subscales with each other, with UKCAT total score, and with prior Educational Attainment (three best A-levels, five best Highers and
zEducationalAttainment), and medical school performance (Overall, and Skills and Theory assessments); ***P<.001; **P<.01; *P<.05.
McManuset al. BMC Medicine 2013, 11:244 Page 9 of 25
Table 3 Simple Pearson correlations of key measures with a range of demographic, school, social and UKCAT process measures
Educational Attainment (zEducational Attainment)
3/5 best A-levels/Highers (Alevels_TotalBest SQAhighers_TotalBest)
UKCAT total score (zUKCATtotal)
Overall medical school score (OverallScore)
Demographic measures
UK national(UK) .008 .000/-.042 .060 *** -.007
(3,432) (2,764/769) (4,811) (4,811)
Male(UCAS.Male) -.037 * .026/.058 .061 *** -.039 **
(3,432) (2,764/769) (4,742) (4,742)
Aged 21+(Cand.AgeGT21) n/a n/a -.060 *** .080 ***
(4,766) (4,766)
Aged 30+(Cand.Age30plus) n/a n/a -.023 -.003
(4,766) (4,766)
Ethnic2 (non-White)(UCAS.Ethnic2) -.053 ** -.062 **/-.033 -.141 *** -.142 ***
(3,221) (2,549/766) (4,149) (4,149)
School measures Selective schooling(SelectiveSchool) .051 ** .038 */.120 *** .075 *** -.101 ***
(3,432) (2,764/769) (4,811) (4,811)
DfES value added KS 5(DFESshrunkVA) -.012 .012/n/a -.014 -.049 *
(2,092) (2,119) (2,561) (2,561)
DfES average points per student(DFES.AVEPointStudent) .085 *** .127 ***/n/a .097 *** -.065 ***
(2,114) (2,141) (2,586) (2,586)
DfES average points per exam entry(DFES.AvePointScore) .111 *** .101 ***/n/a .044 * -.111 ***
(2,109) (2,136) (2,582) (2,582)
Social background Socio-economic classification (SEC) (1 = High 5 = Low) (CAND.NSSEC)
-.058 * -.084 ***/-.046 -.056 *** -.011
(2,939) (2,356/675) (4,091) (4,091)
Overall deprivation decile (1 = high, 10 = low deprivation) (IMDOverallQualityDecile)
.079 *** .076 ***/n/a .113 *** .032
(2,275) (2,307) (3,074) (3,074)
Income deprivation decile(IMD1IncomeDecile) .078 *** .083 ***/n/a .125 *** .039 *
(2,275) (2,307) (3,074) (3,074)
Employment deprivation decile(IMD2EmploymentDecile) .063 ** .073 ***/n/a .109 *** .008
(2,275) (2,307) (3,074) (3,074)
Health disability decile(IMD3HealthDisabilitySkillsDecile) .055 ** .048 */n/a .098 *** .016
(2,275) (2,307) (3,074) (3,074)
Education deprivation decile(IMD4EducationDecile) .056 ** .064 **/n/a .083 *** -.019
(2,275) (2,307) (3,074) (3,074)
McManus
et
al.
BMC
Medicine
Page
10
of
25
2013, 11:244
Table 3 Simple Pearson correlations of key measures with a range of demographic, school, social and UKCAT process measures(Continued)
Housing and services deprivation decile (IMD5HousingAndServicesDecile)
.046 * .035/n/a -.024 .059 ***
(2,275) (2,307) (.176) (3,074)
Crime deprivation decile(IMD6CrimeDecile) .061 ** .040/n/a .100 *** .062 ***
(2,275) (2,307) (3,074) (3,074)
Living environment decile(IMD7LivingEnvironmentDecile) .049 * .036/n/a .066 *** .042 *
(2,275) (2,307) (3,074) (3,074)
UKCAT measures UKCAT questions skipped/missed(UKCATskipped) .000 -.015/-.041 -.310 *** -.005
(3,432) (2,764/769) (4,811) (4,811)
UKCAT percentile day of taking test(UKCATdayOfTakingPctileRank) -.092 *** -.059 **/-.018 -.058 *** -.090 ***
(3,432) (2,764/769) (4,811) (4,811)
UKCAT allowed extra time(UKCATexamSeriesCode) .007 .014/-.012 .030 * .004
(3,432) (2,764/769) (4,811) (4,811)
UKCAT school experience of test(UKCATcandPerSchool) -.029 .038/-.174 *** -.033 * -.033 *
(3,295) (2,630/754) (4,022) (4,022)
GCE and SQA results
Three best A-levels(Alevels_TotalBest) .690 *** −/− .088 *** .177 ***
(2,725) (2,764) (2,764)
Four best AS-levels(ASlevels_TotalBest) .605 *** .416 ***/- .155 *** .184 ***
(1,842) (1,865/-) (1,877) (1,877)
Nine best GCSEs(GCSEs_TotalBest) .600 *** .293 ***/- .202 *** .082 *
(721) (723/-) (930) (930)
Five best Scottish Highers(SQAhighers_TotalBest) .328 *** −/− .040 .003
(715) (769) (769)
Five best Scottish“Highers Plus”(SQAhighersPlus_TotalBest) .532 *** -/.884 *** .104 ** .137 ***
(682) (−/730) (730) (730)
Best Scottish advanced higher(SQAadvHighers_TotalBest) .776 *** -/.249 *** .118 ** .362 ***
(639) (−/769) (681) (681)
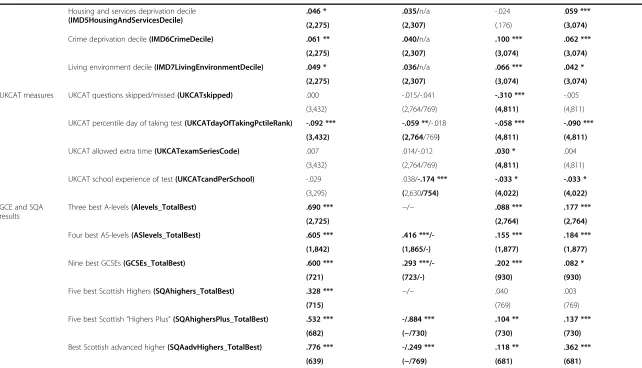
Note: measures in italics arecontextual measures, and should be treated with care as they describe the student’s environment rather than the student themselves.Key: *P<.05; ** P <.01; ***P<.001. Correlations withP<.05 are also shown in bold. Names in bold in parentheses are variable names as described in Table1).
McManus
et
al.
BMC
Medicine
Page
11
of
25
2013, 11:244
Table 4 Comparison of the four outcome groups
Fail (a) Repeat 1st year (b)
Passed after re-sits (c)
Passed all first time (d)
ANOVA (r) Linear trend F(1,n)
ANOVA (r) Nonlinear F(2,n)
Levene test Homogenous subsets (s)
Overall Mark(p, q); All cases −2.644 −1.924 −1.110 .235 2843.8 36.9 P≤.001 a,b,c,d
(1.28, 96) (.99, 94) (.79, 565) (.80, 4,056) P<.001 P<.001
Theory Mark(p) −1.258 −1.322 -.654 .250 619.9 23.1 NS ab, c, d
(.44, 29) (.82, 29) (.76, 294) (.68, 1,723) P<.001 P<.001
Skills Mark(p) −1.079 -.891 -.616 .214 602.8 32.0 P≤.001 ab, bc, d
(.84,40) (.87, 438) (.90, 438) (.71, 2,655) P<.001 P<.001
Totoal UKCAT score(UKCATtotal) 2492 2457 2486 2544 43.7 6.8 NS abc, ad
(192, 96) (230,94) (205, 565) (205,4,056) P<.001 P= .001
zUKCAT (p)(zUKCATtotal) -.121 -.312 -.186 .036 25.3 5.3 NS abc, ad
(.95,96) (1.01, 94) (.99, 565) (.99, 4,056) P<.001 P= .005
UKCAT abstract reasoning (p)(zUKCATabstractReasoning) -.163 -.224 -.096 .022 13.1 0.75 NS abcd
(.94, 96) (1.02, 94) (.97, 565) (1.00, 4,056) P<.001 NS
UKCAT decision analysis (p)(zUKCATdecisionAnalysis) -.064 -.302 -.129 .026 14.01 3.70 NS abc, ad
(1.08, 96) (.99, 94) (.98, 565) (.995, 4,056) P<.001 P= .025
UKCAT quantitative reasoning (p)(zUKCATquantitativeReasoning) .045 -.110 -.116 .018 3.38 3.38 NS abcd
(.97, 96) (1.03, 94) (1.06, 565) (.99, 4,056) NS P= .034
UKCAT verbal reasoning (p)(zUKCATverbalReasoning) -.087 -.136 -.127 .023 9.56 2.13 NS abcd
(.97, 96) (1.16, 94) (.96, 565) (1.00, 4,056) P= .002 NS
Educational attainment (p)(zEducationalAttainment) -.441 -.653 -.563 .104 156.1 29.5 P≤.001 abc, d
(.942, 65) (1.06, 60) (1.14, 414) (.94, 2,893) P<.001 P<.001
Three best A-levels(Alevels_TotalBest) 28.89 28.28 29.06 29.39 44.8 6.47 P≤.001 a,bc,d
(2.82, 56) (1.58, 49) (1.36, 333) (1.22, 2,326) P<.001 P= .002
Five best highers(SQAhighers_TotalBest) 48.71 47.50 48.70 48.99 3.8 1.66 NS abcd
(1.57, 17) (2.58, 16) (2.46, 88) (2.40, 648) NS NS
Notes:
P-values are standardized within schools (Note: this is not the case for the raw, UKCAT total mark)
q. In a small proportion of cases, as described in the text, the overall mark is based on a normal score derived from the four-point categorical scale. For comparability with other analyses, the first row includes these cases. However, the second row analyses only cases where an overall mark was explicitly provided.
r. The denominator df, n, can be calculated as N-4, N is the total number of cases (provided in individual cells).
s. If values are together then they are not significantly different from one another and form a homogenous subset withP>.05 using the Ryan-Einot-Gabriel-Welsch range test. As an example,“abc, ad”means that groups a, b and c (Fail, repeat first year and passed after re-sits) do not differ from one another; likewise groups a and d (Fail, Passed all first time) do not differ from one another. Group d (Passed all first time) is significantly different from Repeat first year and Passed after re-sits.“a, b, c, d”indicates each differs from each of the other three groups, and“abcd”indicates no significantpost hocdifferences.
McManus
et
al.
BMC
Medicine
Page
12
of
25
2013, 11:244
UKCATverbalReasoning. Details of the tests can be found elsewhere [20,38-42]. Formats were
unchanged across the three cohorts. Reliabilities are summarized in the Technical Report [34] (p.18). Mean UKCAT scores differed both between medical schools, and scores also rose across the cohorts, the differences being meaningful since UKCAT is statistically equated across cohorts using item-response theory. As with educational attainment, UKCAT scores have, therefore, been standardized as z-scores within medical schools and cohorts, since it is performance within medical school and cohort which is of interest. As well as scores on UKCAT, we also had measures of the date of taking the test (UKCATdayOfTakingPctileRank), the number of items not answered(UKCATskipped), whether there was a time extension because of special needs (UKCATexamSeriesCode), and the contextual measure of the experience of a student’s secondary school in taking UKCAT(UKCATcandPerSchool). 4. SCHOOLING MEASURES. The principal measure wasSelectiveSchool, which used data from UCAS and DFES to identify candidates educated at selective secondary schools. Three contextual measures were also used,DFESshrunkVA, DFES. AvePointStudent,andDFES.AvePointScore, which assessed the performance of students at the
secondary school attended by the student in our study (see Table1for details).
5. DEMOGRAPHIC MEASURES. Measures were available ofNationality(UK or non-UK),Sex, Age andEthnicity(classified for present purposes as White/non-White). See Table1.
6. SOCIO-ECONOMIC MEASURES. Socio-economic classification (SEC) was based on the online information provided by students taking UKCAT, who completed the abbreviated self-coded questionnaire (NS-SEC) of UK National Statistics [43]. Postcode based contextual measures of social background were based on the 16 measures provided in The English Indices of Deprivation [44] (see Table1).
Ethics, anonymity and confidentiality
Ethical permission for the study was provided by UCL. The medical schools providing data for the analysis did so on the basis of strict anonymity of the institutions themselves. We have also had no access to raw, non-anonymized data, and have had to accept the data as provided as being correct and accurate. Data were pro-vided by the Health Informatics Centre (HIC) at the University of Dundee as anonymized, encrypted files, with a randomized identification code for applicants in each year, which allowed merging of various datasets.
Data analysis was carried out by ICM and CD. SN and JD did know the identity of medical schools, but did not process the anonymized data.
Statistical analyses
Conventional statistical analyses used IBM SPSS 20 (Inter-national Business Machines Corporation, Statistical Pack-age for the Social Sciences, Armonk, New York, USA), with missing values handled using the EM method in Missing Values Analysis. Multilevel modeling used MLwiN v 2.24. (Centre for Multilevel Modelling, University of Bristol, Bristol, UK).
Results
The UKCAT-12 study has one set of outcome measures (medical school performance measures), two important sets of predictors (measures of prior educational attain-ment and scores on the UKCAT test), and a wide range of background measures (demographic, secondary schooling, socio-economic and other measures). These will be con-sidered in turn, and in relation to each other.
Medical school outcome measures
Of 4,811 medical students on the four-point outcome scale (OutcomeFirstYear4pt), 4,056 (84.3%) passed all their first year examinations without re-sits, 565 (11.7%) progressed from the first year after re-sits, 94 (2.0%) were required to repeat the first year, and 96 (2.0%) left the medical school (proportions which are very similar to the 81%, 14%, 1% and 4% reported in a cohort of medical stu-dents entering in 1981 [45]. Altogether 109 stustu-dents left medical school, in 55 cases for Academic Reasons, and in 49 for non-Academic reasons (3 after repeating the first year, and 10 after passing the first year exams). Figure 1a shows that the distribution of OverallMark is approxi-mately normal, with some leftward skew. Distributions of TheoryMark and SkillsMarkin Figure 1b,c are also ap-proximately normally distributed, the correlation between them being 0.566 (Figure 1d).
Background variables and their relationship to educational attainment, UKCAT score and medical school outcome
Table 3 shows correlations of the 22 background vari-ables, as well as the 6 conventional measures of GCE and SQA achievement, with zEducationalAttainment, zUKCATtotalscore, and performance at medical school. It should be remembered that many of the background variables are themselves inter-correlated, and in the fol-lowing analyses multivariate statistics are used to tease apart the relationships. Among this population of en-trants to medical school, who are not, of course, repre-sentative of applicants, the 22 background variables together accounted for 3.9% of variance in educational
McManuset al. BMC Medicine 2013, 11:244 Page 13 of 25
attainment, and 14.0% of variance in UKCAT total score, although that difference may in part reflect selec-tion on educaselec-tional attainment and, hence, greater re-striction of range.
Prior educational attainment and its relation to medical school performance
Overall there was a highly significant correlation between prior educational attainment (zEducationalAttainment) andOverallMark(r = .362, n = 3432,P<.001), which was significantly stronger (z = 3.76,P<.001) for SQA qualifica-tions (r = .464, n = 715,P<.001, 95% CI .406 to .522) than for GCE qualifications (r = .331, n = 2,717, P<.001, 95% CI .298 to .364), the relationships being shown in Figure 2. OverallMarkwas not as strongly correlated with the more conventional measures of three best A-levels (r = .185, n = 2,717, P <.001) and five best Scottish Highers (r = .121, n = 715, P = .001), primarily due to restriction of range and ceiling effects, although both correlated strongly with
zEducationalAttainment (A-levels: r = .690, n = 3,432, P<.001; Highers; r = .328, n = 715,P<.001). Students with lower attainment at A-level did, though, perform less well, the regression model suggesting that students with BBB performed about 1.1 SDs below those with AAA, a sub-stantial effect. As explained in the Technical Report [34], our analysis looked in detail at various aspects of measures of Educational Achievement. In particular, we note that for GCE examinations predicting OverallMark: i) AS-level results provided an incremental prediction over A-levels; ii) GCSEs provided an incremental prediction over A- and AS-levels; iii) grade at General Studies A-level pro-vided an incremental prediction over (other) A-levels; iv) grades on all four core-sciences provided an incremental prediction over summed A-level grades, further explor-ation finding that a key predictor appears to be the mini-mum core science grade attained, low values predicting poorer performance at medical school; v) there was no evidence that grades at any of the four core sciences were Figure 1OverallMark (a), TheoryMark (b) and SkillsMark (c) , and SkillsMark in relation to TheoryMark (d).The red line is the linear regression, and the green line a lowess curve.
McManuset al. BMC Medicine 2013, 11:244 Page 14 of 25
particularly predictive of medical school performance, with simple correlations ofOverallMarkwith grades in Biology, Chemistry, Math and Physics being .182, .143, .125 and .172 (allP<.001, n = 2,645, 2,739, 18,750 and 685). For SQA examinations in relation toOverallMark: i) ‘Highers Plus’ scoring provides incremental prediction over con-ventional Highers scoring; ii) Advanced Highers provides
incremental prediction over Highers/HighersPlus; iii) None of the core sciences showed specific incremental prediction, either at Highers or HighersPlus; iv) Advanced Highers grades at Biology and Chemistry (but not Math and Physics), provided incremental prediction; v) As with A-levels, the minimum core science grade attained seems to have predictive value. Finally, because SQA qualifications had Figure 2Relationship of OverallMark at medical school to Educational Attainment (zEducationalAttainment).Scattergrams are shown separately fora)General Certificate of Education (GCE) qualifications (A-levels/AS-levels/GCSEs), andb)Scottish Qualifications Authority (SQA) qualifications (Scottish Highers and Advanced Highers). The red line is a linear regression, and the green line is a lowess curve. The slope of the line for SQA qualifications (b = .423) is significantly larger than that for GCE qualifications (b = .349; interaction term, t = 25.95, 3,428 df, P <.001).
McManuset al. BMC Medicine 2013, 11:244 Page 15 of 25
a higher predictive validity than GCE qualifications, we compared the predictive validity of the qualifications in Scottish medical schools (where entrants have either GCE or SQA qualifications) and other medical schools (where entrants have GCE qualifications). In Scottish medical schools, SQA results had higher correlations with outcome than did GCE results for students on the same course, whereas GCE predicted outcome equivalently in Scottish and non-Scottish schools. SQA results do have greater predictive power, perhaps because of the inclusion of Advanced Highers results. However, elsewhere we show that despite the higher correlation with outcome, the con-struct validity of SQA results is somewhat lower than that for GCE results [35].
Predictive value of background variables, after taking prior educational attainment into account
Prior educational attainment correlates with a wide range of background variables (TR Table 5). An import-ant question, though, concerns the extent to which back-ground variables continue to predict outcome after educational attainment has been taken into account. OverallMark was regressed on the 22 background vari-ables, with an alpha set at 0.001 to account for repeated testing. Four background measures were significant, in order of entry:Ethnic2, non-White students performing less well (beta = −.126, P <10-14); being a mature student, students over the age of 21 performing better than non-mature students (beta = .057, P <.001);
UKCATdayOfTakingPctileRank, students who took
UKCAT late performing less well (beta =−.089,P<10-7); and DFES.AvePointEntry, students from high-attaining secondary schools performing less well (beta =−.085, P<10-7). Figure 3 exploresDFES.AvePointEntryin more detail. Figure 3c shows that average points per exam entry are substantially lower in non-selective schools than se-lective schools. The average points are divided into four groups (boundaries 205, 230 and 250), with almost no se-lective secondary schools in the lowest group and almost no non-selective secondary schools in the highest group. Effects upon overall score were estimated with a regres-sion model in which there were significant effects of three best A-level grades (beta = .205, P <.001) and secondary school-level average points (beta = −.085, P = .005), and an almost significant effect of selective secondary school-ing (beta = −.056, P = .059), the fitted regression lines being shown in Figure 3a. There was no evidence of inter-actions. Actual mean scores are shown for candidates whose secondary schools were in the four groups of aver-age points, and it can be seen, particularly for entrants with AAA grades in both non-selective and selective sec-ondary schools that overall scores at medical school are lower in those from secondary schools with higher average point scores. From the regression lines it can be estimated
that one grade at A-level (the difference between AAA and AAB) is equivalent to 85 points on the average point score, so that an entrant with ABB at A-level from a sec-ondary school with an average score of 175 (at about the 1st percentile of the non-selective schools) performs simi-larly at medical school to a candidate with AAA at A-level from a secondary school with an average score of 265 (at the 99th percentile of the selective secondary schools).
The relationship of UKCAT total scores to medical school performance and to background variables
The correlation between UKCAT scores andOverallMark was 0.148 (n = 4,811,P<0.001). Because UKCAT is often said to be particularly helpful in selecting mature entrants (where educational qualifications are often out of date or not applicable), we compared the predictive validity of UKCAT in mature and non-mature students (Figure 4). The correlation with OverallMark was higher in ma-ture students (r = .252, N = 690,P<.001), than in non-mature students (r = .137, n = 4,076,P <.001). Mature students had somewhat more variable raw UKCAT scores (SD = 237.7 compared with 200.0), but regression showed that that was not the cause of the increased cor-relation with OverallMark. The incremental validity of UKCAT after taking educational attainment into ac-count was assessed by regressing OverallMark firstly onzEducationalAttainment, and then onzUKCATtotal. zUKCATtotal significantly improved the prediction of OverallMark(t = 3.54, 3,429 df,P<.001), but the beta co-efficient was only 0.057, whereas the beta coco-efficient for zEducationalAttainment after taking UKCAT into ac-count was 0.351. In practice, many admissions tutors can only use three best A-levels and, therefore, we repeated the exercise with Alevel_TotalbestN, when the beta for UKCAT was .101 but for A-levels was .168. The previous analysis of OverallMarkin relation to the background variables, after taking educational achievement into account, had found four background variables related to medical school performance. We repeated the re-gression analysis after inclusion of UKCAT as well as educational achievement. All of the four variables significant previously were again significant, suggesting that UKCAT performance cannot eliminate the effects of ethnicity, secondary schooling, day of taking UKCAT, or being a mature student in first year medical school performance. In addition, Sex was also a significant predictor of OverallMark, males performing less well, after taking UKCAT and other measures into account (beta =−.056,P<.001).
Theory and Skills exams and the subtests of UKCAT
UKCAT has four subtests - Abstract Reasoning, Decision Analysis, Quantitative reasoning and Verbal Reasoning -which may correlate differently with educational attainment
McManuset al. BMC Medicine 2013, 11:244 Page 16 of 25
and with medical school performance, particularly perhaps between Theory and Skills measures. Table 2 shows corre-lations between the four UKCAT sub-scales, and it can be seen that they are significantly, but only moderately, corre-lated, suggesting that they are indeed measuring different cognitive processes. Each sub-scale correlates with the total UKCAT score (but it is, of course, a part of it). The sub-scales all correlate to much the same extent with educa-tional attainment, except for verbal reasoning which has a rather lower correlation. All four sub-scales correlate with OverallMarkat medical school, although verbal reasoning correlates significantly more highly than the other three
sub-scales, a pattern which is clearer still for the marks from Theory exams, whereas all four sub-scales show low and similar correlations withSkillsMark. In the Technical Report [34], we describe further analyses showing that of the subtests, it is Verbal Reasoning, which particularly con-tributes unique variance to predicting medical school per-formance after Educational Achievement has been taken into account, both overall and forTheoryMark, and also forSkillsMark, when higher Verbal Reasoning predicted a lower SkillsMark. Verbal ability may predict better than other subtests due to verbal tests being less subject to prac-tice and coaching effects [26].
Figure 3a) Performance at medical school in relation to DfES average point score for secondary school attended.Performance of medical school entrants (vertical) is expressed as a standardised (z) score. DfES measure of average point score per examination entry (horizontal) is for the (English) secondary school which the entrant attended. Sectionsb)andc)show the distribution of average point scores for entrants from non-selective secondary schools (, in gray) and selective secondary schools(c, in blue). The gray and blue lines ina)show the fitted regression lines for non-selective secondary schools (gray) and selective secondary schools (blue), for candidates with AAA at A-level (top, thickest line), down through AAB and ABB to BBB (lowest, thinnest line). Average point scores are grouped into four groups, indicated by vertical dashed lines, and mean entry scores, with 95% CI, are shown for entrants from non-selective secondary schools (black squares) and selective secondary schools (blue circles), the largest squares/circles for AAA, the medium squares/circles for AAB, and the smallest squares/circles for ABB. Groups with small N and, hence, large CIs are omitted.
McManuset al. BMC Medicine 2013, 11:244 Page 17 of 25
Identifying students in the four outcome groups
Although medical school performance is a continuous measure, students eventually end up in one of four cat-egories, OutcomeFirstYear4pt, with the lower categories having important consequences for the students and their careers. We, therefore, compared the four groups on UKCAT scores and the measures of prior educational at-tainment. Table 4 shows comparison between the groups using one-way analysis of variance. The overall pattern is that the students who perform less well tend to score lower on the various measures. An exception is that in several cases the group who had failed showed scores that were higher than those who are repeating the first year, as for instance, on measures of prior educational attainment and on several of the UKCAT scores. That may be because the group of failures is not homogenous. Numbers in the Fail group are relatively small, with 55 leaving for aca-demic reasons and 49 for non-acaaca-demic reasons (although reasons for leaving medical school are often complex and not readily classified [46]). A comparison is available in the Technical Report [34].
Differences between medical schools assessed using multilevel modeling
Medical schools differ [47], and it is possible that vari-ables which predict outcome in one medical school will
predict better or worse in other medical schools. The 12 medical schools in UKCAT-12 allow such possibilities to be assessed. The analyses will begin with a model of the importance of educational achievement, which will be described in some detail, and then a number of other factors will be considered as well.
Prior educational achievement
A three-level model is fitted (see Figure 5), with individ-ual students at the first level, who are nested within the 12 medical schools at the second level, which in turn at the third level are nested within either Scotland or else-where. Note that because zEducationalAttainment is not available for mature students, this analysis is re-stricted to non-mature students. The outcome variable is OverallMark, which is standardized within medical schools and cohorts (and hence overall effects typically have means close to zero). The main predictor is zEducationalAttainment. A dummy variable, at the stu-dent level, SQAorGCE indicates whether students took SQA or GCE qualifications (and it has already been sug-gested that SQA attainment predicts medical school out-come better than GCE attainment).OverallMarkcan be predicted at level-1 by zEducationalAttainment and SQAorGCE, and by their interaction. The slope of the regression ofOverallMarkonzEducationalAttainment and SQAorGCE, and their interaction can also show variance between medical schools and between Scottish and non-Scottish medical schools. Figure 5 shows the full fitted model, estimates being shown with their standard errors in parentheses, so that estimates are significantly different from zero with P <.05 on a two-tailed test if their value is at least twice their standard error (and these are indicated in Figure 5).zEducationalAttainment is a strong indicator of OverallMark, the interaction with SQA qualifications is also significant, predicting OverallMark more strongly than do GCE qualifications. No other terms are significant, which in particular means a) that educational achievement has the same predictive value in all 12 medical schools, irrespective of whether they are in Scotland or elsewhere, and b) the increased predictive effect of SQA qualifications is the same in all medical schools, in Scotland or elsewhere. The important conclusion is that although medical schools might have differed in the predictive value of educational attainment, perhaps because of differences in teaching methods, cur-riculum or whatever, there is no evidence that they do so.
Sex, secondary schooling and ethnicity
The three-level model forzEducationalAttainmentwas fitted with the addition of sex, the contextual secondary school attainment measure DFES.AvePointEntry, and ethnicity (White), as well as the interactions of those measures with zEducationalAttainment. After taking Figure 4Scattergram showing relationship between
OverallMark at medical school, and UKCAT score (standardised within medical schools).Mature students (green) and non-mature students (blue) are shown separately, along with fitted linear regression functions. The crossing of the two lines is at about 2.5 standard deviations below the mean, so that at almost all candidate ability levels, mature students outperform non-mature students, with a steeper slope for mature students.
McManuset al. BMC Medicine 2013, 11:244 Page 18 of 25
zEducationalAttainment into account, male students underperformed (estimate =−.0699, SE .0309), non-White students underperformed (estimate =−.2504, SE = .0357), and students from secondary schools with a higherDFES. AvePointEntry, score (that is, higher-attaining secondary schools) performed less well overall (estimate = −.1112, SE = .0183). There was no evidence that any of the mea-sures interacted with educational attainment and particu-larly important for interpreting these results is that there was no evidence, for any of the three measures, of vari-ance between the 12 medical schools. In other words, males, for instance, underperformed to the same extent in all 12 medical schools, which is important for understand-ing and interpretunderstand-ing such effects.
UKCAT scores and age
Multilevel modeling of the prediction of UKCATtotal, as well as the subscores, was broadly similar to that for educational attainment, except that differences between medical schools in Scotland and elsewhere were not considered, so that the model had two levels. Age of students (<21, 21+) was included as a previous analysis suggested that UKCAT predicted better in mature stu-dents. The overall fitted model is shown in Figure 6. UKCAT significantly predicts outcome (estimate = .1295, SE .0174). Mature students also perform better than non-mature students (.3315, SE .0738), and there is a significant interaction between maturity and UKCAT, UKCAT predicting more strongly in mature students (estimate = .1208 SE .0548). There was no evidence that UKCAT, age or the interaction of UKCAT and age
behaved differently in their predictive ability at any of the 12 medical schools.
UKCAT and sex, secondary schooling and ethnicity
As before, sex, the contextual secondary school attainment measure DFES.AvePointEntry, and ethnicity (White) were added into the model, as also were their interac-tions with UKCAT. Level-2 effects for each term were also considered, but none were significant, indicating that the measures behaved similarly in all of the 12 medical schools. Level 2 effects were, therefore, re-moved from the model. At level 1, and after taking UKCAT into account and with educational attainment, there was underperformance by male students (−.0927 SE .0379), non-White students (−.2888 SE .0371), and those from high achieving secondary schools (−.0493, SE .0184). The only significant interaction with UKCAT was for male sex (−.0756 SE .0321), UKCAT having a stronger prediction of outcome in female students than male students.
Discussion
The primary focus of UKCAT-12, the first large-scale, collaborative UK study involving 12 medical schools, was to assess the predictive validity of the UKCAT test of aptitude for medical school. A key strength is the large sample size of nearly 5,000 medical students which provides adequate statistical power for answering ques-tions that a single medical school or a single cohort could not, as well as providing answers that are likely to generalize to other medical schools. In addition, the Figure 5Multilevel modeling of relationship of OverallMark at medical school to Educational Attainment (zEducationalAttainment). See text for details.
McManuset al. BMC Medicine 2013, 11:244 Page 19 of 25