R E S E A R C H A R T I C L E
Open Access
Effect of large weight reductions on
measured and estimated kidney function
Bernt Johan von Scholten
1*, Frederik Persson
1, Maria S. Svane
2, Tine W. Hansen
1, Sten Madsbad
2and Peter Rossing
1,3,4Abstract
Background:When patients experience large weight loss, muscle mass may be affected followed by changes in plasma creatinine (pCr). The MDRD and CKD-EPI equations for estimated GFR (eGFR) include pCr. We hypothesised that a large weight loss reduces muscle mass and pCr causing increase in eGFR (creatinine-based equations), whereas measured GFR (mGFR) and cystatin C-based eGFR would be unaffected if adjusted for body surface area. Methods:Prospective, intervention study including 19 patients. All attended a baseline visit before gastric bypass surgery followed by a visit six months post-surgery. mGFR was assessed during four hours plasma51Cr-EDTA clearance. GFR was estimated by four equations (MDRD, CKD-EPI-pCr, CKD-EPI-cysC and CKD-EPI-pCr-cysC). DXA-scans were performed at baseline and six months post-surgery to measure changes in lean limb mass, as a surrogate for muscle mass.
Results:Patients were (mean ± SD) 40.0 ± 9.3 years, 14 (74%) were female and 5 (26%) had type 2 diabetes, baseline weight was 128 ± 19 kg, body mass index 41 ± 6 kg/m2 and absolute mGFR 122 ± 24 ml/min. Six months post-surgery weight loss was 27 (95% CI: 23; 30) kg, mGFR decreased by 9 (−17;−2) from 122 ± 24 to 113 ± 21 ml/ min (p= 0.024), but corrected for current body surface area (BSA) mGFR was unchanged by 2 (−5; 9) ml/min/1. 73 m2(p= 0.52). CKD-EPI-pCr increased by 12 (6; 17) and MDRD by 13 (8; 18) (p< 0.001 for both), while CKD-EPI-cysC was unchanged by 2 (−8; 4) ml/min/1.73 m2(p= 0.51). Lean limb mass was reduced by 3.5 (−4.4;−2.6;p< 0. 001) kg and change in lean limb mass correlated with change in plasma creatinine (R2= 0.28,p= 0.032).
Conclusions:Major weight reductions are associated with a reduction in absolute mGFR, which may reflect resolution of glomerular hyperfiltration, while mGFR adjusted for body surface area was unchanged. Estimates of GFR based on creatinine overestimate renal function likely due to changes in muscle mass, whereas cystatin C based estimates are unaffected.
Trial registration:ClinicalTrials.gov, NCT02138565. Date of registration: March 24, 2014.
Keywords:Glomerular filtration rate, Bariatric surgery, Creatinine, Muscle mass, Cystatin C, DXA scan
Background
Accurate assessment of glomerular filtration rate (GFR) is important, both to evaluate the progression of renal dis-ease, and to monitor the effect of intervention on kidney function as well as to inform drug dosing and patient counselling. However, optimal methods of measuring kidney function in the setting of obesity or longitudinally in the setting of weight change are uncertain.
Plasma creatinine is frequently used to estimate GFR, since it has proven to be an inexpensive and reliable index of kidney function. The primary determinant of creatinine generation/production is skeletal muscle mass where the final catabolite of muscular energetic metabol-ism is creatinine [1]. Hence, if body weight - and muscle mass in particular - changes over time and leads to changes in plasma creatinine, this may affect estimates of kidney function, without actual changes in accurately measured GFR. Whether these factors impact eGFR could depend on the equations applied, as the 4-variable Modification of Diet in Renal Disease (MDRD) [2] and
* Correspondence:[email protected]
1Steno Diabetes Center Copenhagen, Niels Steensens Vej 1, 2820 Gentofte,
Denmark
Full list of author information is available at the end of the article
Chronic Kidney Disease Epidemiology Collaboration (CKD-EPI) [3] equations include plasma creatinine and would not be affected body weight changes alone. Cysta-tin C is a filtration marker that is less influenced by changes in muscle mass and may be a more suitable marker of renal function in subjects experiencing fast and large weight reductions [4]. In this prospective inter-vention study, we investigated the effect of a large weight loss (after Roux-en-Y gastric bypass surgery (RYGB)) on measured GFR (mGFR) (51Cr-EDTA plasma clearance) and on estimated GFR (using both plasma creatinine and cystatin C). Dual energy X-ray absorpti-ometry (DXA)-scans were performed before and after RYGB to estimate changes in skeletal muscle mass.
We hypothesised that a large weight loss reduces muscle mass (lean limb mass) and plasma creatinine leading to increases in eGFR (creatinine-based equa-tions), whereas mGFR and cystatin C-based eGFR would be unaffected when adjusted for the change in body sur-face area (BSA).
Methods
Participants and study design
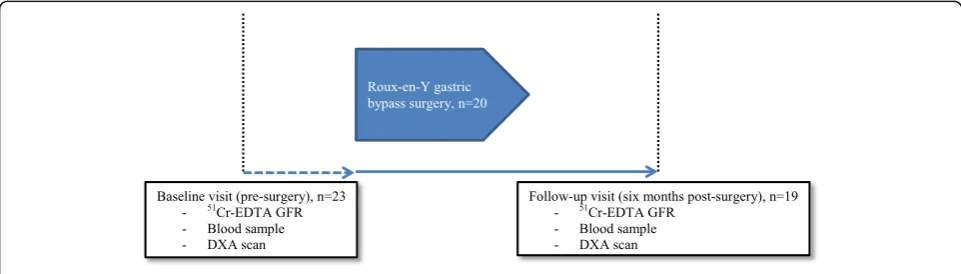
This prospective, open-label intervention study included 23 obese patients all scheduled for RYGB at Hvidovre University Hospital, Denmark. Three patients never had the surgery performed and one patient declined to par-ticipate in the post-surgery visit. Therefore, a total of 19 patients completed the study. Type 2 diabetes was diag-nosed according to the WHO criteria.
Patients were recruited from March 2014 and the study was completed in June 2016.
The study design is illustrated in Fig. 1. Patients attended the baseline visit within two weeks prior to the scheduled RYGB and the follow-up visit was performed six months (±2 weeks) after RYGB.
The study protocol was approved by the regional eth-ics committee and was conducted according to the Dec-laration of Helsinki. All patients gave written informed
consent before any study procedure was initiated. The study is registered at ClinicalTrials.gov with identifier NCT02138565. The two study-related visits were con-ducted at Steno Diabetes Center, Gentofte, Denmark, and the RYGB was performed at Hvidovre University Hospital, Hvidovre, Denmark as described previously [5].
The primary aim was to assess the effect of a large weight reduction on measured GFR (51Cr-EDTA plasma clearance) and on estimated GFR (applying different equations based on plasma creatinine or cystatin C). Secondly, we assessed the effect on body composition (determined by DXA-scan) in order to relate these changes with changes in renal outcome measures.
Outcome measurements
Renal function (mGFR) and extracellular volume were assessed during four hours measurement of plasma 51
Cr-EDTA clearance by standard methods [6]. 51 Cr-EDTA was performed within two weeks prior to RYGB and six months (± two weeks) after surgery.
For the present study, mGFR was represented by two approaches: 1) Absolute mGFR, where mGFR was pre-sented as the raw mGFR (ml/min) and 2) mGFR cor-rected for concurrent body surface area (BSA): BSA-corrected mGFR (ml/min/1.73 m2).
For the estimation of BSA we used the Du Bois & Du Bois formula [7].
IDMS-traceable plasma creatinine was analysed using the enzymatic Creatinine Plus method (Vitros 5600, Or-tho Clinical Diagnostics, Illkirch Cedex, France). Stan-dardized plasma cystatin C was analyzed on the Cobas 8000® (Roche Diagnostics, Indianapolis, IN).
Estimated GFR was calculated by four equations: 1) Creatinine equation (MDRD 1999): MDRD eGFR [2]; 2) Creatinine equation (EPI 2009): CKD-EPI-pCr eGFR [3]; 3) Cystatin C equation (CKD-EPI 2012): CKD-EPI-cysC eGFR [8]; and 4) Creatinine-cystatin C equation (CKD-EPI 2012): CKD-EPI-pCr-cysC eGFR [8].
DXA measurements of body composition were per-formed in all patients at baseline and six months after surgery using a Hologic Discovery A, series 82800-A (Hologic, Bedford, MA, USA).
The following parameters were obtained: Lean body mass (in kg), lean limb mass (in kg), fat mass (in kg) and fat mass (in percent). Lean limb mass is consid-ered the best surrogate measure of skeletal muscle mass and was calculated as the total non-bone and non-fat lean mass of the extremities: Lean mass of left arm + lean mass of right arm + lean mass left leg + lean mass of right leg [9].
Urinary albumin-to-creatinine ratio (UACR) was cal-culated as the geometric mean of three consecutive morning spot urine samples performed at baseline and six months after surgery.
Twenty-four-hour blood pressure was performed at baseline and six months after surgery using BPro (HealthStats, Singapore), a watch-like device that cap-tures radial pulse wave reflection and calculates bra-chial 24–h BP. BPro has been validated in people with diabetes and meets the European Society of Hypertension and Association for the Advancement of Medical Instrumentation standards [10, 11]. Mean of systolic and diastolic blood pressure and heart rate was calculated using all readings during the 24 h. Only 24-h blood pressure recordings with≥20 read-ings during daytime and≥7 during night-time were used for analysis. One recording was incomplete and was discarded for the analysis.
The urinary albumin concentration of the morning spot samples was analysed using a turbidimetric immunoassay (Vitros 5600, Ortho Clinical Diagnostics, Illkirch Cedex, France).
Statistical analysis
Outcome measures are presented as mean (SD) and skewed data (UACR) are shown as geometric mean (IQR), and analysed after log-transformation.
The change in outcome measures was analysed from levels at baseline to six months after surgery and com-pared using the paired samples t-tests.
Associations between changes in outcome mea-sures were assessed by linear regression models. The proportion of the variability explained by the models is presented as the R2. Due to the exploratory nature of the study, no power calculation was performed, however based on a previous related study, we anticipated that a total of 20 subjects would be suffi-cient [12].
Two-sided p-values < 0.05 were considered statistical significant. Statistical analysis was performed using IBM SPSS 23.0 (IBM Amonk NY, USA).
Results
Baseline demographics
Patients were (mean ± SD) 40 ± 9 years, 14 (74%) were female and 5 (26%) had type 2 diabetes. Baseline weight was 128 ± 19 kg, body mass index 41 ± 6 kg/m2, absolute mGFR 122 ± 24 ml/min and CKD-EPI-pCr eGFR 93 ± 18 ml/min/1.73 m2. Six patients received antihyperten-sive treatment at baseline and no changes were pre-scribed during the course of the study.
Renal outcome measures
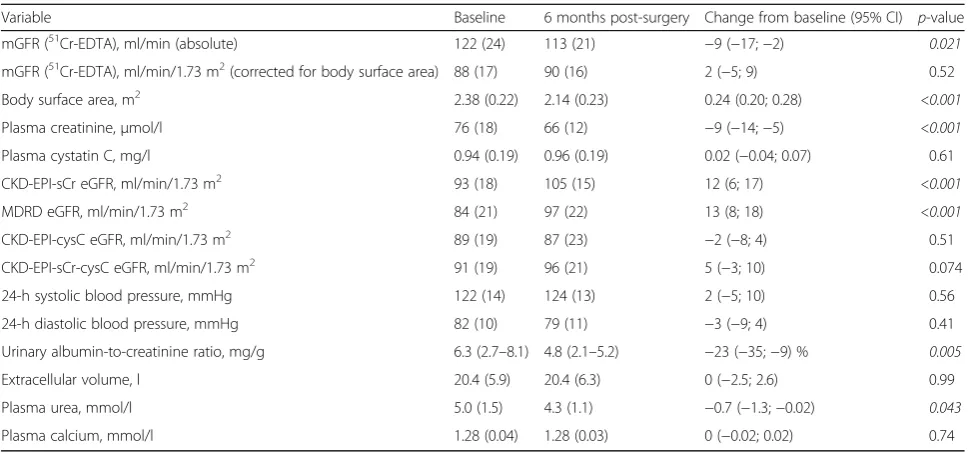
Six months after RYGB, absolute GFR was reduced by mean 9 (95% confidence interval: 2; 17;p= 0.021) ml/min, while BSA-corrected GFR was unchanged by 2 (−5; 9;p= 0.52) ml/min/1.73 m2(Table 1).
Plasma creatinine was reduced by 9 (5; 14; p< 0.001) μmol/l, and plasma cystatin C was unchanged by 0.02 (−0.04; 0.07; p= 0.61) six months after RYGB. MDRD eGFR increased by 13 (8; 18;p< 0.001) ml/min/1.73 m2, CKD-EPI-pCr eGFR increased by 12 (6; 17; p< 0.001) ml/min/1.73 m2, and CKD-EPI-pCr-cysC eGFR was un-changed by 5 (−0.5; 10; p= 0.074) ml/min/1.73 m2. CKD-EPI-cysC eGFR was unchanged by 2 (−8; 4; p= 0.51) ml/min/1.73 m2. Plasma urea was reduced by 0.7 (−1.3; −0.02; p= 0.043) mmol/l and UACR was reduced by 23 (−35;−9;p= 0.005) %, while extracellular volume was unchanged (p= 0.99) (Table 1).
Weight loss and body composition outcome measures
Six months after RYGB weight was reduced by mean 27 (23; 30; p< 0.001) kg or 21 (18; 24; p< 0.001) % and body mass index was reduced by 8 (−10; −7; p< 0.001) kg/m2. Lean limb mass was reduced by 3.5 kg (−4.4;
−2.6; p< 0.001) kg, lean body mass was reduced by 6.5 (−7.9; −5.0; p< 0.001) kg, and fat mass was reduced by 20 (−23;−18;p< 0.001) kg (Table 2).
Linear correlations
At baseline, BSA-corrected mGFR correlated significantly with plasma creatinine and with all estimates of GFR (R2≥0.25,p≤0.029), except for MDRD (p= 0.093). After RYGB, BSA-corrected mGFR correlated with plasma cre-atinine and all estimates of GFR (R2≥0.34, p≤0.011). Change in BSA-corrected mGFR correlated with change in plasma creatinine and MDRD eGFR (R2= 0.24, p≤ 0.048) and not with changes in other renal measures.
Lean limb mass correlated significantly with plasma cre-atinine at baseline (R2= 0.28, p= 0.025) and after RYGB (R2= 0.37,p= 0.010). Change in lean limb mass correlated with change in plasma creatinine (R2= 0.28,p= 0.032) and with change in UACR (R2= 0.28,p= 0.034).
correlated with change in UACR (R2= 0.38, p= 0.011), and not with change in plasma creatinine or other renal measures (p≥0.38).
Discussion
In this prospective intervention study investigating the effects of a fast and large (mean 27 kg) weight loss, ob-tained by Roux-en-Y gastric bypass surgery, we found a reduction in absolute mGFR, while BSA-corrected mGFR was unchanged. Plasma creatinine was reduced causing increases in creatinine-based eGFR (MDRD and CKD-EPI), while cystatin C-based eGFR was unchanged (all adjusted for BSA). Lean limb mass, a surrogate measure of skeletal muscle mass, was reduced by mean 3.5 kg and might explain the reduction in plasma cre-atinine, since we found a significant correlation between these changes.
Monitoring GFR is important for diagnosis and moni-toring of patients with kidney disease. Furthermore, it is often used for dosage of drugs, mainly for safety reasons. Numerous equations based on plasma creatinine have
been suggested for estimation of GFR and when com-pared to accurately measured GFR, particularly MDRD and CKD-EPI have been proven to be reliable. Of note, creatinine-based eGFR equations have not been vali-dated in morbidly obese adults or in patients with change in body composition after RYGB [13]. Cystatin C is less affected by muscle mass and diet than is creatin-ine, while reports have found an association between cystatin C concentrations and body weight and fat mass [14–17]. In our study, cystatin C levels tended to be as-sociated with body weight, but were not asas-sociated with fat mass, fat percent or body mass index (data not shown). Nonetheless, it has been anticipated that cysta-tin C would provide a more accurate estimate of GFR than creatinine [18]. Measuring GFR by inulin-clearance [19], chromium-EDTA clearance [6] or iohexol clearance [20] is considered the“gold standard” of GFR. However, it is expensive and time consuming (usually a four hour examination), and therefore not realistic as a routine measurement in clinical practice or in large-scale stud-ies. Whether mGFR should be presented absolute or
Table 1Renal outcome measures
Variable Baseline 6 months post-surgery Change from baseline (95% CI) p-value
mGFR (51Cr-EDTA), ml/min (absolute) 122 (24) 113 (21) −9 (−17;−2) 0.021
mGFR (51Cr-EDTA), ml/min/1.73 m2(corrected for body surface area) 88 (17) 90 (16) 2 (−5; 9) 0.52
Body surface area, m2 2.38 (0.22) 2.14 (0.23) 0.24 (0.20; 0.28) <0.001
Plasma creatinine,μmol/l 76 (18) 66 (12) −9 (−14;−5) <0.001
Plasma cystatin C, mg/l 0.94 (0.19) 0.96 (0.19) 0.02 (−0.04; 0.07) 0.61
CKD-EPI-sCr eGFR, ml/min/1.73 m2 93 (18) 105 (15) 12 (6; 17) <0.001
MDRD eGFR, ml/min/1.73 m2 84 (21) 97 (22) 13 (8; 18) <0.001
CKD-EPI-cysC eGFR, ml/min/1.73 m2 89 (19) 87 (23) −2 (−8; 4) 0.51
CKD-EPI-sCr-cysC eGFR, ml/min/1.73 m2 91 (19) 96 (21) 5 (−3; 10) 0.074
24-h systolic blood pressure, mmHg 122 (14) 124 (13) 2 (−5; 10) 0.56
24-h diastolic blood pressure, mmHg 82 (10) 79 (11) −3 (−9; 4) 0.41
Urinary albumin-to-creatinine ratio, mg/g 6.3 (2.7–8.1) 4.8 (2.1–5.2) −23 (−35;−9) % 0.005
Extracellular volume, l 20.4 (5.9) 20.4 (6.3) 0 (−2.5; 2.6) 0.99
Plasma urea, mmol/l 5.0 (1.5) 4.3 (1.1) −0.7 (−1.3;−0.02) 0.043
Plasma calcium, mmol/l 1.28 (0.04) 1.28 (0.03) 0 (−0.02; 0.02) 0.74
Values represent mean (SD) or geometric mean (IQR) GFRglomerular filtration rate
Table 2DXA outcome measures
Variable Baseline 6 months post-surgery Change from baseline (95% CI) p-value
Lean body mass, kg 66.2 (12.2) 59.7 (13.0) −6.5 (−7.9;−5.0) <0.001
Lean body mass + bone mineral content, kg 69.1 (12.4) 62.6 (13.3) −6.5 (−7.9;−5.0) <0.001
Lean limb mass, kg 30.6 (6.5) 27.1 (6.6) −3.5 (−4.4;−2.6) <0.001
Fat mass, kg 59.0 (12.0) 38.5 (9.9) −20.4 (−23.1;−17.7) <0.001
Fat mass, % 46.1 (5.8) 38.1 (6.2) −7.9 (−9.1;−6.7) <0.001
Weight, kg 128 (19) 101 (18) −27 (−30;−23) <0.001
BSA-corrected (expressed as per 1.73 m2) in the setting of obesity is still unclear and may depend on the situation [13]. However, studies have indeed questioned the use of BSA-correction and concluded that data obtained for GFR indexed by BSA should either be avoided or interpreted with caution, especially in obese subjects [21, 22]. Due to the limitations of BSA-correction, the extracellular vol-ume has been proposed as a better parameter for body size adjustment of GFR than BSA [23]. In our study, the extracellular volume was essentially unchanged six months after RYGB, hence mGFR adjusted for extracellu-lar volume was reduced. However GFR indexed with extracellular volume is currently not recommended [24].
Taken together, the optimal methods of measuring kidney function in obese subjects and after weight changes are de-bated but still indeterminate. The purpose of the present study was to obtain a better understanding of how a large weight loss influence measured and estimated kidney func-tion. The study hypothesis was that change in creatinine-based eGFR would be different than change in mGFR, since a large weight reduction would lead to a reduction in muscle mass affecting plasma creatinine levels without impacting BSA-corrected mGFR. Our primary findings were that abso-lute mGFR was reduced, BSA-corrected mGFR and cystatin C-based eGFR were unchanged, while creatinine-based eGFR was increased after a weight reduction of mean 27 kg. By applying robust methods for determination of body com-position, we were able to demonstrate that changes in muscle mass correlated with changes in plasma creatinine. This suggests that for monitoring changes in renal function over time in patients experiencing a large weight loss, cysta-tin C-based estimates of GFR may be more useful.
Other studies have demonstrated similar results. In a study of 37 patients, a weight loss of 37 kg six months after surgery was associated with a significant reduction in mean creatinine, and accordingly an increase in MDRD, while Cockcroft Gault eGFR (including both creatinine and body weight) was decreased [25]. A small prospective study demonstrated that BSA-corrected mGFR, determined using clearance of iothalamate, was reduced in a cohort of 11 women during the first year after bariatric surgery. Notably, serum creatinine and creatinine-based eGFR did not identify this change in renal function, which was explained by a large reduction in creatinine production. Preoperatively, the CKD-EPI equation underestimated mGFR; postoperatively, mGFR was overestimated due to the reduction in body weight and muscle mass [12]. Of note, these studies did not measure actual changes in body composition. In a recent pooled analysis including more than 5000 patients, we assessed whether a pharmaceutically induced weight loss was associated with changes in plasma creatinine. We demonstrated that a “stable” weight reduction of mean 1.9 kg was not associated with a change in plasma
creatinine and concluded, that in patients experiencing a smaller weight reduction, creatinine-based equations (MDRD and CKD-EPI) are unaffected and can be ap-plied [26]. The extent and rate of a weight reduction as-sociated with enough impact on skeletal muscle mass reduction to affect levels of creatinine and eGFR is cur-rently unknown and cannot be determined by the present study. Depending on the magnitude of the weight reductions, a non-creatinine-based equation (e.g. cystatin C) should be considered for these studies, in order to obtain reliable estimates of kidney function.
Our present study expands on previous studies investi-gating the effects of bariatric surgery on mGFR. In studies examining mGFR in patients with normal or supranormal kidney function, absolute mGFR decreased significantly, while the BSA-corrected mGFR was unchanged one year after surgery [13, 27]. In the present study, we can confirm these findings and in a sub-analysis of subjects with hyper-filtration (baseline mGFR > 130 ml/min,n= 5) mGFR was significantly reduced by 24 ml/min (data not shown). This illustrates that the GFR-lowering effect of bariatric surgery is more pronounced in subjects with supranormal baseline levels of mGFR. It has been suggested that the decrease in the absolute mGFR is a resolution of glomerular hyperfil-tration which may result in decreased intraglomerular pressure and kidney injury [13, 27, 28].
In a recent study, including 985 patients treated with bariatric surgery and 985 matched controls, it was con-cluded that patients undergoing bariatric surgery had a 58% lower risk of an eGFR decline≥30% and a 57% lower risk of doubling of serum creatinine or developing end-stage renal disease compared with the controls. Of note, end-stage renal disease occurred in only eight sur-gery and ten non-sursur-gery patients, indicating that the vast majority of the kidney outcomes were based on levels of creatinine [29]. While the study was well-designed and provided valuable information with im-portant clinical implications, a major limitation is the use of a creatinine-based eGFR for determination of kid-ney outcomes, as also highlighted by the authors them-selves. In our study, plasma creatinine was reduced in all patients except two, likely explained by a reduction in muscle mass. We found absolute mGFR and creatinine-based eGFR to change in opposite directions after RYGB. In order to resolve whether bariatric surgery is reducing the risk of adverse kidney outcomes, cystatin C-based eGFR may be a more suitable measure.
Strengths and limitations
reduction. As a result, we are unable to rule out that our findings are not specifically caused by the RYGB-related changes in the renal outcome measures.
Conclusions
Major weight reductions are associated with a reduction in absolute mGFR, which may reflect resolution of glomerular hyperfiltration, while mGFR adjusted for body surface area was unchanged. Estimates of GFR based on plasma creatin-ine overestimate renal function likely due to changes in muscle mass, whereas cystatin C based estimates are un-affected. Our results have important implications for both clinicians and researchers and provide a better understand-ing of the physiology of glomerular filtration rate and emphasize the limitations of using plasma creatinine in the setting of obesity and following weight changes.
Abbreviations
BSA:Body surface area; CKD-EPI: Chronic Kidney Disease Epidemiology Collaboration; CysC: Cystatin C; DXA: Dual energy X-ray absorptiometry; eGFR: Estimated glomerular filtration rate; GFR: Glomerular filtration rate; IQR: Interquartile range; MDRD: Modification of Diet in Renal Disease; mGFR: Measured glomerular filtration rate; RYGB: Roux-en-Y gastric bypass surgery; SD: Standard deviation; UACR: Urinary albumin-to-creatinine ratio
Acknowledgements
We thank all participants and acknowledge the work of study nurse Lone Jelstrup and lab technicians Anne G. Lundgaard, Berit R. Jensen, Tina R. Juhl, and Jessie A. Hermann, employees at Steno Diabetes Center A/S.
Funding
The study was funded by internal grants from Steno Diabetes Center, Gentofte, Denmark.
Availability of data and materials
The datasets used and/or analysed during the current study are available from the corresponding author on reasonable request.
Authors’contributions
BJvS conceived and designed the research, analysed and interpreted the data, performed statistical analysis and wrote the manuscript. FP conceived and designed the research, analysed and interpreted the data, and made critical revision of the manuscript for key intellectual content. MS conceived and designed the research and made critical revision of the manuscript for key intellectual content. TWH made critical revision of the manuscript for key intellectual content. SM conceived and designed the research and made critical revision of the manuscript for key intellectual content. PR conceived and designed the research, analysed and interpreted the data, handled funding and supervision, made critical revision of the manuscript for key intellectual content and supervised the study. BJvS is the guarantor of this work and, as such, had full access to all the data in the study and takes responsibility for the integrity of the data and the accuracy of the data analysis. All authors read and approved the final manuscript.
Competing interests
The authors declare that they have no competing interests.
Consent for publication Not applicable.
Ethics approval and consent to participate
The study protocol was approved by The Research Ethics Committee, Capital Region of Denmark with the protocol number: H-1-2013-074, and the study was conducted according to the Declaration of Helsinki.
All patients gave written informed consent before any study procedure was initiated.
Author details
1Steno Diabetes Center Copenhagen, Niels Steensens Vej 1, 2820 Gentofte,
Denmark.2Hvidovre University Hospital, Hvidovre, Denmark.3University of
Copenhagen, Copenhagen, Denmark.4Aarhus University, Aarhus, Denmark.
Received: 2 November 2016 Accepted: 2 February 2017
References
1. Wyss M, Kaddurah-Daouk R. Creatine and creatinine metabolism. Physiol Rev. 2000;80(3):1107–213.
2. Levey AS, Bosch JP, Lewis JB, Greene T, Rogers N, Roth D. A more accurate method to estimate glomerular filtration rate from serum creatinine: a new prediction equation. Modification of Diet in Renal Disease Study Group. Ann Intern Med. 1999;130:461–70.
3. Levey AS, Stevens LA, Schmid CH, Zhang YL, Castro III AF, Feldman HI, et al. A new equation to estimate glomerular filtration rate. Ann Intern Med. 2009;150(9):604–12.
4. Newman DJ, Cystatin C. Ann Clin Biochem. 2002;39(Pt 2):89–104. 5. Svane MS, Jorgensen NB, Bojsen-Moller KN, Dirksen C, Nielsen S, Kristiansen
VB, et al. Peptide YY and glucagon-like peptide-1 contribute to decreased food intake after Roux-en-Y gastric bypass surgery. Int J Obes (Lond). 2016; 40(11):1699–706.
6. Bröchner-Mortensen J. A simple method for the determination of glomerular filtration rate. Scand J Clin Lab Invest. 1972;30:271–4. 7. Du Bois D, Du Bois EF. A formula to estimate the approximate surface area
if height and weight be known. Arch Intern Med. 1916;17:863–71. 8. Inker LA, Schmid CH, Tighiouart H, Eckfeldt JH, Feldman HI, Greene T, et al.
Estimating glomerular filtration rate from serum creatinine and cystatin C. N Engl J Med. 2012;367(1):20–9.
9. Newman AB, Kupelian V, Visser M, Simonsick EM, Goodpaster BH, Kritchevsky SB, et al. Strength, but not muscle mass, is associated with mortality in the health, aging and body composition study cohort. J Gerontol A Biol Sci Med Sci. 2006;61(1):72–7.
10. Theilade S, Joergensen C, Persson F, Lajer M, Rossing P. Ambulatory tonometric blood pressure measurements in patients with diabetes. Diabetes Technol Ther. 2012;14(6):453–6.
11. Nair D, Tan SY, Gan HW, Lim SF, Tan J, Zhu M, et al. The use of ambulatory tonometric radial arterial wave capture to measure ambulatory blood pressure: the validation of a novel wrist-bound device in adults. J Hum Hypertens. 2008;22(3):220–2.
12. Lieske JC, Collazo-Clavell ML, Sarr MG, Rule AD, Bergstralh EJ, Kumar R. Gastric bypass surgery and measured and estimated GFR in women. Am J Kidney Dis. 2014;64(4):663–5.
13. Friedman AN, Moe S, Fadel WF, Inman M, Mattar SG, Shihabi Z, et al. Predicting the glomerular filtration rate in bariatric surgery patients. Am J Nephrol. 2014;39(1):8–15.
14. Tangri N, Stevens LA, Griffith J, Tighiouart H, Djurdjev O, Naimark D, et al. A predictive model for progression of chronic kidney disease to kidney failure. JAMA. 2011;305(15):1553–9.
15. Stevens LA, Schmid CH, Greene T, Li L, Beck GJ, Joffe MM, et al. Factors other than glomerular filtration rate affect serum cystatin C levels. Kidney Int. 2009;75(6):652–60.
16. Vinge E, Lindergard B, Nilsson-Ehle P, Grubb A. Relationships among serum cystatin C, serum creatinine, lean tissue mass and glomerular filtration rate in healthy adults. Scand J Clin Lab Invest. 1999;59(8):587–92.
17. Chew-Harris JS, Florkowski CM, George PM, Elmslie JL, Endre ZH. The relative effects of fat versus muscle mass on cystatin C and estimates of renal function in healthy young men. Ann Clin Biochem. 2013;50(Pt 1):39–46.
18. Shlipak MG, Matsushita K, Arnlov J, Inker LA, Katz R, Polkinghorne KR, et al. Cystatin C versus creatinine in determining risk based on kidney function. N Engl J Med. 2013;369(10):932–43.
19. Berger EY, Farber SJ, Earle Jr DP. Comparison of the constant infusion and urine collection techniques for the measurement of renal function. J Clin Invest. 1948;27(6):710–6.
20. Krutzen E, Back SE, Nilsson-Ehle I, Nilsson-Ehle P. Plasma clearance of a new contrast agent, iohexol: a method for the assessment of glomerular filtration rate. J Lab Clin Med. 1984;104(6):955–61.
22. Delanaye P, Mariat C, Cavalier E, Krzesinski JM. Errors induced by indexing glomerular filtration rate for body surface area: reductio ad absurdum. Nephrol Dial Transplant. 2009;24(12):3593–6.
23. Peters AM. Expressing glomerular filtration rate in terms of extracellular fluid volume. Nephrol Dial Transplant. 1992;7(3):205–10.
24. Delanaye P, Radermecker RP, Rorive M, Depas G, Krzesinski JM. Indexing glomerular filtration rate for body surface area in obese patients is misleading: concept and example. Nephrol Dial Transplant. 2005;20(10):2024–8. 25. Getty JL, Hamdallah IN, Shamseddeen HN, Wu J, Low RK, Craig J, et al.
Changes in renal function following Roux-en-Y gastric bypass: a prospective study. Obes Surg. 2012;22(7):1055–9.
26. von Scholten BJ, Orsted DD, Svendsen AL, Persson F, Rossing P. The influence of pharmaceutically induced weight changes on estimates of renal function: A patient-level pooled analysis of seven randomised controlled trials of glucose lowering medication. J Diabet Complications. 2015;29(8):1146–51.
27. Chagnac A, Weinstein T, Herman M, Hirsh J, Gafter U, Ori Y. The effects of weight loss on renal function in patients with severe obesity. J Am Soc Nephrol. 2003;14(6):1480–6.
28. Brenner BM, Lawler EV, Mackenzie HS. The hyperfiltration theory: a paradigm shift in nephrology. Kidney Int. 1996;49(6):1774–7.
29. Chang AR, Chen Y, Still C, Wood GC, Kirchner HL, Lewis M, et al. Bariatric surgery is associated with improvement in kidney outcomes. Kidney Int. 2016;90(1):164–71.
• We accept pre-submission inquiries
• Our selector tool helps you to find the most relevant journal • We provide round the clock customer support
• Convenient online submission • Thorough peer review
• Inclusion in PubMed and all major indexing services • Maximum visibility for your research
Submit your manuscript at www.biomedcentral.com/submit