Genetics of Aquatic Organisms 2: 35-41 (2018)
www.genaqua.org ISSN 2459-1831 DOI: 10.4194/2459-1831-v2_2_02
PROOF RESEARCH PAPER
© Published by Central Fisheries Research Institute (CFRI) Trabzon, Turkey
Development and assessment of a multiplex PCR assay for genetic analyses
of microsatellite loci in beluga sturgeon,
Huso huso
Introduction
The beluga sturgeon, Huso huso (Linnaeus, 1758), is an anadromous species of the family Acipenseridae historically known from the Caspian, Black, Azov and Adriatic Sea basins. Males reproduce for the first time at 10-15 years and females at 15-18 years. Spawning takes place every 3-4 years from April till June. The complicated pattern of spawning migrations includes one peak in late winter and spring and another one in late summer and autumn (Gesner, Chebanov, & Freyhof, 2010). Individuals migrating in spring spawn in the same year, whereas those migrating in autumn overwinter in the rivers until the following spring. Overfishing at sea and poaching in estuaries and rivers for caviar and meat, spawning habitat losses due to dam construction, inland navigation, and flood protection measures as well as decreased water quality are major threats to the species which resulted in a dramatic decline of its populations (Gesner et al., 2010). The current native wild distribution is restricted to the Black Sea (in the Danube River only) and the Caspian Sea (in the Ural
River only). Consequently, the IUCN Red List of Threatened Species classified the beluga sturgeon as “critically endangered” (Gesner et al., 2010). In the immediate future, the survival of the species depends on an effective fisheries management, supportive stocking, combating illegal fishing in several river systems as well as maintaining the remaining spawning and early life stage habitats.
An effective fisheries management as well as the establishment of broodstocks and subsequently of appropriate breeding schemes for supportive stocking programs requires knowledge on the genetic diversity and structure of the remaining wild populations of beluga sturgeon. Microsatellite loci represent a popular and efficient nuclear DNA marker type for genetic investigations in fishes (Liu & Cordes, 2004), and already demonstrated in other sturgeon species their usefulness for the assessment of population structures (Welsh, Hill, Quinlan, Robinson, & May, 2008; Wozney, Haxton, Kjartanson, & Wilson, 2011) and broodstock management (Henderson-Arzapalo & King, 2002; Boscari, Pujolar, Dupanloup, Corradin, & Congiu, 2014). In the present study we describe the
Klaus Kohlmann
1,* , Mitică Ciorpac
2, Petra Kersten
1, Radu Suciu
2, Elena Taflan
2,
Katarina Tosic
2, Daniela Holostenco
2, Jörn Geßner
11 Leibniz-Institute of Freshwater Ecology and Inland Fisheries, Müggelseedamm 310, 12587 Berlin, Germany
2Danube Delta National Institute for Research and Development, 165 Babadag Str., 820112 Tulcea, Romania
* Corresponding Author: Tel.: +49.30.64181634 E-mail: [email protected]
Received 31 October 2018 Accepted 10 December 2018
Abstract
The survival of the critically endangered beluga sturgeon, Huso huso, depends – among others – on an effective fisheries management and supportive stocking. To gather the necessary knowledge on the genetic diversity and structure of still existing wild populations, microsatellite loci from related sturgeon species were tested for their cross-species amplification ability and species-specific loci were newly isolated using 454 GS-FLX Titanium pyrosequencing. Twelve suitable polymorphic microsatellites could be identified and were characterized in 58 beluga sturgeons (18 farmed; 40 wild). The observed total number of alleles per locus ranged from 4 to 18 with moderate to high levels of polymorphism. The wild individuals were significantly more diverse with a mean number of 8.08 alleles per locus than the farmed ones with 4.33 alleles per locus. In contrast, observed heterozygosities did not differ significantly among both groups. Genic and genotypic differentiation across all loci was highly significant between farmed and wild beluga sturgeons. The high sensitivity and discriminatory power of the
12 loci were proven by a very low overall probability of identity for siblings (PIsib=3.099 × 10⁻⁵) and a high accuracy of
development of a multiplex PCR assay consisting of 12 polymorphic microsatellite loci and assess the variability of these loci in 18 farmed and 40 wild-caught beluga sturgeons.
Materials & Methods
A search in NCBI GenBank
(www.ncbi.nlm.nih.gov/genbank/; last accessed June 12, 2018) revealed 227 DNA sequence records for the pure species Huso huso or its interspecific hybrids and back crosses with sterlet sturgeon, Acipenser ruthenus
(Linnaeus, 1758). However, none of these records comprised microsatellite loci. Therefore, two approaches for the development of such markers were taken: (1) tests of 41 microsatellite loci isolated from related sturgeon species for their cross-species amplification ability in beluga sturgeon, and (2) de novo isolation of microsatellite loci from a beluga sturgeon genomic library by a commercial service (GenoScreen, Lille, France, www.genoscreen.fr).
To prepare the genomic library fin clips were collected from 18 juvenile beluga sturgeons at a German fish farm and the total genomic DNA was isolated using the DNeasy Blood & Tissue Kit (QIAGEN, Hilden, Germany) according to manufacturer´s protocols. Ten DNA isolates were pooled and 1.0 µg of the pooled DNA was used for the isolation of microsatellite loci through 454 GS-FLX Titanium pyrosequencing of enriched DNA libraries as described in Malausa et al. (2011). The bioinformatics program QDD (Meglécz et al., 2010) was used to analyze the sequences. QDD performs all bioinformatics steps for treating raw sequences: removing adapters/vectors, detecting microsatellites, detecting redundancy/possible mobile element association, selecting sequences with target microsatellites, and designing primers. Among 2898 sequences containing a microsatellite motif, 88 bioinformatically validated primer pairs could be designed. Based on our experience with isolation of microsatellite loci in tench, Tinca tinca (Linnaeus, 1758), (Kohlmann & Kersten, 2006), pike-perch,
Sander lucioperca (Linnaeus, 1758), (Kohlmann & Kersten, 2008), stellate sturgeon, Acipenser stellatus
Pallas 1771, (Kohlmann et al., 2017a), sterlet sturgeon (Kohlmann et al., 2017b) and Russian sturgeon,
Acipenser gueldenstaedtii Brandt & Ratzeburg, 1833 (Kohlmann et al., 2018) all sequences with validated primer pairs were ranked according to motif type (tetra- > tri- > di-nucleotide repeats), number of repeats (the higher the better), and PCR product size (>100 bp) considering only sequences with perfect repeats. From this list the 60 top ranking primer pairs were selected for the identification of suitable microsatellites showing consistent amplification, disomic pattern, ease to score, and sufficient variability.
Although the selection procedure of suitable loci was based on separate genotyping of single loci,
protocols for microsatellite amplification were already developed for future use of PCR multiplex kits (QIAGEN, Hilden, Germany) and a peqSTAR 96X Universal Gradient thermocycler (Peqlab, Erlangen, Germany). After suitable loci had been identified the software MultiPLX, version 2.1 (Kaplinski, Andreson, Puurand, & Remm, 2005) was used to analyze PCR primer compatibility and automatically find the optimal multiplexing (grouping) solution. Four different dye labels (Atto 680, BMN-6, Cyanine 5 and DY-751; Biomers.net, Ulm, Germany) were assigned to the forward primers. Genotyping of the microsatellite loci was performed on an eight-capillary sequencer CEQ 8000 (Beckman Coulter, Brea, USA) using the Fragment Analysis module of the GenomeLab™ GeXP Genetic Analysis System, version 10.2 (Beckman Coulter, Brea, USA).
The microsatellite variability was examined in the 18 farmed individuals at first but later on extended to samples from 40 wild beluga sturgeons collected in the lower Danube River, Romania during 2004 to 2016. The wild spawners were captured according to the Appendix 1 of the joint Ministerial Order 330/262/2006 (republished by Ord. 82/2012). Shortly after spawning, all individuals were released back into the Danube River. All young-of-the-year (YOY) and juvenile beluga sturgeons captured alive were released after sampling and biometric survey. Tissue samples for genetic analyses were collected from live individuals by minimal invasive sampling (small fragments of the anal fin). No animals were killed during the sampling procedure.
Kohlmann et al. / GenAqua 2: 35-41 (2018) 37
Results & Discussion
In addition to the 41 microsatellites from related sturgeon species, 60 de novo isolated beluga sturgeon microsatellite loci were chosen for testing. Among these 101 PCR primer pairs, 12 amplified loci that matched our selection criteria, in particular consistent amplification, disomic pattern and sufficient variability. Four loci (Aox45, AoxD32, AoxD54 and
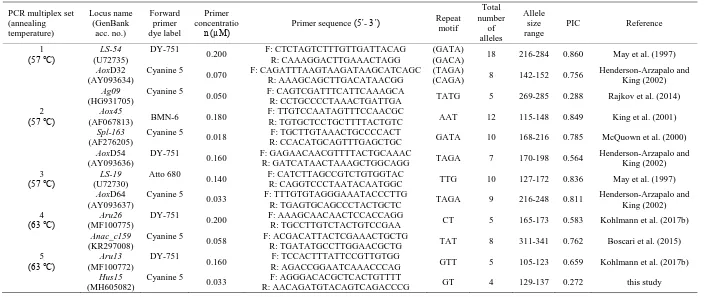
AoxD64) originated from Atlantic sturgeon (Acipenser oxyrinchus Mitchill, 1815), two loci (LS-19 and LS-54) from lake sturgeon (Acipenser fulvescens Rafinesque, 1817), two loci (Aru13 and Aru26) from sterlet sturgeon, one locus (Anac_c159) from Adriatic sturgeon (Acipenser naccarii Bonaparte, 1836), one locus (Ag09) from Russian sturgeon, one locus ( Spl-163) from shovelnose sturgeon (Scaphirhynchus platorynchus (Rafinesque, 1820)), and only one locus (Hus15) from the beluga sturgeon genomic library of the present study. These 12 loci were combined into five multiplex PCR sets based on primer compatibility (Table 1).
Optimized PCR reaction mixes consisted of 5.0 µl of master mix and 1.5 µl Q-solution (QIAGEN, Hilden, Germany), 1.0 µl DNA isolate, primers with concentrations as stated in Table 1, and PCR-grade water up to a final volume of 10.0 µl. The PCR program based on QIAGEN recommendations included an initial denaturation at 95 °C for 15 min followed by 30 cycles of denaturation at 94 °C for 30 s, annealing at 57 °C (multiplex sets 1, 2 and 3), or 63 °C (multiplex sets 4 and 5) for 90 s, and extension at 72 °C for 60 s. A final extension at 60 °C lasted for 30 min.
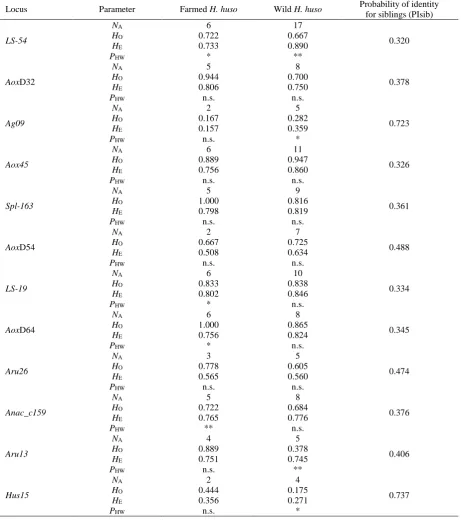
Tests with the Micro-Checker software did not reveal any evidence for scoring errors due to stutter bands or large allele dropout. Moreover, no indications for null alleles were found at any of the 12 loci of the 18 farmed individuals. In contrast, homozygote excess was observed at three loci (LS-54, Aru13 and Hus15) of the 40 wild beluga sturgeons possibly due to null alleles being present at these loci. The observed total number of alleles per locus ranged from 4 to 18 (Table 1) with an average of 8.42. PIC values indicated high levels of polymorphism (PIC>0.500) at ten loci and moderate levels (PICs of 0.272 and 0.288) at the remaining two loci (Table 1). The farmed beluga sturgeons possessed 2 to 6 alleles per locus with a mean number of 4.33; the wild individuals were more variable with 4 to 17 alleles per locus and a mean number of 8.08 (Table 2). Observed heterozygosities ranged from 0.167 at locus Ag09 to 1.000 at loci Spl-163 and AoxD64 in the farmed and from 0.175 at locus
Hus15 to 0.947 at locus Aox45 in the wild individuals (Table 2). Differences between the two beluga sturgeon groups were highly significant for mean number of alleles per locus (P=0.003; two-sided t test), but non-significant for mean observed heterozygosity (P=0.260; two-sided t test). Significant (P<0.05) to
highly significant (P<0.01) deviations from Hardy-Weinberg equilibrium were found at four loci in the farmed as well as four loci in the wild beluga sturgeons (Table 2). However, only one locus (LS-54) deviated in both groups. The observed deviations from Hardy-Weinberg equilibrium might be caused by the relatively small sample size in case of the farmed beluga sturgeons (n=18) or the possible presence of null alleles and an unequal representation of sampling years in case of the wild beluga sturgeons (the number of individuals per year ranged from 1 to 9).
Genic as well as genotypic differentiation across all loci was highly significant between farmed and wild beluga sturgeons. The probability of identity for siblings (PIsib) at single microsatellite loci ranged from 0.320 at locus LS-54 to 0.737 at locus Hus15
(Table 2), and the resulting overall PIsib value was very low: 3.099 × 10⁻⁵. A high sensitivity of the 12 microsatellite loci was also demonstrated by self-classification: 57 out of the 58 individuals (=98.3%) were correctly identified; only one wild beluga sturgeon was assigned into the farmed group.
Conclusion
The described five multiplex PCR sets consisting of 12 microsatellite loci provide sufficient variability and discriminatory power in beluga sturgeon. They represent a valuable toolbox which can be used to characterize the genetic diversity and structure of the remaining wild populations, to aid the development of conservation measures, to establish broodstocks and appropriate breeding schemes for supportive stocking programs as well as to monitor genetic changes in farmed strains used for caviar and meat production.
Acknowledgements
Table 1. Characteristics of 12 polymorphic microsatellite loci tested in a total number of 58 Huso huso individuals. PCR multiplex set
(annealing temperature)
Locus name (GenBank
acc. no.)
Forward primer dye label
Primer concentratio
n (µM) Primer sequence (5´- 3´)
Repeat motif
Total number
of alleles
Allele size range
PIC Reference
1 (57 °C)
LS-54 (U72735)
DY-751
0.200 F: CTCTAGTCTTTGTTGATTACAG
R: CAAAGGACTTGAAACTAGG
(GATA)
(GACA) 18 216-284 0.860 May et al. (1997)
AoxD32 (AY093634)
Cyanine 5
0.070 F: CAGATTTAAGTAAGATAAGCATCAGC
R: AAAGCAGCTTGACATAACGG
(TAGA)
(CAGA) 8 142-152 0.756
Henderson-Arzapalo and King (2002) Ag09
(HG931705)
Cyanine 5
0.050 F: CAGTCGATTTCATTCAAAGCA
R: CCTGCCCCTAAACTGATTGA TATG 5 269-285 0.288 Rajkov et al. (2014)
2 (57 °C)
Aox45
(AF067813) BMN-6 0.180
F: TTGTCCAATAGTTTCCAACGC
R: TGTGCTCCTGCTTTTACTGTC AAT 12 115-148 0.849 King et al. (2001)
Spl-163 (AF276205)
Cyanine 5
0.018 F: TGCTTGTAAACTGCCCCACT
R: CCACATGCAGTTTGAGCTGC GATA 10 168-216 0.785 McQuown et al. (2000)
AoxD54 (AY093636)
DY-751
0.160 F: GAGAACAACGTTTTACTGCAAAC
R: GATCATAACTAAAGCTGGCAGG TAGA 7 170-198 0.564
Henderson-Arzapalo and King (2002) 3
(57 °C) (U72730) LS-19
Atto 680
0.140 F: CATCTTAGCCGTCTGTGGTAC
R: CAGGTCCCTAATACAATGGC TTG 10 127-172 0.836 May et al. (1997)
AoxD64 (AY093637)
Cyanine 5
0.033 F: TTTGTGTAGGGAAATACCCTTG
R: TGAGTGCAGCCCTACTGCTC TAGA 9 216-248 0.811
Henderson-Arzapalo and King (2002) 4
(63 °C) (MF100775) Aru26
DY-751
0.200 F: AAAGCAACAACTCCACCAGG
R: TGCCTTGTCTACTGTCCGAA CT 5 165-173 0.583 Kohlmann et al. (2017b)
Anac_c159 (KR297008)
Cyanine 5
0.058 F: ACGACATTACTCGAAACTGCTG
R: TGATATGCCTTGGAACGCTG TAT 8 311-341 0.762 Boscari et al. (2015)
5
(63 °C) (MF100772) Aru13
DY-751
0.160 F: TCCACTTTATTCCGTTGTGG
R: AGACCGGAATCAAACCCAG GTT 5 105-123 0.659 Kohlmann et al. (2017b)
Hus15 (MH605082)
Cyanine 5
0.033 F: AGGGACACGCTCACTGTTTT
R: AACAGATGTACAGTCAGACCCG GT 4 129-137 0.272 this study
Ko
h
lm
a
n
n
e
t
a
l.
/
Gen
Aq
u
a
2
:
35
-41
(2
0
1
8
)
Kohlmann et al. / GenAqua 2: 35-41 (2018) 39
Table 2. Variability of 12 polymorphic microsatellite loci in two test panels of 18 farmed and 40 wild-caught Huso huso
(NA=number of alleles; HO=observed heterozygosity; HE=expected heterozygosity; PHW=exact P-value of the Hardy-Weinberg
probability test: * P<0.05, ** P<0.01, n.s. non-significant).
Locus Parameter Farmed H. huso Wild H. huso Probability of identity
for siblings (PIsib)
References
Boscari, E., Pujolar, J.M., Dupanloup, I., Corradin, R., & Congiu, L. (2014). Captive breeding programs based on family groups in polyploid sturgeons. PloS ONE 9, e110951.
https://doi.org/10.1371/journal.pone.0110951 Boscari, E., Vidotto, M., Martini, D., Papetti, C., Ogden, R.,
& Congiu, L. (2015). Microsatellites from the genome and the transcriptome of the tetraploid Adriatic
sturgeon, Acipenser naccarii (Bonaparte, 1836) and
cross-species applicability to the diploid beluga
sturgeon, Huso huso (Linnaeus, 1758). Journal of
Applied Ichthyology, 31(6), 977-983. https://doi.org/10.1111/jai.12906
Cornuet, J.M., Piry, S., Luikart, G., Estoup, A., & Solignac, M. (1999). New methods employing multilocus genotypes to select or exclude populations as origins of individuals. Genetics, 153(4), 1989-2000.
Gesner, J., Chebanov, M., & Freyhof, J. (2010). Huso huso. The IUCN Red List of Threatened Species 2010:
e.T10269A3187455. Available at:
http://dx.doi.org/10.2305/IUCN.UK.2010-1.RLTS.T10269A3187455.en (accessed June 15, 2018).
Henderson-Arzapalo, A., & King, T.L. (2002). Novel microsatellite markers for Atlantic sturgeon (Acipenser oxyrinchus) population delineation and broodstock management. Molecular Ecology Notes, 2(4), 437-439. https://doi.org/10.1046/j.1471-8286.2002.00262.x
Kalinowski, S.T., Taper, M.L., & Marshall, T.C. (2007). Revising how the computer program CERVUS accommodates genotyping error increases success in
paternity assignment. Molecular Ecology, 16(5),
1099-1106.
https://doi.org/10.1111/j.1365-294X.2007.03089.x Kaplinski, L., Andreson, R., Puurand, T., & Remm, M.
(2005). MultiPLX: automatic grouping and evaluation
of PCR primers. Bioinformatics, 21(8), 1701-1702.
https://doi.org/10.1093/bioinformatics/bti219 King, T.L., Lubinski, B.A., & Spidle, A.P. (2001).
Microsatellite DNA variation in Atlantic sturgeon (Acipenser oxyrinchus oxyrinchus) and cross-species amplification in the Acipenseridae. Conservation Genetics, 2(2), 103-119.
https://doi.org/10.1023/A:1011895429669
Kohlmann, K., & Kersten, P. (2006). Microsatellite loci in tench: isolation and variability in a test population. Aquaculture International, 14(1-2), 3-7.
https://doi.org/10.1007/s10499-005-9009-y
Kohlmann, K., & Kersten, P. (2008). Isolation and characterization of nine microsatellite loci from the
pike-perch, Sander lucioperca (Linnaeus, 1758).
Molecular Ecology Resources, 8(5), 1085-1087. https://doi.org/10.1111/j.1755-0998.2008.02166.x Kohlmann, K., Kersten, P., Geßner, J., Onără, D., Taflan, E.,
& Suciu, R. (2017a). Isolation and characterization of 18 polymorphic microsatellite markers for the critically
endangered stellate sturgeon, Acipenser stellatus.
European Journal of Wildlife Research, 63, 75. https://doi.org/10.1007/s10344-017-1132-3
Kohlmann, K., Kersten, P., Geßner, J., Onără, D., Taflan, E., & Suciu, R. (2017b). New microsatellite multiplex PCR sets for genetic studies of the sterlet sturgeon,
Acipenser ruthenus. Environmental Biotechnology, 13(1), 11-17.
Kohlmann, K., Kersten, P., Geßner, J., Eroglu, O., Firidin, S., Ciorpac, M., Taflan, E., & Suciu, R. (2018). Validation of 12 species-specific, tetrasomic microsatellite loci from the Russian sturgeon, Acipenser gueldenstaedtii,
for genetic broodstock management. Aquaculture
International, 26(6), 1365-1376.
https://doi.org/10.1007/s10499-018-0290-y
Liu, Z.J., & Cordes, J.F. (2004). DNA marker technologies and their applications in aquaculture genetics. Aquaculture, 238(1-4), 1-37.
https://doi.org/10.1016/j.aquaculture.2004.05.027 Malausa, T., Gilles, A., Meglécz, E., Blanquart, H., Duthoy,
S., Costedoat, C., Dubut, V., Pech, N., Castagnone-Sereno, P., Délye, C., Feau, N., Frey, P., Gauthier, P., Guillemaud, T., Hazard, L., Le Corre, V., Lung-Escarmant, B., Malé, P.-J., Ferreira, S., & Martin, J.-F. (2011). High-throughput microsatellite isolation through 454 GS-FLX Titanium pyrosequencing of
enriched DNA libraries. Molecular Ecology
Resources, 11(4), 638-644.
https://doi.org/10.1111/j.1755-0998.2011.02992.x Marshall, T.C., Slate, J., Kruuk, L.E.B., & Pemberton, J.M.
(1998). Statistical confidence for likelihood-based
paternity inference in natural populations. Molecular
Ecology, 7(5), 639-655.
https://doi.org/10.1046/j.1365-294x.1998.00374.x May, B., Krueger, C.C., & Kincaid, H.L. (1997). Genetic
variation at microsatellite loci in sturgeon: primer sequence homology in Acipenser and Scaphirhynchus. Canadian Journal of Fisheries and Aquatic Sciences, 54(7), 1542-1547.
https://doi.org/10.1139/cjfas-54-7-1542
McQuown, E.C., Sloss, B.L., Sheehan, R.J., Rodzen, J., Tranah, G.J., & May, B. (2000). Microsatellite analysis of genetic variation in sturgeon: new primer sequences for Scaphirhynchus and Acipenser. Transactions of the American Fisheries Society, 129(6), 1380-1388.
https://doi.org/10.1577/1548-8659(2000)129<1380:MAOGVI>2.0.CO;2
Meglécz, E., Costedoat, C., Dubut, V., Gilles, A., Malausa, T., Pech, N., & Martin, J.-F. (2010). QDD: a user-friendly program to select microsatellite markers and design primers from large sequencing projects. Bioinformatics, 26(3), 403-404.
https://doi.org/10.1093/bioinformatics/btp670 Rajkov, J., Shao, Z., & Berrebi, P. (2014). Evolution of
ploidy and functional diploidization in sturgeons: microsatellite analysis in 10 sturgeon species. Journal of Heredity, 105(4), 521-531.
https://doi.org/10.1093/jhered/esu027
Rousset, F. (2008). GENEPOP’007: a complete re-implementation of the GENEPOP software for
Windows and Linux. Molecular Ecology Resources,
8(1), 103-106.
http://dx.doi.org/10.1111/j.1471-8286.2007.01931.x
Van Oosterhout, C., Hutchinson, W.F., Wills, D.P.M., & Shipley, P. (2004). MICRO-CHECKER: software for identifying and correcting genotyping errors in
microsatellite data. Molecular Ecology Notes, 4(3),
535-538.
Kohlmann et al. / GenAqua 2: 35-41 (2018) 41
Waits, L.P., Luikart, G., & Taberlet, P. (2001). Estimating the probability of identity among genotypes in natural
populations: cautions and guidelines. Molecular
Ecology, 10(1), 249-256.
https://doi.org/10.1046/j.1365-294X.2001.01185.x
Welsh, A., Hill, T., Quinlan, H., Robinson, C., & May, B. (2008). Genetic assessment of lake sturgeon population
structure in the Laurentian Great Lakes. North
American Journal of Fisheries Management, 28(2),
572-591. https://doi.org/10.1577/M06-184.1
Wilberg, M.J., & Dreher, B.P. (2004). GENECAP: a program
for analysis of multilocus genotype data for non-invasive sampling and capture-recapture population estimation. Molecular Ecology Notes, 4(4), 783-785. https://doi.org/10.1111/j.1471-8286.2004.00797.x
Wozney, K.M., Haxton, T.J., Kjartanson, S., & Wilson, C.C. (2011). Genetic assessment of lake sturgeon
(Acipenser fulvescens) population structure in the
Ottawa River. Environmental Biology of Fishes, 90(2),
183-195.