Volume 56, 2018, Pages 102–110
Proceedings of the 5th International OMNeT++ Community Summit
ResourSim – Evaluating the end-user Device usage
Jens Dede
1and Anna F¨
orster
1University of Bremen, Sustainable Communication Networks, Bremen, Germany
{jd, afoerster}@comnets.uni-bremen.de
Abstract
The optimization of apps on nowadays mobile phones, tablets and smart watches is mainly done with the focus on the energy constraints, i.e., the device battery lifetime. For some applications, this is adverse to their requirements and use cases like for back-ground communication apps without direct user interaction. The frameworkResourSim, as proposed in this work, aims on evaluating and optimizing the usage of device resources regarding the requirements of background tasks and the human user. This is achieved by replaying usage traces from real humans and adding arbitrary background job usage pat-terns. Furthermore, it is evaluated, if a statistical battery model is suitable for reflecting the real battery behaviour inResourSim.
1
Introduction
Nowadays, virtually everybody owns at least one mobile device like a phone, tablet or even a smart watch and thus, carries a powerful computer most of the time. The operating systems on these devices – namely Android, iOS, watchOS, Wear OS etc. – try to optimize the battery lifetime using different technologies. Recent Android versions, for example, restrict background
tasks to a minimum using a technology calledDoze.
On the other hand, several applications and scenarios exist which require background activ-ities without user interaction and therefore conflict with the energy saving features in nowadays devices. One class of these applications are opportunistic communication applications like the
ODD model [2] orFireChat1. These kind of applications operate in the background using
dif-ferent technologies – mainly WiFi and Bluetooth – and create a kind of an ad-hoc network. These applications allow communication even if none of the infrastructure-based networks like WiFi or the cellular network are available for example due to a disaster, censorship or just missing coverage.
The idea of user-centered resource management [1] aims on optimizing the scheduling of
background tasks according to the current user, or more exactly, the way a human uses the
device. For that, the device usage is recorded using an Android app calledResourceMonitor2.
This app collects data like the status of the screen, WiFi, cellular network connection, Blue-tooth and the battery and allows to export this data for further offline analysis. It has been
shown, that the usage of the devices highly depends on the human [1,3] and therefore has to
1https://www.opengarden.com/firechat.html
performed individually for each user. Furthermore, the analysis for the scheduling has to be performed locally and offline per device as no Internet connectivity might be available due to the aforementioned reasons.
For the development of background scheduling algorithms based on and optimized for the
user behaviour, an evaluation tool is required. ResourSim, as introduced in this work, is a
simulation setup for OMNeT++ aiming on this gap. ResourSim replays usage traces from
human users collected usingResourceMonitor and injects arbitrary background task patterns.
It shows possible conflicts in the phone usage between the human and a background task. The objective is to optimize the activities of background tasks like opportunistic networks without any negative experience for the user.
This paper is structured as follows: Section2introduces ResourSim and the setup in
OM-NeT++. Four example scenarios used for the evaluation ofResourSim are introduced in
Sec-tion3. These scenarios are evaluated and analyzed in Section4. Section 5gives some insights
in the challenges of realistic battery modeling, whereas Section6concludes this work.
2
ResourSim
ResourSim is a simulation setup for the OMNeT++ simulation environment. In contrast to
the majority of simulations run in OMNeT++,ResourSim does not simulate a communication
network, but uses the discrete event simulation capabilities of OMNeT++ to run the
event-based traces collected using ResourceMonitor. The ResourSim setup including the example
traces used in this work is available on GitHub3.
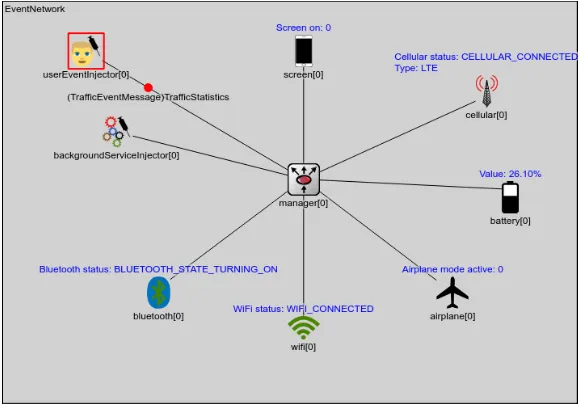
Figure 1shows the modules currently implemented in ResourSim. Three types of modules
are available:
Injectors inject events into the network. Currently, the userEventInjectorand the back-groundServiceInjectorare available.
Manager forwards the events from the injectors to the sink modules.
Sinks are all other modules. They reflect the status of the entity and collect statistics about the states and collisions between different events.
TheuserEventInjector modulereads the real user traces collected usingResourceMonitor
and creates the corresponding events. For that, the traces are imported as an XML file which contains the events in the following format:
< e v e n t d a t a _ t y p e =" W i F i S t a t u s " t i m e = " 2 0 1 7 - 1 2 - 0 2 T18 : 3 0 : 0 9 Z " t i m e s t a m p _ s
,→ = " 3 3 1 2 6 5 3 . 0 " w i f i _ s t a t u s = " 4 " > 3 3 1 2 6 5 3 . 0 < / event >
Besides the type of the event (WiFiStatus) and the time in different representations,
wifi_status="4"indicates that WiFi is connected. Similar events exist for Bluetooth, screen
status, cellular network, battery, flight mode and the traffic statistics. For each event in the XML file, an event in OMNeT++ represented by a message containing the additional informa-tion is created.
The event messages created by the backgroundServiceInjector moduleare similar to
the user messages. They are created according to the parameters defined in theomnetpp.ini:
start The time when the event ist injected the first time.
Figure 1: The Configuration of ResourSim
stop The last time the event is injected.
duration How long does an event occupy the resource?
type The type of the event (e.g. WiFi).
repetition The time between two consecutive events, inter-event time.
These messages are sent to the centralmanager modulewhich forwards the events to the
sink modules. Each sink module represents one entity of a real device:
• Thescreen modulereflects the current status of the screen. It is assumed that the user is actively using the device if the screen is on.
• The connection status and the connection type of the cellular network interface is reflected
by thecellular module.
• Energy-related data like the battery status (charging, discharging) and the battery level
are modeled by thebattery model.
• When the user switches the device to flight mode, it will be mentioned by theairplane
model.
• Thewifi modulereflects the current status of the WiFi connection.
• Thebluetooth modulereflects the current status of the Bluetooth interface.
is actively using the device. In this case, a background tasks should not perform any heavy background operation like data processing. Additionally, it is assumed that once a task has been started, it cannot be interrupted by another tasks. If this happens, a collision will occur. There are two types of collisions:
User Collision The user requests a resource. If a resource like WiFi for Internet con-nectivity is not available at this time, this will result into a negative user experience and thus has to be avoided.
Background Collision The background service requests a resource (CPU time, WiFi etc.) which is not available, i.e., occupied by the human user. The draw-back for the user in this case is mostly negligible. The drawdraw-back for the background process depends on the type of the service.
The number of collisions is counted and normalized to collisions per day. These values are
used to estimate the user experience for different scenarios in Section4. The battery sink plays
a special role and will be discussed later in Section 5. The following Section3 describes the
reference scenarios used in this work.
3
Evaluation Scenario Description
To evaluate and demonstrate the functionality of ResourSim, four reference scenarios for
as-sumed background tasks are defined in the omnetpp.ini. For each them, the start and end
time, duration, service type and repetition (inter service time) can be defined. The focus is on the latter three as the start time is set to one and the stop time is not used for all scenarios.
For a better understanding, the focus is on the WiFi and CPU or screen usage: To determine if the human is currently using the device, the screen status is used. This corresponds to CPU usage for the background task, i.e. if the screen is on, no heavy CPU job should be started by the background task and vice versa. WiFi is assumed to be only accessible either by the user or by the background task. This is valid as both are assumed to have contradictory requirements: The user needs Internet connectivity whereas the background task requires network scanning and direct data transfer to other nodes which is not possible at the same time. The following scenarios are defined:
Scenario I does not assume any background service at all. Only the human usage traces are
replayed. This scenario will be used for testing the battery module in Section5.
Scenario II assumes regular background scanning for WiFi nodes in proximity which re-flects a neighbor discovery. The service type is set to WiFi, the inter service time is set to
uniform(500s, 700s)which is a uniform distribution between 500 and 700 seconds. For the
duration of each scan, a truncated non-negative normal distribution withµ= 2s andσ= 1s is
used and defined bytruncnormal(2s, 1s).
Scenario III extends the Scenario II with CPU usage. It is assumed that the data collected during the WiFi scans is processed once per hour. For that, some CPU time is required. This is done by adding a second background task of type CPU. The time between two executions is
assumed to be normal distributed withµ= 3600s and σ= 10s. The duration is again defined
as a truncated non-negative normal distribution withµ= 10s and σ= 5s. The corresponding
Collision Type User 1[day1 ] User 2[day1 ]
Scenario II
WiFi user 0.125 0.069
WiFi background 110.366 88.090
usage user 0.0 0.0
usage background 0.0 0.0
Scenario III
WiFi user 0.062 0.094
WiFi background 110.420 88.199
usage user 0.187 0.484
usage background 1.572 5.163
Scenario IV
WiFi user 4.179 2.682
WiFi background 536.560 437.113
usage user 0.241 0.369
usage background 1.712 5.104
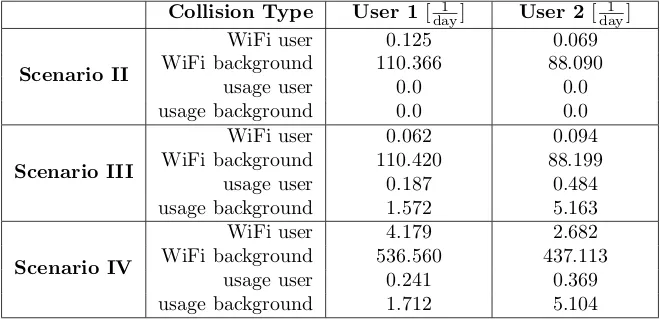
Table 1: Average collisions per day by collision type for two user traces.
User collision: user is negatively affected, background collision: background task is negatively affected.
Scenario IV assumes an opportunistic communication application heavily using WiFi and requesting CPU time. The CPU usage is the same as defined in Scenario III, the WiFi inter service time is set to a fixed values of 120 s. The duration is set to a non-negative truncated
normal distribution withµ= 10s andσ= 5s (truncnormal(10s, 5s)).
For the evaluation of these scenarios, two traces of mobile phones of two different users are used. These traces were selected to reflect significantly different user behaviours. The trace of user 1 contains data of 3084 hours (129 days), the trace of user 2 is longer and contains data for 7670 hours (320 days).
These scenarios will be evaluated with the user traces in the following Section4.
4
Example Scenario Analysis
In this section, the traces of the two users are run for the scenarios defined in Section3. The
number of collisions per day for the different tasks and users are shown in Table1. Scenario I
is not mentioned as it is a replay scenario without any injected background task and therefore, no collisions occur.
It can be seen that a moderate WiFi usage as defined in Scenario 2 barely affects the human user but with approximately 100 conflicts per day for both user traces has a notable influence on the background task. Similar can be observed for the Scenario III. In Scenario I and II, both users will in average less than once per day notice drawbacks in the daily usage of their devices. Only in case of heavy usage of the device by the background task as defined in the Scenario IV, the user will face a notable decreased experience: User 1 will in average collide four times per day in the WiFi usage with the background task. The same happens for the second user in average 2.7 times per day which can (depending on the user expectation) be considered as a major effect on the daily usage.
technology and protocols and is out of scope of this work.
Another aspect which has not been discussed in this section is the affect on the energy
consumption of the background task. The challenges for this will be discussed in Section5.
5
Battery and Energy Consumption Modeling
In the previous section, the collisions in the usage of mobile device resources between a human user and a background task have been analyzed. However, the influence on the device battery has been neglected. Depending on the device resources occupied by the background task, the influence on the battery lifetime can be remarkable. In a worst case, the user might have a phone with a battery completely drained by a background task without the chance of charging it where he is used to have a almost fully charged device.
The (dis)charging of a phone depends on a variety of different parameters like (but not limited to) the phone hardware and the battery capacity, version of the operating system, installed and used apps, age of the battery, the current user activity etc. For example in the
INET framework4, modules for the energy generation, storage and consumption exist. Due to
the large variety of different systems and parameters, the setup of such a model forResourSim
would be a challenging task. Alternatively, one could create a power model by analyzing the
traces by the battery level and the used resources as done in [3] for the Android G1 in 2009.
This is possible, but complex as it has to be done in theory every time the user (un)installs or updates an application as it might significantly influence the energy consumption. In this section, it is evaluated how close one can get to reality with a statistical battery model.
The first approach is to solely use the available battery data from the ResourceMonitor
trace. This fails in case of injected background tasks which require energy as the battery get discharged faster. While charging again, the model also have to consider the new battery level and adapt accordingly. Here, an extrapolation of the battery values is required.
In this work, the existing traces are used to evaluate, if a simplified statistical model can be used. For this, the replay Scenario I is used. There, no additional background services are setup and the model can easily be compared to the real values. In case of a perfect matching model, the difference between the real and the calculated values should be zero.
The charging and discharging processes are evaluated separately for each user. The change in the values is normalized to percent points per hour. The following methods are evaluated:
1. The overall mean charging and mean discharging rate per hour, calculated for the complete user trace.
2. The overall median charging and median discharging rate per hour, calculated for the complete user trace.
3. An array of the mean charging and mean discharging values in dependence of the current battery level.
4. An array of the median charging and median discharging values in dependence of the current battery level.
All these values can easily be created from the existing traces from ResourceMonitor and
setup in the corresponding sections in theomnetpp.ini. Table2shows the input values for the
simulation.
User 1[hour% ] User 2[hour% ]
Mean Values Charging 47.85 58.59
Discharging -23.95 -17.78
Median Values Charging 37.50 56.25
Discharging -8.2 -7.96
Table 2: The mean and median values for charging and discharging the device battery in percent points per hour for user 1 and user 2.
0% 20% 40% 60% 80% 100%
Current Battery Level -200%
h
-150% h
-100% h
-50% h
0% h
50% h
100% h
150% h
200% h
Battery
level
change
Charging / Discharging behaviour with 95% Confidence Interval
Charging Discharging
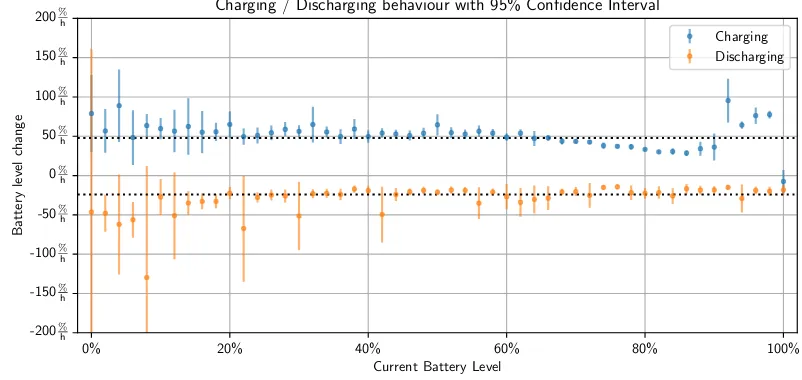
Figure 2: The mean relative change of the battery level in percent points per hour in dependency of the current battery level for user 1 with 95% confidence interval. The dotted lines represent the mean charging and mean discharging values, respectively.
The array values are in the format <current value>: <change per hour>, and defined
as follows in theomnetpp.ini:
**. c h a r g e P e r H o u r A r r a y = " 0 : 0 . 4 4 9 9 9 9 9 8 9 9 4 1 7 1 7 8 6 , ... , 1 0 0 : 0 . 0 " **. d i s c h a r g e P e r H o u r A r r a y = "0:0.0 , 2 : - 0 . 0 0 7 2 7 5 6 6 6 7 7 3 5 1 2 0 1 1 , ... ,
,→ 1 0 0 : - 0 . 1 7 1 7 0 3 3 2 8 6 3 9 2 6 3 8 5 "
An example plot of this array showing the mean charging and mean discharging per hour
for user 1 is shown in Figure2. One can see that for example the discharging at a battery level
of 12 % is in average -50 %h. The increase in the confidence interval for lower battery levels
corresponds to the charging behaviour of the user: user 1 keeps the battery level high, only few measurements for low battery levels, i.e. less than 20 % are available. The dotted lines represent the means for the charging and discharging values.
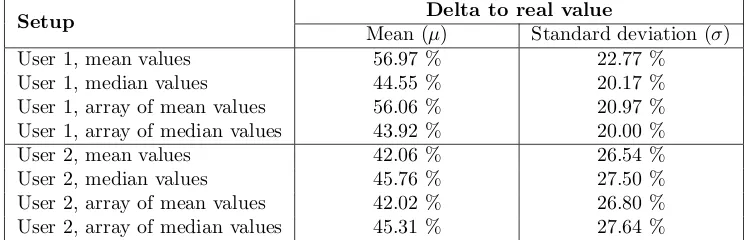
The four methods are applied to the two user traces and the calculated battery level and
the measured real battery level are compared. The results are shown in Table3. One can see
Setup Delta to real value
Mean (µ) Standard deviation (σ)
User 1, mean values 56.97 % 22.77 %
User 1, median values 44.55 % 20.17 %
User 1, array of mean values 56.06 % 20.97 %
User 1, array of median values 43.92 % 20.00 %
User 2, mean values 42.06 % 26.54 %
User 2, median values 45.76 % 27.50 %
User 2, array of mean values 42.02 % 26.80 %
User 2, array of median values 45.31 % 27.64 %
Table 3: The mean values and the standard deviation of the difference between the real and the estimated battery levels using different statistical methods.
use and implement statistical battery model. It is part of the future work to further investigate this challenge and implement better models for the charging and discharging behaviour.
6
Conclusion
In this work,ResourSim has been introduced. It is a simulation setup for OMNeT++ which
helps to easily analyze the effect of background tasks on the daily usage on real user devices like smartphones and tablets. The real user behaviour is taken from traces collected using the
ResourceMonitor app. Arbitrary background tasks like CPU or WiFi usage can be injected and the conflicts between the human user and the background task can be analyzed. This helps to increase the understanding in the interdependency of both and optimize the scheduling
of background activities using new scheduling technologies on mobile devices. ResourSim has
been evaluated using different example scenarios for two real user traces.
Furthermore, it has been evaluated whether statistical methods can be used to model the
battery behaviour and if this is suitable to match the requirements forResourSim. It has been
shown, that the charging and discharging behaviour of nowadays smartphones is too dynamic to be reflected by simplistic statistical methods.
For the future work, the authors are going to evaluate other battery charging and discharging
models and implement them in ResourSim as the battery level is one of the most crucial
properties for a user on a mobile device. In addition to that, more complex evaluation scenarios are going to be implemented. One aim is a fine-grained analysis of the usage multiple resources for both, the human user and the background task.
Finally, the authors would like to invite the interested reader to contribute to theResourSim
project and comment on the implemented methods and technologies.
References
[1] Jens Dede, Asanga Udugama, and Anna F¨orster. Poster: User-centered resource management for background services. http://dx.doi.org/10.13140/RG.2.2.16922.13769, 2017.