DEMOGRAPHIC RESEARCH
VOLUME 39, ARTICLE 21, PAGES 635
,
646
PUBLISHED 26 SEPTEMBER 2018
https://www.demographic-research.org/Volumes/Vol39/21/ DOI: 10.4054/DemRes.2018.39.21
Descriptive Finding
Cause-specific mortality as a sentinel indicator
of current socioeconomic conditions in Italy
Elisabetta Barbi
Oliviero Casacchia
Filomena Racioppi
© 2018 Elisabetta Barbi, Oliviero Casacchia & Filomena Racioppi.
This open-access work is published under the terms of the Creative Commons Attribution 3.0 Germany (CC BY 3.0 DE), which permits use, reproduction, and distribution in any medium, provided the original author(s) and source are given credit.
1 Introduction 636
2 Obsolescence of a socioeconomic indicator: The infant mortality rate vs. the vulnerability index
637
3 Mortality data is still an option 639
4 Conclusion 643
Demographic Research: Volume 39, Article 21 Descriptive Finding
Cause-specific mortality as a sentinel indicator of current
socioeconomic conditions in Italy
Elisabetta Barbi1
Oliviero Casacchia2
Filomena Racioppi3
Abstract
BACKGROUND
In the last few years the need for disaggregated statistics at small territorial levels to monitor the social and economic conditions of the various areas of a country has increased considerably. The question of how to define these indicators has been the topic of a recent international debate.
OBJECTIVE
This study aims to assess whether simple, widely available demographic indexes, like mortality measures, may serve as sentinel indicators of economic development and social wellbeing in Italy.
METHODS
We analyse and compare the geographical patterns of the infant mortality rate and of the mortality rates for leading causes of death with the spatial pattern found for a more complex index, the vulnerability index, recently introduced by the Italian National Institute for Statistics at the provincial level in contemporary Italy.
RESULTS
Mortality from leading causes of death such as diseases of the circulatory system, and mortality from increasingly emergent causes of death such as diabetes, may offer a valid statistic to grasp economic development and social wellbeing in Italy today. CONCLUSIONS
Our findings are important because policymakers need to rely on indicators with the following fundamental properties: easy availability, clear definition, temporal continuity, and spatial comparability.
CONTRIBUTION
This study contributes to the literature by showing that mortality data is a straightforward and powerful tool to help policymakers plan appropriate interventions.
1. Introduction
The last few years have seen an increasing need for disaggregated statistics at small territorial levels that can monitor the social and economic conditions of the various areas of a country and highlight possible regional imbalances. The general climate of uncertainty that Italy and other countries – both in Europe and globally – have experienced in recent years has amplified the need and urgency for indicators that can drive policymakers in the planning and evaluation of structural and development policies. The question of how to define these indicators has been the topic of a recent international debate (Mazziotta and Pareto 2016).
For past populations and in developing countries the infant mortality rate is widely acknowledged as a good proxy for the level of a country’s development because it represents a measure of both the population’s socioeconomic conditions and its health system. Infant mortality is internationally defined, computed worldwide, and available in time series. Hence, it is easily exploitable and allows comparison over time and space, which makes this index even more appealing because it facilitates framing the socioeconomic situation of a population in a broader context and evaluating its development. However, given the long-term process of reduction in early mortality and the general levelling of territorial disparities, infant mortality may fail to represent the economic development and social wellbeing of current populations in developed countries.
In 2015 the Italian National Institute for Statistics (ISTAT) introduced a new indicator, the vulnerability index, which expresses the uncertainty in the social and economic status of a geographical area. The index is constructed by combining several elementary indicators calculated from census data (ottomilacensus.istat.it) and is available at a level of very fine spatial detail (municipal level). However, it is not internationally defined and is available only when there is a population census. As a result, it fails to meet two important requirements of an indicator: continuity over time and international comparability.
Demographic Research: Volume 39, Article 21
valid alternative to infant mortality as a sentinel indicator. To this purpose, we analyse and compare the geographical patterns of the infant mortality rate and the mortality rates for leading causes of death with those found for the vulnerability index, in contemporary Italy and at the provincial level, as this is the finest territorial level for which ISTAT releases cause-specific mortality data.
2. Obsolescence of a socioeconomic indicator: The infant mortality
rate vs. the vulnerability index
In historical demography and also in population studies of developing countries, infant mortality is often used as an indicator of the socioeconomic conditions of a population. Several studies show that the late decline in infant mortality in Italy, which caused a delayed demographic transition with respect to other European countries, was strongly connected to socioeconomic status (Manfredini and Pozzi 2004). After the unification of Italy, and indeed throughout the 1800s, the economic backwardness was clearly reflected in the high infant mortality rate recorded throughout the country. With the dawning of the new century the dualism that pitted economically and socially progressive north-central Italy against a strongly penalized southern Italy progressively increased. As a result, high levels of infant mortality increasingly became the prerogative of the south (Caselli 1987; Pozzi 2000). The geography of infant mortality in Italy reflected the persistence of a strong relationship between socioeconomic development and infant mortality until the 1960s, when due to a higher frequency of low-weight and preterm births the most industrialized regions lost some of the advantages that the economic conditions and the best health care facilities should have ensured (Pinnelli 1989). In more recent decades, Italy has quickly recovered: infant mortality has reached values that are among the lowest in Europe and continue to decline throughout the country, although in the last years there has been a slowing down of this trend. Furthermore, geographical discontinuities, although still persistent, have reduced (ISTAT 2014).
Recently, ISTAT introduced a new synthetic index to measure material and social vulnerability in Italy at the municipal level. This index exploits information from the population census and has been computed with reference to the 2011 census; it has also been reconstructed to 2011 borders for the two previous Italian censuses of 2001 and 1991. The index is constructed by combining seven elementary indicators that describe the main material and social vulnerability dimensions:
∂ The percentage of households with six or more members;
∂ The percentage of young (parent age less than 35 years) or mature (parent age between 35 and 64 years) single-parent families;
∂ The percentage of households with potentially poor support: the proportion of households composed only of seniors (65 and over) with at least one octogenarian component;
∂ The percentage of the population in seriously crowded conditions: the percentage of people living in a house smaller than 40 sq. m. with more than four occupants, or 40–59 sq. m. with more than five occupants, or 60–79 sq. m. with more than six occupants;
∂ The percentage of young people (15–29 years) not in the labour market or education;
∂ The percentage of households with the potential to experience economic hardship: the proportion of young or mature families with children where no one is employed.
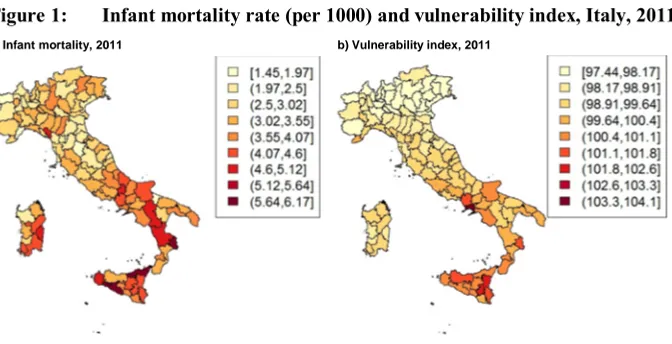
Figure 1 shows the geographical patterns of infant mortality and the vulnerability index in Italy at the provincial level in 2011. As expected, the two maps do not match. To evaluate the association between these two variables we computed Spearman’s rank correlation coefficient θs, which turns out be equal to 0.5. The highest levels of vulnerability are found in southern Italy, still economically and socially backward, whereas the industrialized north enjoys the lowest levels. For infant mortality the situation is different, with a south still penalized and a north that does not enjoy the best survival conditions at these early ages.
Figure 1: Infant mortality rate (per 1000) and vulnerability index, Italy, 2011
Demographic Research: Volume 39, Article 21
3. Mortality data is still an option
As we have seen in Section 2, in Italy infant mortality is no longer the ideal proxy for socioeconomic conditions. Nevertheless, mortality is a powerful measure which allows geographical and temporal comparisons: statistical institutes collect mortality data in a comprehensive way, with territorial details and in long time series, and encode them following internationally accepted rules. Mortality is also very informative, is the ultimate measure of health, and is easy to measure – unlike other health indicators such as disability or disease prevalence.
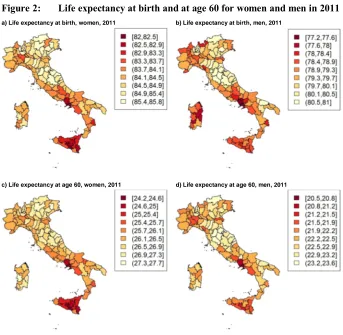
We therefore focused on another important mortality indicator, life expectancy at birth, separately for women and men, and given the increasing importance of elderly mortality in determining the current level of human survival we also considered life expectancy at age 60. Figure 2 depicts a mixed picture, especially for men. While for women it is possible to see a distinction between the north and the south of Italy – which is clearly disadvantaged even though the highest values of life expectancy both at birth and at age 60 are not a prerogative of all the northern provinces – for men the picture is much less obvious. The lowest values of life expectancy at birth and at age 60 are more scattered across the country: they are recorded in both many southern provinces and many economically developed northern provinces. A common feature for both women and men is that a cluster of provinces in central Italy enjoys the best survival conditions. Hence, like the infant mortality rate, in Italy today these indicators do not prove very useful in uniquely identifying areas of economic and social disadvantage. Spearman’s rank correlation coefficient between the vulnerability index (Figure 1, right) and life expectancy at birth isθs = –0.54 for women andθs = –0.36 for
men, whereas the correlation coefficients between the vulnerability index and life expectancy at age 60 areθs = –0.54 andθs =–0.25 for women and men respectively.
Figure 2: Life expectancy at birth and at age 60 for women and men in 2011
a) Life expectancy at birth, women, 2011 b) Life expectancy at birth, men, 2011
c) Life expectancy at age 60, women, 2011 d) Life expectancy at age 60, men, 2011
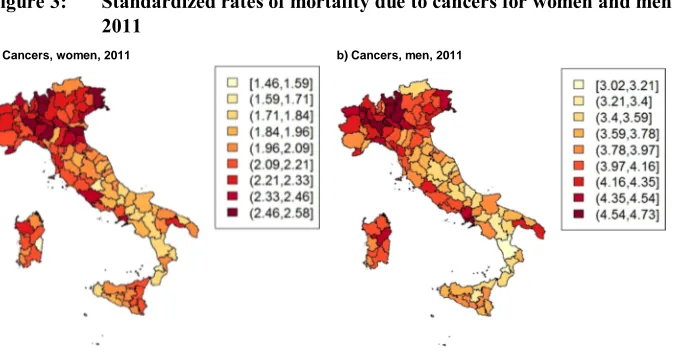
The current geographical patterns of these leading causes of death are similar to those observed in the past (Caselli and Egidi 1981; Caselli, Cerbara, and Leti 1993). Figure 3 shows the standardized mortality rates due to cancer for women and men in 2011.4 It seemsto confirm the thesis of a reverse relationship between development and mortality: The highest levels of cancer mortality are recorded for both women and men in the north of Italy, whereas the south experiences more favourable levels. This thesis is also confirmed by the negative values of the rank correlation coefficient between
4 The standardized rates presented in this paper are calculated with reference to the deaths and the resident
Demographic Research: Volume 39, Article 21
mortality from cancers and the vulnerability index, which is–0.58 for women and–0.50 for men. A negative correlation with the vulnerability index is also found when looking at the two leading specific causes for the two sexes, namely breast cancer for women (ICD10: C500–C509) and cancers ofthe larynx, trachea, bronchus, and lungs for men (ICD10: C320–C349), at θs = –0.29 and θs = –0.22 respectively. Mortality from
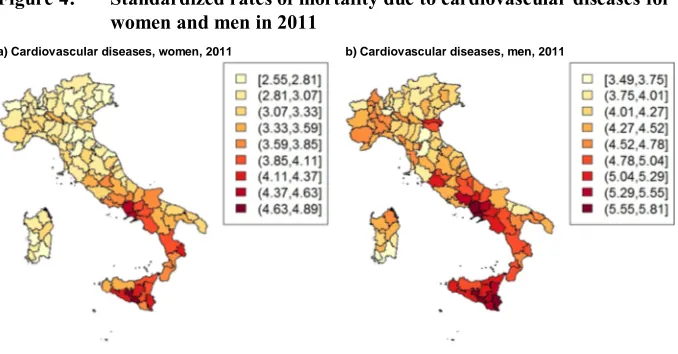
cardiovascular diseases presents a totally different picture (Figure 4): The dualism between the disadvantaged provinces of the south and the northern provinces with lower mortality levels is visible for both women and men, and is particularly marked for women. The geographical patterns of these two leading causes of death are similar for the two sexes, but the intensity of each cause is very different for women and men: for men, mortality from cancer can be double the level observed for women, while male and female levels of mortality from cardiovascular diseases are similar (Lagona and Barbi 2018). Thus, for men in the north, the disadvantage is mainly due to mortality from cancers whose risk factors are linked to the occupations and life styles (high alcohol consumption, early spread of smoking, etc.) typical of more developed and industrialized provinces. For women in the south the disadvantage is due to mortality from cardiovascular disease, which is prevalent among women in the southern provinces where healthcare is generally less adequate and women are generally less educated and economically less independent. Thus, it is not surprising that the geographical pattern of mortality from cardiovascular diseases for women (Figure 4, left) matches well with that of the vulnerability index (Figure 1, right). Spearman’s coefficient between these two indexesθs = 0.69 corroborates this correspondence(for
menθs = 0.57).
Figure 3: Standardized rates of mortality due to cancers for women and men in 2011
Figure 4: Standardized rates of mortality due to cardiovascular diseases for women and men in 2011
a) Cardiovascular diseases, women, 2011 b) Cardiovascular diseases, men, 2011
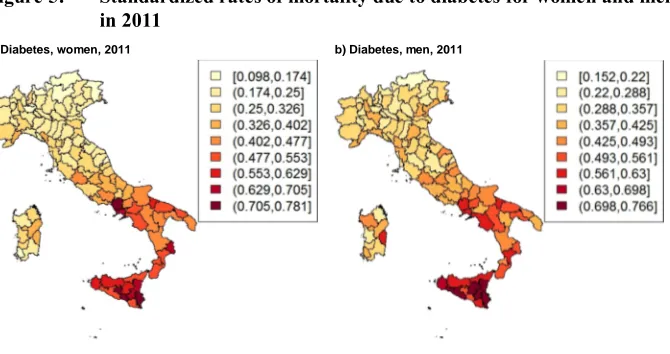
Even more impressive is the overlap between the vulnerability index and mortality due todiabetes (ICD10: E100–E149; Figure 5), an important disease that often has a negative impact on mortality from cardiovascular disease. Early diagnosis, good-quality healthcare facilities, and primary prevention education programmes are of fundamental importance in reducing mortality due to an avoidable cause of death like diabetes, and therefore mortality from cardiovascular disease.It is no coincidence that mortality from these causes of death is lowest in the most prosperous provinces of the country. As a result, mortality due to diabetes considerably correlates with the social and material vulnerability of a population for both women and men (θs = 0.77 for women,θs = 0.71
Demographic Research: Volume 39, Article 21
Figure 5: Standardized rates of mortality due to diabetes for women and men in 2011
a) Diabetes, women, 2011 b) Diabetes, men, 2011
4. Conclusion
Demographic Research: Volume 39, Article 21
References
Barbi, E. and Caselli, G. (2009). Più longevi e meno diversi: Recente evoluzione della sopravvivenza. In: Ongaro, F. and Salvini, S. (eds.).Rapporto sulla popolazione: Salute e sopravvivenza. Bologna: Il Mulino: 11–31.
Barbi, E., Caselli, G., and Yashin, A. (2004). Age and time pattern of mortality by cause in Italy: A mortality surface approach. In: Proceedings of the XLII Scientific Meeting of the Italian Society of Statistics. Padova: CLEUP.
Caselli, G. (1987). Mortalità e sopravvivenza in Italia dall’Unità agli anni ‘30. In: Società italiana di demografia storica (ed.). Popolazione, società e ambiente. Bologna: CLUEB: 275–309.
Caselli, G., Cerbara, L., and Leti, G. (1993). The geography of adult mortality: Results from the fuzzy clumping method.Genus 49(1–2): 1–24.
Caselli, G. and Egidi, V. (1981). L’analyse des données multidimensionnelle dans l’étude des rélations entre mortalité et variables socioéconomiques d’énvironnément et de comportément individueles.Genus 37(3–4): 57–91. Caselli, G., Peracchi, F., Barbi, E., and Lipsi, R.M. (2003). Differential mortality and
the design of the Italian system of public pensions. Labour 17 (Special Issue): 45‒78.
ISTAT (2014).La mortalità dei bambini ieri ed oggi in Italia. Rome: ISTAT.
ISTAT (2015). 8milaCensus [electronic resource]. Rome: ISTAT.http://ottomilacensus. istat.it.
Lagona, F. and Barbi, E. (2018). Segmentation of mortality surfaces by hidden Markov models.Statistical Modelling 19(2): 1–23.doi:10.1177/1471082X18777806. Manfredini, M. and Pozzi, L. (2004). Mortalità infantile e condizione socio-economica.
Una riflessione sull’esperienza italiana fra ‘800 e ‘900.Revista de Demografía Histórica 22(2): 127–156.
Mazziotta, M. and Pareto, A. (2016). On a generalized non-compensatory composite index for measuring socio-economic phenomena. Social Indicators Research
127(3): 983–1003.doi:10.1007/s11205-015-0998-2.