[Joel* 6(7): July, 2019] ISSN 2349-4506
Impact Factor: 3.799
G
lobal
J
ournal of
E
ngineering
S
cience and
R
esearch
M
anagement
CHANGE VISCOSITY
Joel Bigley, Ed.D*
*California Baptist University
DOI: 10.5281/zenodo.3345121
KEYWORDS
:
organizational entropy; leadership culture; multi-level strategy; change resistance; distributed leadership.ABSTRACT
Every organization faces the need for change, but only some will thrive in an environment that requires a disruption. Competitive advantage, or even surviving with a defensible posture, will require that change is both controlled and suitably accelerated using a dispersed leadership cultural attribute. Some organizations spend significant capital to reinvent themselves, execute pre-emptive transformations, or conduct recalibrations. Even though most of these efforts fail to meet expectations, the assumption of a sure position in a market is naïve and fraught with risk. As business success depends more on transformation than evolution, leaders are focused on change, but not on the forces that keep change from happening. With the new normal being temporary market share, explosive innovation, and ever shortening product life-cycles, this article discusses observations obtained from a case study that relate to the forces against positive change. Change acceleration can be effectual if the forces against it are understood and mitigated using a multi-echelon construct.
INTRODUCTION
In this article, the author posits that the organization is a reflection of its talent aided by a culture that is positioned by leadership. The capability and behaviors of talent are acquired, but they are also encouraged and leveraged. Causality in the system, that is the organization, is driven by the elements in the organization that relate and enable change needed for both survival and success. Hambrick and Mason’s (1984) upper echelon theory is dated. While the suggestion that organizations are a reflection of the top management team (TMT) is accurate it is not complete. Yes, the virtues of organization leaders will be found in the organization, but there is more. The research of Finkelstein, Hambrick, and Cannella, Jr. (2009) suggests that, due to the complexity of the situations find themselves in, that a single leader cannot lead as well as a group of leaders that are aligned. The leadership team is a system of relationships as they begin to rely on each other in a complex environment. Taking this a step further, organizations can exhibit similar effective behavior throughout the organization to optimize and exploit leadership behaviors in all parts of the organization. Leadership becomes an attribute of the organizational system. To illustrate, strategic leadership effectiveness may be most likely found when a worker interacts directly with a customer. It is myopic to think that the TMT has the most impact on a customer’s perspective of the serving organization. In fact, a small oversight by a worker may result in rapid brand damage followed by a significant recovery effort by the TMT making it clear who is the most influential in the client-vendor relationship. To this end, organizations that understand the influence of workers, empower those who directly service customers by providing discretionary resources to impact customer perceptions. These individual multi-level actions and interactions are the micro-foundations of the organizations strategy, psychology, and behavior (Felin & Foss, 2009; Hodgkinson & Healey, 2011; Powell, Lovallo & Fox, 2011; Tuncdogan, Van Den Bosch & Volberda, 2015).
[Joel* 6(7): July, 2019] ISSN 2349-4506
Impact Factor: 3.799
G
lobal
J
ournal of
E
ngineering
S
cience and
R
esearch
M
anagement
that initiative is taken by multiple parties to enact strategic change simultaneously. Differences in attributes across strategic and entrepreneurial leaders that negatively affect strategic decision making, implementation processes, risk taking initiatives, and organizational performance, may be referred to as Change Viscosity. This article examines change viscosity in an organization that was compelled to make a radical and complete organizational change.That change must happen for a business to survive is well known. Those that rely on the status quo are disappearing quickly. The business landscape continues to change at an accelerating and alarming rate. Change discussions are not about evolutionary growth but growth hacks that launch and disrupt. Business units are temporary, built around short product lifecycles. The ability to harvest from these lifecycles is fraught with risk. Value is temporary and talent is temporary. A company may not bother with gaining intellectual property protection, because the lifecycle is over before the protection is granted. Companies do not need to eliminate waste, or get lean, they need to be born lean and born global, or face extinction. The question, therefor, for businesses is about whether or not they are accelerating forward at a suitable rate in comparison to their competitors. The idea of velocity may be viewed as a spot check at a time, however, each check needs to be assessed as velocity is replaced by the concept of acceleration. Threatening competitors are horizontally oriented in the market. They are vertically oriented in an accelerated mergers and acquisitions (M&A) environment. And, they are in emerging technologies that change the landscape overnight. While the competition is fierce, little is known about the counterforce to the required acceleration. What is holding organizations back? With this understanding business entities can be liberated from their uncompetitive position and launch into higher profits. Again, the author calls resistance to rapid and fluid progress, Change Viscosity. First, an understanding of the analogy.
AN INTRODUCTION TO VISCOSITY
[Joel* 6(7): July, 2019] ISSN 2349-4506
Impact Factor: 3.799
G
lobal
J
ournal of
E
ngineering
S
cience and
R
esearch
M
anagement
Figure 1. The flow of water on a surface.
Continuing with the analogy, viscosity is different for various liquids. Water viscosity is different from that of honey. Viscosity is the friction between the molecules of the liquid. If the viscosity is low the liquid does not want to adapt or deform because the friction is high between the molecules. And so, the force needed to sheer the molecules must be high. The flow is slow in low viscosity liquids because there is less free space to more resulting in higher internal friction forces. When the temperature of honey is increased, it flows faster because there is more space between the molecules. Is an organization like honey? Are employees liberated with some space to move quickly?
In a non-Newtonian fluid (most fluids) the viscosity is a function of several variables including shear forces and time. These fluids may experience shear thickening. This means that the viscosity of the fluid increases as the shear rate increases. When cornstarch is added to water this happen. Conversely, shear thinning happens if the viscosity decreases as the shear rate increases. This happens with ketchup and blood. This relates to structural reorganization of the fluid due to flow. When molecular chains align the viscosity decreases (resistance to change is organized). In colloids (a mixture in which one substance of microscopically dispersed insoluble particles is suspended throughout another substance) the segregation of substances in a fluid increase the ability to shear causing a shear thinning behavior. The bottom line is that fluids are different. Some respond to increased pressure or temperature with a higher viscosity and faster flow.
Blood is a colloid which mainly contains red and white blood-cells, lymphocytes and plasma. The viscosity of blood can be measured. When the hematocrit rises to 60%, the bloods viscosity can be ten times that of water. With this significant increase in flow resistance, oxygen delivery, and the associated benefit, is retarded. This flow issue may be caused by hypertension. Water can help to thin the blood, but it should be ingested consistently over the day rather than all at once.
[Joel* 6(7): July, 2019] ISSN 2349-4506
Impact Factor: 3.799
G
lobal
J
ournal of
E
ngineering
S
cience and
R
esearch
M
anagement
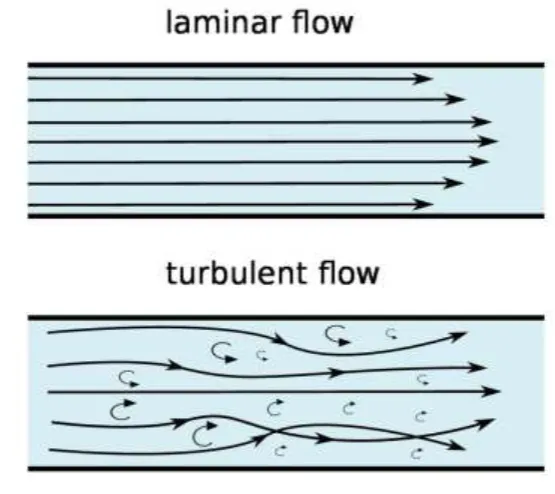
their organizations? Should businesses know how their talent reacts to increased pressure or temperature? Is the makeup of the organization known in terms of its effect on shear thinning or shear thickening? If so, then business leaders would know the viscosity characteristics of their organizations. They would be able to measure resistance to gradual deformation which is critical to adaptation. Water adapts by reshaping itself to its environment, however, turbulence (think chaos) can occur at a flow rate resulting in a terminal flow volume that cannot be exceeded. Laminar flow, flow without turbulence, is the most efficient and predictable type of flow with the least amount of effort given the cubic volume per unit of time. A leader that cannot reshape an organization may think of it as tar from a viscosity perspective, taking several years to move, rather than water. Obsolescence is just around the corner.Figure 2. Laminar vs turbulent flow.
The phrase, if it isn’t measured it isn’t managed, certainly applies to health and blood measurements. How has it applied to business as it seems to be critical to business health as well? In fluids, viscosity has a unit of measure that is a substances resistance to motion under an applied force that is called the centipoise (cP). It is named after Jean Poiseuille, a French physicist and physiologist, who studied the flow of blood through capillaries. One cP is the force per unit area required to move one layer (non-Newtonian fluid) in relation to another. When the viscosity of a fluid is measured, a predominant method is the cross-sectional method. In this case, an obstacle is placed in the flow (a meter stick) while measuring the velocity by the cross sectional area of the stick. This combination is the force per unit area of the fluid. So, what is the cP equivalent in business? How should viscosity be measured? In this article the author attempts to discuss this.
[Joel* 6(7): July, 2019] ISSN 2349-4506
Impact Factor: 3.799
G
lobal
J
ournal of
E
ngineering
S
cience and
R
esearch
M
anagement
CASE STUDY DESIGN
The organization that was studied transitioned from a traditional M-form organizational structure to a multidimensional organizational structure in the interest of realizing growth synergies. This affected the performance of the global value chain created by the corporation generally and by the business division specifically. This organizational event is the object of the study. The event selected had gravitas with the participants, as their employment future relied on its success. With this, the impact of the event was not well known in advance of the action as the structure is novel. The precipitating event followed the realization that a structural change could enhance profitability of the corporation. The organization was operating in an extremely competitive and complex environment and, as such, client satisfaction was critical to gaining and maintaining market share. A need to make a substantial change was recognized by the leadership of the enterprise, and is the subject of the study.
Quality of the Research
Creswell (2014) describes validity in qualitative research as being the determination of whether the findings are accurate from the standpoint of the author, the participant, and the readers of an account. In this case, language and meaning are the data. Creswell (2014), in parallel with Lincoln and Guba’s (1985) approach, offers qualitative researchers eight possible strategies for checking the accuracy of findings; triangulation, member-checking, rich descriptions, clarification of bias, the use of negative or discrepant information, prolonged time in the field, peer debriefing, and the use of an external auditor. The author selectively used these strategies to ensure data validity with a focus on triangulation, peer debriefing, and member checking.
Endogenous validity refers to the validity of established causal relationships (Yin, 1994; Lamnek, 1995) or internal logic of the research (Punch, 1998). This was achieved by establishing a clear thematic focus that guided the case selection, abstracting and comparing, conducting peer reviews of causal relationships, and by having an open and comprehensive explanation building. A thematic focus was evident in a clear definition of an overarching research theme (cross-unit synergies), a narrowing research focus (operative synergies), and a specific research question (the sustainable realization of growth synergies) along with a compatible case selection in which the constructs of interest could be discovered. Continuous abstracting and comparing (Strauss & Corbin, 1990, 1996) occurred as the author continuously compared data sets to build higher order constructs, preliminary results to emerging data to confirm or refine results, and observed causal patterns within the existing literature. This improved the validity of causal relations (Yin, 1994). Peer reviews of causal relationships were discussed with research colleagues for the purpose of capturing and testing additional perspectives based on experience in the field. Additionally, it enabled the validation of internal consistency and theoretical relevance of the author’s arguments. The final technique for internal validity was through open and comprehensible building of explanations and causal relationships. The results were documented in such a way that the reader could reconstruct the causal relationship (Mayring, 1996). Openly, the author indicated initial ideas, deducted assumptions, and challenged potential inconsistencies.
[Joel* 6(7): July, 2019] ISSN 2349-4506
Impact Factor: 3.799
G
lobal
J
ournal of
E
ngineering
S
cience and
R
esearch
M
anagement
Reliability refers to the possibility that researchers can replicate the research activity and produce the same findings (Eisenhardt, 1989; Yin, 1994). A challenge for this replication is the attribute of qualitative research, in that it is bound to the context in which it is conducted (Lamnek, 1995), including time. Reliability in qualitative studies is best served by presenting sufficient information so that the reader can draw his/her own conclusions (Yin, 1994). The author attempted to ensure reliability through the explicit disclosure of the research design, including a detailed description of the research process, case selection criteria, interview guide, and methods for collecting and analyzing empirical data.Data and Analysis
The purpose of this qualitative phenomenological research study, using Moustakas, (1994) modified van Kaam method, was to explore the real-time experiences of stakeholders, or co-researchers, as they lived and influenced events occurring around them. Awareness is a transient experience (Freeman, 2000) that may involve exerting influence, letting go, and redirecting energy and attention (Depraz, Varela, & Vermersch, 2003). It also involves being present physically and mentally in daily life. Stakeholders have to anticipate events, make sense of existing environments, and exert influence over future trends. Weick (1995) suggests that sense-making is a retrospective cognitive process that explains unanticipated events. He also suggests that events in a socially-created world both support and constrain action. Weick, Sutcliffe, and Obstfeld (2005) later suggest that individuals form both assumptions and conscious anticipations of future events. By examining sense-making and the development of mental models through actual lived, shared experiences, this study captures the subjective processes that have been largely ignored in the context of the connection between organizational design and growth in a multi-unit firm. Using the experience of stakeholders, the author presents a conceptualization of how individual participants in this study made sense of their lived experience. This was an ongoing process for participants as they refined their understanding of lived experiences and established new equilibriums.
Each section includes individual textual descriptions as well as composite descriptions concisely oriented and illustrated in a theme map structure. Moustakas (1994) suggested that the integration of textual and structural descriptions into a composite description, such as a relational table, is a path for understanding the essence of an experience. The composite description is an intuitive and reflective integrative description of the meanings and essences of a phenomenon, of which the entire group of individuals is making sense. The participants create meaning through their awareness of the environment, reflection on their experiences, consultation with others, focused response to an enquiry, and iterative refinement to these enquiries.
Coding
Data collection was facilitated by an interview protocol with specific questions oriented in a sequenced schema. Participants were solicited as volunteers from a pool of leaders based on a willingness to share information about the transformation of the sub-division. Each volunteer co-researcher participated in the changes personally. Following each question, the participants’ response was determined to be linked to the question asked and was determined to be meaningful prior to continuing. An answer could trigger a clarifying question, or a question formed to solicit a more fulsome answer, if needed. The additional information modified the answer and once again was determined to be fulsome, or not. The data was added then to the data sheet and coded. Sub-code themes were also determined and grouped by code and sub-code. The data was surveyed by the author, who, due to personal experience, was able to apply an analysis for good (ANOG). Slight modifications were made as needed to reduce the noise in the data and ensure completeness and clarity. This was accomplished by consolidating like data points and simplifying others by stripping out noise and redundancy in the answers. The data was then re-sorted and generalized through categorizing. A pivot-table was used to extract themes in the wording. The raw data was then posted in a table. In some cases most of the themes were unique in which case a table was not used. From this data, dependencies, relationship, and the sequence of events were determined and organized into a theme relationship map. In some cases the data collected appeared as though the participant was confused about the question. In these cases the Author followed up with the participant and then added the newly acquired information to the raw data previously collected.
[Joel* 6(7): July, 2019] ISSN 2349-4506
Impact Factor: 3.799
G
lobal
J
ournal of
E
ngineering
S
cience and
R
esearch
M
anagement
endogenous domains as well with selected focus in both areas. In some cases, like roles, the participants offered information on themselves while commenting on data provided by their peers. Patterns that emerge in the data are presented as textural responses (what happened), structural responses (how did it happen), or composite descriptions (what the group experienced). Data responses that occurred most frequently within the theme category were given more significance and were typically mentioned first. Data was interpreted into theme patterns. These were broken into themes and then concisely into propositions, or findings of the study. Data items that referred to individuals, functions, line of business, locations, systems, or company names were obfuscated, eliminated, or given a pseudonym. The propositions, or findings, were formed and listed numerically. Within each proposition, a two-word summary was formed along with a statement that sums up the finding. For example, a central theme, norm strategy, or trigger may have emerged from the data as a result of coding. This data could then be categorized or filtered through the constructs being discussed that may include the strategic frame, horizontal strategies, or a narrowed scope as examples. This was the beginning of the theme map, or the outermost layer. The layers could then be elaborated on by breaking the outermost layer into sub-layers until it was reasonable to stop. This theme map was created to better describe the themes in the data and to show relationships and sequences between unique data items.Organizational Inertia
With an understanding of viscosity, and the clear connections between the physical world and the business world that this metaphor provides, we can now be more specific about change viscosity in organizations by describing organizational inertia. What is organizational inertia? Organizational inertia is the tendency of an organization to not want to move from its current path, including a lack of motivation to respond when resources change as well as a desire to sustain existing chaotic but routinized structures (Kelly & Amburgey, 1991). The reduction of organizational inertia allows a business unit to be nimble and adapt to a dynamic market as illustrated in the figure below. Conversely, organizational inertia is a significant contributor to change viscosity. Nimbleness is critical for the realization of growth. The rate at which the organization is constantly evolving must be greater than that of the competition (Grant, Pettigrew, Thomas, & Whittington, 2002). Some specific and practical examples of viscosity enablers that retard momentum are discussed below.
Reconciliation. When there is a need by the corporate center for data reconciliation for reports or analysis, the operation that is involved stops evolving and may stop servicing clients in order to obtain the information. Systems and the reports that they produce need to be synchronized with the questions corporate needs answered. This allows for quick decision making and reduces hours spent collecting data and analyzing it.
Oversimplification. The data that related to inertia revealed another theme, which is the tendency for leaders who are removed from where the work is being done to oversimplify the challenge ahead. This oversimplification results in false inferences about the business unit, the line of business (LOB), the support function, or the client. A decision is made or a path is laid out that results in strategic rework. The incorrect steps taken need to be reversed and the correct steps need to then be executed. This can delay organizational evolution by years and is a major source of inertia. Another example is the approval process that is tightly controlled by corporate. This process is a significant source of inertia. Corporate needs to be able to connect the staffing models to the effort needed to accomplish the work. In some cases, an oversimplified view of the complexity or the enormity of the work leads to the belief that staffing capacity or capability enhancements are not needed. This leads to an inability of staff to execute work and may lead to service failures or revenue opportunity refusal. In some cases it is possible to lay out a strategy that enables limited approval by the people who are addressing client needs or the idea of one large approval. This approval bundle streamlines the effort needed to pass through the approval stage of the project. These strategy-based approvals require thorough planning and a big picture perspective. For example, to create these plans the business units needed financial information in order to represent the project benefit to the company financially. They also needed recruiting information from HR, and infrastructure information from IT, etc.
[Joel* 6(7): July, 2019] ISSN 2349-4506
Impact Factor: 3.799
G
lobal
J
ournal of
E
ngineering
S
cience and
R
esearch
M
anagement
clients if there was a need. This process bypassed the bureaucracy that otherwise was a contributor to delayed approvals. Another suggestion was to have lunch with the CEO. Being so far removed, the CEO may not be aware of the great people and the excellence they produce daily. The opportunity to spend some time with the CEO and go directly to corporate officers can free up the flow of information. Trust and information flow allow for speed and organizational efficacy.Figure 3. Corporate: organizational inertia. This figure maps reduced organizational inertia as a theme category into descriptive sub-groupings.
Information. The relationship with corporate also centers on relevant information as illustrated in the figure below. A pattern in the data suggested that location and LOB leaders crave information from corporate. This information is necessary for growth. A significant pattern was that business leaders needed financial information. They wanted an appropriate level of detail, at the right time, and with accuracy. This information allows them to understand their financial performance, which is ultimately what they are measured against. The budget is also very important to business leaders. It needs to be influenced by business unit leaders as they know their markets and trends. It also needs to be accurate and made final in a timely manner. Finally, results against the budget also need to be available in a timely manner to enable faster decision making.
[Joel* 6(7): July, 2019] ISSN 2349-4506
Impact Factor: 3.799
G
lobal
J
ournal of
E
ngineering
S
cience and
R
esearch
M
anagement
Figure 4. Corporate: information. This figure maps information as a theme category into descriptive sub-groupings.
Support. The third theme category that emerged from the data was gaining support from corporate for initiatives. This is illustrated in the figure below. Entrepreneurial business leaders are dependent on corporate to support their initiatives. Business leaders indicated that having a singular security policy, university, hardware inventory system, and ERP would help with the realization of growth. Additionally, the consolidation of disparate ERP systems, enhanced the one-ness experienced by clients who accessed the system for order tracking information and reports.
Business leaders understand that their success is also dependent on the vendors that support them. When these vendors are not paid timely, they are less cooperative in a desperate situation, they change the payment method and terms, they raise prices because of payment risk, they may favor your competitors, and they do not offer the deals that they had previously. A consistent and timely payment history results in a vendor that will be very cooperative when needed.
[Joel* 6(7): July, 2019] ISSN 2349-4506
Impact Factor: 3.799
G
lobal
J
ournal of
E
ngineering
S
cience and
R
esearch
M
anagement
Figure 5. Corporate: support initiatives. This figure maps support initiatives as a theme category into descriptive sub-groupings (1MC is a one-ness program).
In summary, the data suggests that three patterns emerged from the data. The business leaders want corporate to assist them by reducing organizational inertia. They need relevant information. Entrepreneurial business leaders want to grow and achieve. They want to be supported in their efforts. They want to move quickly so that they can move on to the next achievement. They want information, specifically financial information, so that they can measure their own effectiveness and progress. The following propositions summarize the key findings of this section and can be viewed as elements for a theory on change viscosity:
Proposition 1 (corporate oversimplification): When corporate leaders oversimplify a complex situation, they create inertia; as decisions are not sufficiently robust, this results in residual work or unacceptable and unanticipated collateral damage.
Proposition 2 (organizational inertia): Entrepreneurial business leaders can achieve synergistic profitability faster when the relationship with corporate is streamlined and supportive.
[Joel* 6(7): July, 2019] ISSN 2349-4506
Impact Factor: 3.799
G
lobal
J
ournal of
E
ngineering
S
cience and
R
esearch
M
anagement
Proposition 4 (performance information): Business leaders benefit from performance information because they use it to recalibrate, course-correct, adapt plans, and monitor progress for the achievement of desirable outcomes.Proposition 5 (corporate awareness): In order for corporate to be supportive, they need to have a minimal understanding of the business unit’s function, capability, culture, systems, and its relationship with other business units or divisions.
Proposition 6 (one-ness support): One-ness is a complexity mitigation technique, embraced by corporate and business units alike, that accelerates profitable growth because it is a suitable platform on which growth can more easily take place.
Proposition 7 (synergistic connections): Corporate can help business units connect with other business units that have achieved synergistic capabilities that can be exploited.
Proposition 8 (talent retention): Corporate can assist business units to retain and mentor talent so that they can be leveraged to achieve growth synergies.
Entropy Mitigation
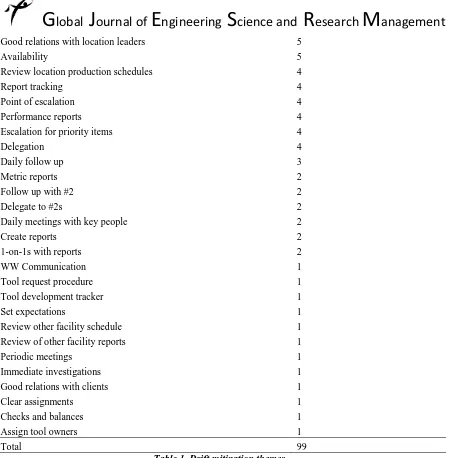
In order to sustain gains made in a complex organization, business leaders need to be attentive to organizational entropy that could lead to the erasure of performance gains. Change viscosity needs to be high going forward and low going backwards. This section discusses techniques used to mitigate this entropy, or backwards drifting, and allow for ongoing gains to be autonomous. Growth synergies will not be beneficial if the gains made in other related areas are not sustained. Business leaders need to address the tendency of an organization to drift if they are spread ineffectively across too many physical locations. With this in mind, qualitative inputs were collected, coded, and sorted into theme categories and are presented in the table below. The most frequent theme that emerged from the data was periodic communication. This would take a variety of forms. In the absence of information rumor would replace fact, leading to distraction and poor decision making. Some decisions can be automated through the enforcement of values which aid decision making. Alignment oriented decisions can happen in unrelated areas of the organization if they are anchored in embraced values. One participant said:
“Communicating and enforcing organizational values on daily basis so people automatically follow them while [I am] not here.” (DM70)
Making sure that the right people are aware of business changes was important. Leaving someone off of a distribution list or disallowing information to be available to key talent will result in drift due to a lack of transparency. Many good intentioned actions are not complete due to a lack of follow through. According to business leaders, action trackers, including tool development trackers, that are prioritized and appropriately delegated, along with frequent periodic updates, help with this. When dates are in jeopardy, it is necessary to have points of escalation. As the locations are dependent in the supply chain, consistency is also critical. The relationship that leaders have with each other helps with the building of trust that results in lower effort needed for change, communication flow, and peer accountability. This only works if they are available to each other. Reports are critical for communication and awareness. They include location production schedules, performance trends, and metrics. Exceptions need to be investigated with urgency and remedied to avoid performance drift from further non-conformities. If a business leader is not available, a #2 will need to make sure that entropy does not occur. The table below exposes 31 themes in order of occurrence from 99 rich data descriptions.
Theme Count
Periodic calls 12
Value enforcement 10
Distribution lists 8
[Joel* 6(7): July, 2019] ISSN 2349-4506
Impact Factor: 3.799
G
lobal
J
ournal of
E
ngineering
S
cience and
R
esearch
M
anagement
Good relations with location leaders 5
Availability 5
Review location production schedules 4
Report tracking 4
Point of escalation 4
Performance reports 4
Escalation for priority items 4
Delegation 4
Daily follow up 3
Metric reports 2
Follow up with #2 2
Delegate to #2s 2
Daily meetings with key people 2
Create reports 2
1-on-1s with reports 2
WW Communication 1
Tool request procedure 1
Tool development tracker 1
Set expectations 1
Review other facility schedule 1
Review of other facility reports 1
Periodic meetings 1
Immediate investigations 1
Good relations with clients 1
Clear assignments 1
Checks and balances 1
Assign tool owners 1
Total 99
Table 1. Drift mitigation themes.
According to data collected from business leaders, entropy drift would be mitigated by periodic personal communication. This includes personal meetings, like one-on-ones, daily follow up, having issues escalated as needed, being added to distribution lists, having a method for cross-business communication, and giving clear assignments. A second critical area for drift mitigation is the culture that is created by the business leader. This includes having checks and balances, enforcing values, setting clear expectations, and delegating tasks appropriately. The third area of drift mitigation was related to having or creating the right guiding documents. This includes performance reports, schedules, and action item trackers for each location. One participant said:
“[I] have a tracker to keep track of WW assignments, action items, and deadlines to complete them.” (DM27)
[Joel* 6(7): July, 2019] ISSN 2349-4506
Impact Factor: 3.799
G
lobal
J
ournal of
E
ngineering
S
cience and
R
esearch
M
anagement
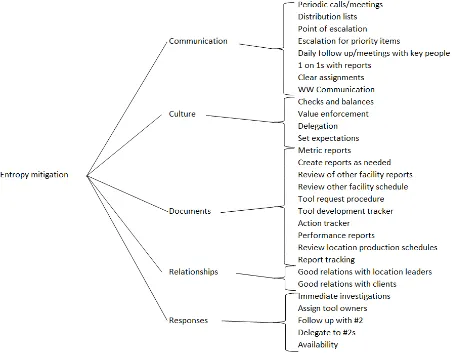
Figure 6. Entropy mitigation theme map. This figure maps entropy mitigation as a theme category into descriptive sub-groupings.
In summary, the data suggests that entropy in an organization is mitigated by communication, a suitable culture, robust documentation, strong working relationships, and response capability. A robust communication strategy augments awareness that could trigger a mitigating action. Continuous dialog and debate encourages an autonomous culture that makes the right decisions in the absence of the business leader, from buy-in to operating norms and executing the vision of the organization. Decisions will be made present in documentation that guides actions. Strong relationships will have fluid interaction uninhibited by fear of retribution should something go wrong. When information exchanged suggests that there is a drift opportunity, it can be investigated and mitigated. The following propositions summarize the key findings of this section:
[Joel* 6(7): July, 2019] ISSN 2349-4506
Impact Factor: 3.799
G
lobal
J
ournal of
E
ngineering
S
cience and
R
esearch
M
anagement
Proposition 10 (reaction speed): Performance reports are snapshots in time that are a delayed rather than an instantaneous means by which a reaction can ensue.Proposition 1 (integrating relationships): The ability to timely mitigate undesirable drift is enabled by relationships built on trust and accountability.
CONCLUSIONS
The purpose of this qualitative phenomenological research study was to explore change viscosity using a single case study of a multi-unit firm by examining how a complex organizational design could realize growth in a dynamic market. For example, recent studies have begun to suggest that products and services are experiencing shorter life-cycles (D’Aveni, Dagnino, & Smith, 2010). For the purpose of this study the phenomenon or object of the analysis was the precipitating event that led to permanent cross-business collaboration within the organization. The unit of analysis on which the phenomenon was studied is the strategy and the organizational design that leads to sustainable desired outcomes. These outcomes that are influenced by inertia and drift are described as sustained corporate advantage.
Contributions to Theory
The primary contribution of this article is new empirical insights about the effects of change viscosity on growth realization in an organization. These results are, therefore, relevant to the achievement of sustained profitability and competitive advantage by focusing a multi-unit firm on business unit relatedness and strategic complementarity. Eleven propositions were extracted from the participants instigated by a precipitated event that contribute to theory on change viscosity. These outcomes that influence change viscosity are described and useful for sustained corporate advantage.
Limitations and Future Research
The author attempted to develop generalizable theoretical findings based on the empirical results of a case study. Even so, this study encountered several limitations concerning theory and empirical study. The limitations were as follows:
1. There are some weaknesses regarding the generalizability of the findings. The single case study approach was based on approximately twenty in-depth interviews. Given that the phenomenon under investigation is novel and complex, this methodological choice seems reasonable. The research method mandates that in-depth observation is required for collecting and analyzing the resultant holistic data (Eisenhardt, 1989; Miles & Huberman, 1994; Siggelkow 2007; Yin, 1994). The choice of a phenomenological case study using a qualitative approach is affirmed; however, the generalizability of results is not exact due to the context of the case. The context is defined as a dynamic environment, a large size organization with a multi-national organizational structure, and a business with a relatively low degree of relatedness within a vertically integrated value chain. Other firm-specific factors, such as company history, may influence the exactness of the generalizations. The author understands that comparative case studies within similar contexts would help better ground evolving theories.
2. A single case study approach does not make it possible to determine the significance and weighting of drivers for the realization of sustainable growth. Drivers may occur in unique situations relevant to the single case study; however, they may not be relevant in general. Consequently, their general relevance may not be understood. This includes the relative importance of strategic actions and organizational design factors.
3. The research was limited by subjective interpretations of the data. This led to various theoretical constructs from qualitative information provided by participants. Subjective biases are reduced through the review of the coding process (Yin, 1994), using key informants for validating results (Mayring, 1996), and by following data analysis (Strauss & Corbin, 1990, 1996). Even so, this research still has associated risk due to potential subjective and invalid interpretations of quotations.
[Joel* 6(7): July, 2019] ISSN 2349-4506
Impact Factor: 3.799
G
lobal
J
ournal of
E
ngineering
S
cience and
R
esearch
M
anagement
assessments validating performance, and financial results over a time span of ten months were among the preexisting data that was used. While this is a short period for the assessment of sustained growth synergies, the author feels that this is adequate given the speed of the change driven by the transition from an M-form design to a multi-dimensional design. Additionally, this data was augmented and validated by interview data that was collected over approximately sixty days and which related to the experiences of the stakeholders who went through the transition. In the event that a longer period of time would have been used for the investigation, other important success factors may have emerged. Unfortunately, a longer-term observation period was beyond the time scope allotted to this study and this additional data would likely have produced little additional value.5. While this research design is holistic and multi-faceted, there were some limitations with regard to theory building. The nature of phenomena under investigation is complex as it includes strategic focused action, organizational design, and corporate management. As a result, the development of a complete and fulsome theory is constrained (Miles & Huberman, 1994). Given that reality based phenomena tends to be complicated, it follows that this study can only offer a mid-range theory of continuous growth realization while developing thought-provoking and new perspectives that may inspire creative theorizing in the future.
6. Finally, the selection of variables may be incomplete. While the analysis is focused on organizational factors of growth realization, like strategy and organizational design, other factors like leadership efficacy, human resource inspiration, and the embedding of human networks were generally neglected. These factors at the initiative level and personal level may impact successful cross-business unit collaboration (Martin, 2002; Martin & Eisenhardt, 2010) and, consequently, on the sustainable realization of growth synergies. As a result, the author suggests that further research is required for developing a more holistic theory on realizing sustainable growth synergies.
The author anticipates that the eleven propositions listed will stimulate further research as organizational behavior is significantly complex and situational. These observations are meant to stimulate further thinking. By studying the distinctive features of a complex organization, the author hopes that interest has been sparked on researching change viscosity further.
REFERENCES
1. Covey, S. M. R. (2006). The speed of trust: The one thing that changes everything. New York, NY: Simon & Schuster.
2. Creswell, J. W. (2014). Research design: Qualitative, quantitative, and mixed methods approaches. Thousand Oaks, CA: Sage.
3. D’Aveni, R. A., Dagnino, G. B., & Smith, K. G. (2010). The age of temporary advantage. Strategic
Management Journal, 31, 1371-1385.
4. Denzin, N. (1989). The research act. Englewood Cliffs, NJ: Prentice Hall.
5. Depraz, N., Varela, F., & Vermersch, P. (2003). On becoming aware: A pragmatics of experiencing. Philadelphia, PA: John Benjamins.
6. Eisenhardt, K. M. (1989). Building theories from case study research. Academy of Management Review, 14: 532-550.
7. Felin, T., & Foss, N. J. (2005). Strategic organization: A field in search of micro-foundations.
8. Finkelstein, S., Hambrick, D. C., & Cannella Jr, A. A. (2009). Top management teams. Strategic Leadership: Theory and Research on Executives, Top Management Teams, and Boards, 121-63. 9. Freeman, W. J. (2000). How brains make up their minds. New York, NY: Columbia University Press. 10. Gardner, W. L., & Cogliser, C. C. (2009). Meso-modeling of leadership: Following James G.(Jerry)
Hunt's lead in integrating micro-and macro-perspectives of leadership. The Leadership Quarterly, 20(4), 493-500.
11. Grant, R. M., Pettigrew, A. M., Thomas, H., & Whittington, R. (2002). Corporate strategy: Managing scope and strategy content. London, UK: Sage Publications.
[Joel* 6(7): July, 2019] ISSN 2349-4506
Impact Factor: 3.799
G
lobal
J
ournal of
E
ngineering
S
cience and
R
esearch
M
anagement
13. Hodgkinson, G. P., & Healey, M. P. (2011). Psychological foundations of dynamic capabilities:Reflexion and reflection in strategic management. Strategic Management Journal, 32(13), 1500-1516. 14. Kelly, D. & Amburgey, T. L. (1991). Organizational inertia and momentum: A dynamic model of
strategic change. Academy of Management Journal, 34(3), 591-612.
15. Lamnek, S. (1995). Qualitative sozial/forschung. (3rd ed.). Muenchen, Germany: Psychologie Verlags Union.
16. Lincoln, Y. S. & Guba, E. G. (1985). Naturalistic inquiry. Newbury Park, CA: Sage.
17. Martin, J. (2002). Cross-business synergies: recombination, modularity, and the multi-business team. Dissertation, Stanford University.
18. Martin, J. A., & Eisenhardt, K. M. (2010). Rewiring: Cross-business-unit collaborations in multibusiness organizations. Academy of Management Journal, 53(2), 265-301.
19. Mayring, P. (1996). Einfuehrung in die qualitative sozialforschung: Eine anleitung zu qualitativem
denken. Weinheim: Belz/PVU.
20. Miles, R. E. & Snow, C. (1994). Qualitative data analysis. Thousand Oaks, CA: Sage Publications. 21. Moustakas, C. (1994). Phenomenological research methods. Thousand Oaks, CA: Sage.
22. Powell, T. C., Lovallo, D., & Fox, C. R. (2011). Behavioral strategy. Strategic Management Journal, 32(13), 1369-1386.
23. Punch, K. F. (1998). Introduction to social research: Quantitative and qualitative approaches. London, UK: Sage Publications.
24. Siggelkow, N. (2007). Persuasion with case studies. Academy of Management Journal, 50, 20-24. 25. Stake, R. E. (1995). The art of case study research. Thousand Oaks, CA: Sage Publications.
26. Strauss, A. & Corbin, J. (1990). Basics of qualitative research techniques and procedures for developing
grounded theory. New York, NY: Sage Publications.
27. Strauss, A. & Corbin, J. (1996). Grounded Theory: Grundlagen qualitative sozialforschung. Weinheim, Germany: Beltz.
28. Sutton, R. T. & Straw, B. M. (1995). What theory is not. Administrative Studies Quarterly, 40, 371-384. 29. Tuncdogan, A., Van Den Bosch, F., & Volberda, H. (2015). Regulatory focus as a psychological
micro-foundation of leaders' exploration and exploitation activities. The Leadership Quarterly, 26(5), 838-850. 30. Weick, K. (1995). What theory is not, theorizing is. Administration Science Quarterly, 40, 385-391. 31. Weick, K. E., Sutcliffe, K. M., & Obstfeld, D. (2005). Organizing and the process of sensemaking.
Organization Science, 16(4), 409-421.
32. Winter, S. G. (1987). Competition and selection. The new Palgrave: A dictionary of economics. London, UK: Macmillan, 1, 545-548.
33. Winter, S. G. & Szulanski, G. (2002). Replication of organizational routines: Conceptualizing the exploitation of knowledge assets. In C. W. Choo & N. Bontis (Eds.), The strategic management of intellectual capital and organizational knowledge. Oxford, UK: Oxford University Press.
34. Yin, R. K. (1994). Case study research: design and methods. Newbury Park, CA: Sage Publications. 35. Zander, U. & Kogut, B. (1995). Knowledge and the speed of the transfer and imitation of organizational
capabilities: an empirical test. Organization Science, 6, 76-92.
36. Zander, I. & Solvell, O. (2000). Cross-border innovation in the multinational corporation. International