DOI: 10.22092/ijfs.2018.116991
Assessing benthic health of hard substratum macrobenthic
community using soft bottom indicators and their
relationship with environmental condition
Mehdipour N.
1*; Gerami M.H.
2; Nemati H.
3Received: April 2016 Accepted: June 2016
Abstract
This study aimed to assess ecological quality status of hard substratum macroinvertebrates communities of the Caspian Sea with three ecological indices and their relationship with environmental factors. For this purpose, benthic communities of the Caspian Sea basin were studied seasonally during 2014 in 8 sampling sites. Temperature, salinity, dissolved oxygen, pH, nitrate, nitrite, silicate and phosphate were measured as environmental factors. The benthic classification indices AMBI (AZTI Marine Biotic Index), M-AMBI (Multivariate AMBI) and BENTIX (BENthic IndeX) were applied to assess the ecological status of the studied area. Results showed low dissimilarity based on species composition and abundance among seasons, while all seasons discriminated clearly based on environmental factors. In addition, AMBI index was more successful to assess ecological health of hard substratum in the Caspian Sea basin than M-AMBI and BENTIX. Furthermore, AMBI showed high sensitivity to environmental variation. Results indicated that temperature, nitrate, silicate, phosphate and nitrite were the most important factors in the composition and abundance fluctuation of hard substratum macroinvertebrates communities, respectively.
Keywords: Benthic health, AMBI, M-AMBI, BENTIX, Environmental factors, Caspian Sea
1-Iranian National Institute for Oceanography and Atmospheric Sciences, Iran.
2-Young Researchers and Elite Club, Shiraz Branch, Islamic Azad University, Shiraz, Iran. 3-Faculty of Biological Sciences, Shahid Beheshti University.
*Corresponding author's Email: [email protected]
Introduction
Hard substratum benthic communities in coastal areas, especially those areas that located near or at urban and industrial centers, are highly affected by anthropogenic activates. (Fraschetti et al., 2001; Zalmon et al., 2011; Spaccesi and Rodrigues Capitulo, 2012). Although these shores support a rich biodiversity, but contaminations such as heavy metals and/or bacteria, nutrients from organic or industrial pollution from diverse sources and from sedimentation seriously affected the diversity and functioning of these ecosystems (Terlizzi et al., 2002; De Wolf et al., 2004; Piola and Johnston, 2008).
Hard communities are stressed environments; due to waste water discharges that is close to the coastline. These waters cause deterioration in water quality and discourage the settlement of several organisms; that affect these communities thriving in rocky-shores (Arévalo et al., 2007). Organic and nutrient enrichment due to domestic wastes is today one of the main reasons explaining the deterioration of marine nearshore ecosystems (Fletcher, 1996). In addition, seasonal oscillations in environmental conditions dramatically
influence the macrobenthic
communities in coastal waters (Reizopoulou et al., 2014). Benthic invertebrates and macroalgae are sedentary long lives, easy sampling organisms that many literatures published on their distribution in specific environments and on their response to different environmental
stresses (Zubikarai et al., 2014; Abbaspour et al., 2017; Ghorbanzadeh Zaferani et al., 2017). Therefore, these organisms are considered powerful indicators of environmental pollution. The AZTI Marine Biotic Index (AMBI, also referred to as BC) developed by Borja et al. (2000) evaluates ecological health condition in five categories based on the distribution of individual abundances in benthic communities. The species were distributed in those groups according to their sensitivity to an increasing stress gradient (enrichment of organic matter) (Glémarec and Hily, 1981; Hily, 1984). M-AMBI (‘Multivariate AMBI’, Bald et al., 2005; Muxika et al., 2007) is a multivariate index for assessing the ecological health and quality status of marine and transitional waters. It is based on benthic macroinvertebrates communities and integrates AMBI, a biotic index based on species sensitivity/tolerance, with diversity and richness (Sigovini et al., 2013). It aims to integrate the response of species richness, the Shannon diversity index (Shannon and Weaver, 1949) and the biotic index AMBI (Borja et al., 2000). Simboura and Zenetos (2002) designed new index based on the AMBI Index (Borja et al., 2000) with a re-combination of ecological groups that assigns different weighting coefficients and results to the reduction of macrozoobenthic data in three wider ecological groups (Simboura and Argyrou, 2010).
Anthropogenic disturbances and habitat natural changes are the most important factors in reaction of aquatic
organisms (Nouri et al., 2008; Saghali et al., 2013). Benthic fauna's structure is affected by environmental factors such as temperature, pH, dissolved oxygen and pollution (Sharma and Rawat, 2009; Saghali et al., 2013). Variation in these factors cause changes in rate of supply of organic matter and consequently affect the composition and abundance of marine organisms, such as macrobenthic communities (Erftemeijer and Herman, 1994; Bachelet et al., 2000).
Assessment of the
macroinvertebrates communities’ health in soft bottom substratum has progressed in recent years (Borja, 2005; Borja, 2006; Kutser et al., 2006; Pinedo et al., 2007; Borja et al., 2008), but data on hard substratum is limited. The aim of this study was to examine the hard-substratum benthic community organism in 8 sites of the Caspian Sea rocky seawalls under different environmental conditions and relate it to ecological status indices. Moreover, the study explores the applicability of three of the most commonly used soft
bottom benthic indices in assessing the ecological health in these coastlines.
Materials and methods
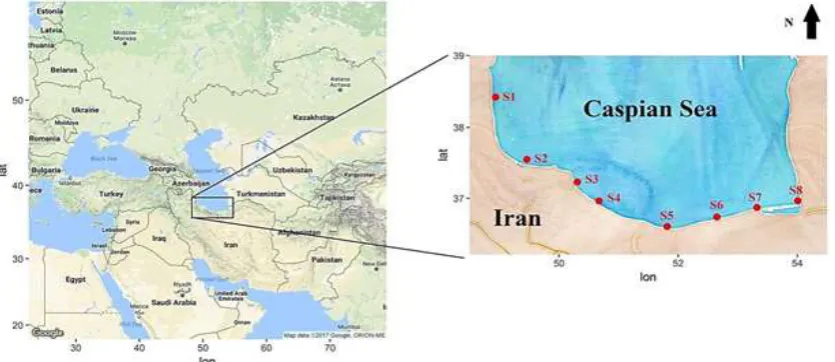
Sampling was performed in 8 sites form southwest to southeast shores of the Caspian Sea in Iranian waters basin. Sites were located to Astara (S1), Anzali (S2), Chamkhaleh (S3), Ramsar (S4), Sisangan (S5), Babolsar (S6), Amirabad (67) and Khajeh Nafas (S8) (Fig. 1; Table 1). Sampling was done at the midpoint of each season from spring to winter 2014. Temperature, salinity, dissolved oxygen and pH were measured using the portable multi-meters (HACH 51154, USA) with three replicates in each site. Species area curve method applied for sampling
from (
Browne
, 1996). 20×20 cm quadrat (0.04 m2) was performed on rocky substratum from supralittoral zone to sample from macrobenthic communities with three replicate and samples were preserved in 4% formalin. In the laboratory, the macrofauna were sorted, identified up to species level and counted (Freeman and Bracegirdle, 1971).Figure 1: Map showing the sampling locations in the southern Caspian Sea (2014).
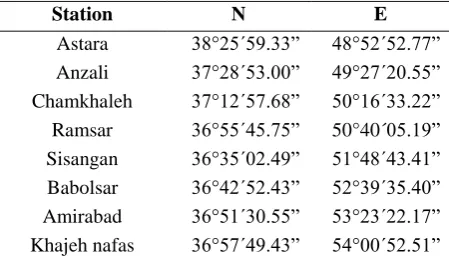
Table 1: Geographical coordinates of the stations.
Surface water samples were collected simultaneously from rock pools in all the selected sampling sites for analysis the nutrient contents. Water nutrient concentration was measured according to photometric methods (Wood et al., 1967; Strickland and Parsons, 1972). Phosphate analyzed by a modified ascorbic acid reduction method and silicate assessed based on calorimeter with formation of molybdic acid (Strickland and Parsons, 1972). Nitrite determined by colorimetric and ion chromatographic methods and nitrate was measured based on cadmium-copper reduction to nitrite (Wood et al., 1967).
AMBI, M-AMBI and BENTHIX biotic indices were calculated by following methods: To calculate the AMBI and M-AMBI, the free software (http://www.azti.es v.4) along with the guidelines from the authors (Borja and Muxika, 2005) was used in this study. There are no proposed reference values for M-AMBI in the Caspian Sea; therefore, due to similarity of the Caspian Sea with Mediterranean lagoons, (mean average of temperature: 16 to 23 °C for Mediterranean lagoons and 13 to 31 °C for Caspian Sea in this
study; salinity from 0 to 36 ppm for Mediterranean lagoons and 0 to 16 ppm for Caspian Sea in this study; Oxygen from 0 to 14 mL L-1 for Mediterranean lagoons and 0 to 11 mL L-1 for Caspian Sea in this study; Nitrate from 0.1 to 300 µg L-1 for Mediterranean lagoons and 0 to 600 µg L-1 for Caspian Sea in this study; pH from 7.5 to 9.8 µg L-1 for Mediterranean lagoons and 8.3 to 8.9 µg L-1 for Caspian Sea in this study (López and Tomàs, 1989). The reference values for M-AMBI were set as: Diversity=0 to 1.62, S=0 to 7 and AMBI=0.09 to 4, based on AMBI calculation. To calculate the BENTIX (BENthic IndeX) (Add-in v.1.0 version) the software for MS Excel 2007 has been used downloaded free from: http://www.hcmr.gr/en/articlepage.php? id=141. Diversity indices (Margalef, Pielou, Shannon and Simpson) and MDS analyses were carried out using the PRIMER v5 software package, developed in the Plymouth Marine Laboratory. Canonical Correlation Analysis (CCA) and Canonical Discriminant Analysis (CDA) analysis was assessed by R statistical packages (Version 3.13, CCA package). SIMPER analysis preformed to assess
Station N E
Astara 38°25´59.33” 48°52´52.77” Anzali 37°28´53.00” 49°27´20.55” Chamkhaleh 37°12´57.68” 50°16´33.22” Ramsar 36°55´45.75” 50°40´05.19” Sisangan 36°35´02.49” 51°48´43.41” Babolsar 36°42´52.43” 52°39´35.40” Amirabad 36°51´30.55” 53°23´22.17” Khajeh nafas 36°57´49.43” 54°00´52.51”
dissimilarities between seasons and sites. In addition, Tow-Way-PERMANOVA with 9999 permutations carried out to determine significant difference between environmental factors in different seasons and sites by PERMANOVA 1.6-Anderson.
Results
The differences among the eight sites regarding to the environmental
parameters are illustrated in the CDA analysis (Fig. 2). It shows that all seasons discriminated clearly. However, this separation was higher between summer with other seasons. In addition, temperature and pH was the most important factors in discriminant analysis.
Figure 1: CDA analysis for environmental parameters
in all sites (Sal= Salinity, Temp=
Temperature, Phos= Phosphate, Sil= Silicate,
Nitra= Nitrate, Nitri= Nitrite and O2=
Oxygen).
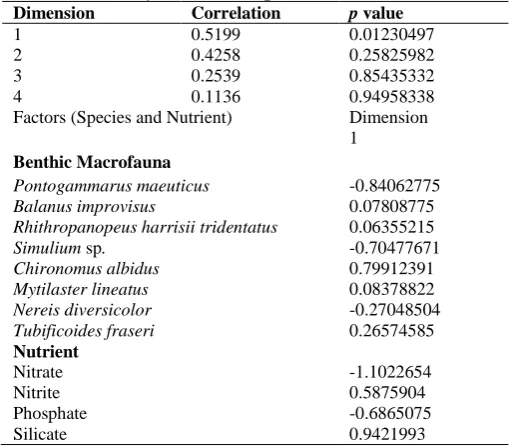
Tests of dimensionality and standardized for the canonical correlation analysis, as shown in Table
2 and Fig. 2, indicate that one of the four canonical dimensions are statistically significant at the .05 level.
Table 2: CCA analysis between species and nutrients in all sites
Dimension Correlation p value
1 0.5199 0.01230497
2 0.4258 0.25825982
3 0.2539 0.85435332
4 0.1136 0.94958338
Factors (Species and Nutrient) Dimension 1
Benthic Macrofauna
Pontogammarus maeuticus -0.84062775
Balanus improvisus 0.07808775
Rhithropanopeus harrisii tridentatus 0.06355215
Simulium sp. -0.70477671
Chironomus albidus 0.79912391
Mytilaster lineatus 0.08378822
Nereis diversicolor -0.27048504
Tubificoides fraseri 0.26574585
Nutrient
Nitrate -1.1022654
Nitrite 0.5875904
Phosphate -0.6865075
Silicate 0.9421993
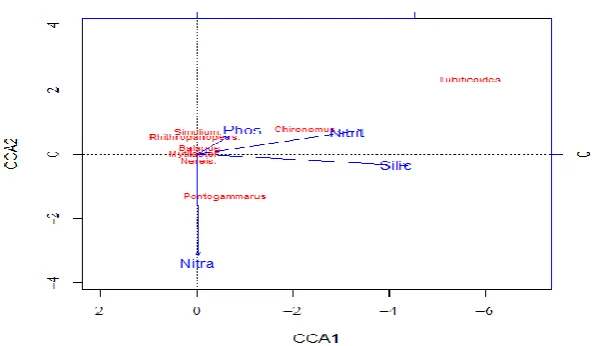
Fig. 3 shows CCA plot between
environmental factors and
macroinvertebrates community. According to the plot, Chironomus albidus had strong positive relationship
with nitrate. In addition, feebly positive relationship was observed between Tubificoides fraseri and nitrate and phosphate.
Figure 2: Two dimensional CCA plot for benthic macrofaunal and
nutrients variables (Phos=Phosphate, Nitrit=Nitrite,
Nitra=Nitrate and Silic=Silicate).
For the Benthic macrofauna variables dimension 1 was most strongly
influenced by Pontogammarus
maeuticus. For the nutrient variables, nitrate was the strongest variable than other parameters.
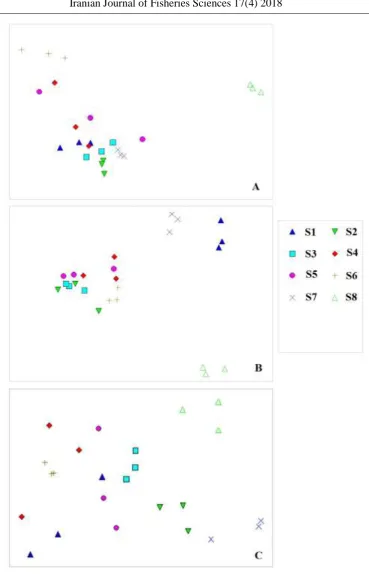
Fig. 4 shows MDS ordination plot based on environmental (e.g. salinity, temperature etc.), benthic communities and nutrition conditions (e.g.
phosphates, nitrates etc.). Results indicate that site 8 and 6 was grouped clearly according to environment, while site 1, 7 and 8 was clearly separated by benthic condition. Furthermore, analyzing based on nutrient condition in sites revealed that site 7, 2, 8, 3 and 6 was clearly grouped and discriminated from other sites.
Iranian Journal of Fisheries Sciences 17(4) 2018 647
Figure 4: Multidimensional scaling based on: A) environmental condition, B) benthic composition, and C) nutrients conditions in the southern Caspian Sea (2014).
Table 2 shows SIMPER analysis among sites and time series. Data analysis indicated there were different guilds of benthic species at each of these eight communities, which are principally
responsible for differences between, as well as dissimilarity within benthic assemblages. Mytilaster lineatus, P. maeuticus and Balanus improvises were contributed to dissimilarity within all
compared sites and determined the community structure within benthic communities.
Table 3 lists the average values of the biotic classification indices (AMBI, M-AMBI and BENTIX) and the resulting ecological quality status (EQS) for the
eight sites. Based on the average values, results showed that all indices were in a uniform range. In fact, undistributed status in AMBI indices coincided with good status in M-AMBI and high status in BENTIX indices, relatively.
Table 3: Values of the classification metrics and respective EQS assessment in the all sites.
Site EQS AMBI M-AMBI BENTIX
Spring Summer Autumn Winter Spring Summer Autumn Winter Spring Summer Autumn Winter
S1 Score 3.185 4.5 0.409 7.00 0.55 0.16 0.72 -0.05 2.40 2 6 1
EQS SD MD Un ED M B M B P P H B
Total S1 SD G M
S2 Score 0.295 0.206 0.339 0.413 0.67 0.57 0.83 0.74 5.90 5.9 5.8 5.9
EQS S2 Un Un Un Un G M G M H H H H
Total S2 Un G H
S3 Score 0.056 1.283 0.469 0.933 0.63 0.94 0.80 0.93 5.98 4.8 5.8 5.8
EQS S3 Un SD Un Un G H G G H H H H
Total S3 Un G H
S4 Score 0.617 2.855 0.517 1.493 0.65 0.50 0.64 0.94 5.99 3.5 5.7 4.9
EQS S4 Un SD Un SD G P M G H M H H
Total S4 Un G H
S5 Score 0.305 1.484 1.209 0.589 0.46 0.64 0.95 0.84 6 4.5 5.5 5.5
EQS S5 Un SD SD Un P M G G H H H H
Total S5 Un G H
S6 Score 1.313 1.700 0.126 0.309 0.93 0.83 0.66 0.78 4.90 4 5.7 5.8
EQS S6 SD SD Un Un H G M G H G H H
Total S6 Un H H
S7 Score 4.474 3.677 0.136 1.868 0.25 0.55 0.54 0.59 2 3 6 4.3
EQS S7 MD MD Un SD B M P M P M H G
Total S7 SD G M
S8 Score 1.825 7.00 7.00 7.00 0.60 -0.05 -0.05 -0.05 5.5 1 1 1
EQS S8 SD ED ED ED M B B B H P P P
Total S8 SD M H
SD= Slightly disturbed, Un= Undisturbed, MD= Moderately disturbed, ED= Extremely disturbed, P= Poor, B=Bad, G= Good, H= High and EQS= Ecological quality status.
PERMANOVA test performed on nutrient data and results showed seasonal changes in nutrient content with significant differences between each season (p<0.05). According to PERMANOVA test results nitrate significantly varied between seasons in S1, S4 and S8 (p<0.05) and Nitrite
varied between seasons in S1, S3 and S7 (p<0.05). Phosphates and silicates showed significant seasonal oscillation only in site S8 (p<0.05). Silicate had significant different amounts in summer in comparison with autumn and winter in all sites (p<0.05).
Table 4: Abundance of species during the study in the southern Caspian Sea (2014)
Species Ecological Scores
Abundance (number)
S1 S2 S3 S4 S5 S6 S7 S8 AMBI BENTIX
Pontogammarus maeuticus IV 2 15
62 38
7 13 25
44 00
24 75
45 0
42 86
49 8
Balanus improvisus II 1 25 64
29 12 66 2
20 33
18 01
49 25 75
86 50
Rhithropanopeus harrisii tridentatus II 1 0 0 75 0 0 25 0 0
Table 4 continued:
Simulium sp. IV 2 0 37 0 0 0 50 0 0
Chironomus albidus III 2 10
62 26 2 92 5 17
5 0 40
00 75 0
Mytilaster lineatus I 1 57
5 14 31 37 13 22 50 37 05 0 11 45 87 15 73 6 24 75 27 5
Nereis diversicolor III 2 0 22
5 11 50 22 5 17 5 40 0 50
20 0
Tubificoides fraseri V 2 50 0 0 0 0 0 0 0
Total -- -- 32
74 15 04 77 14 83 87 43 88 3 11 90 38 25 58 6 69 61 96 23 Discussion
Trophic interactions are the most important factor in macrobenthic spatial and temporal variation in coastal environment (Boaventura et al., 1999). Koutsoubas et al. (2000) declared that frequent fluctuations in environmental parameters (daily, monthly or seasonal basis) would cause changes in the structure and distribution pattern of organisms. Furthermore, natural disturbance often results in the instant destruction of great numbers of individuals (Guelorget and Perthuisot, 1992). These faunal communities’ structural changes are principal factors for assessing ecological health by ecological indicators.
Nutrient content is the main factor responsible for fluctuation in benthic macrofaunal assemblages (Aller et al., 2001; Kuffner and Paul, 2001; Stief et al., 2002; Sivadas et al., 2012; Amiri et al., 2014). In this study CCA analysis revealed that nutrient group most strongly influenced by nitrate and silicate (Table 2) and Fig. 3 showed that distribution of species was less associated with phosphate than other nutrients. There is plenty of evidence that phosphate is the main limiting
nutrient factor in freshwater ecosystems and it was significantly different among seasons. However, Howarth et al. (2000) reported that in many coastal marine systems the limiting nutrient is usually nitrogen. In addition, Gao et al. (2011) declared that total nitrogen was among the main environmental factors affecting the distribution of
macrobenthos, and ammonium
nitrogen, nitrate nitrogen, and chlorophyll a also had definite effects. In addition, Lamptey and Armah (2008) stated that spatial and seasonal variability in silicate resulted in habitat heterogeneity among the sampling stations and this heterogeneity among the stations because of the environmental variables possibly created conditions that influenced the abundance patterns of the macrobenthic fauna. Overall results showed that seasonal changes of macroinvertebrates communities were highly associated with environmental factors.
Table 3 showed that all sites had acceptable ecological conditions based on AMBI index. Overall sites, 3 slightly disturbed and 5 undistributed status occasions were observed. According to PERMANOVA results temperature, oxygen, phosphate, and
nitrite were the main factors that varied significantly between seasons in whole study area. In addition, all nutrient factors varied significantly between sites. MDS plot based on the benthic
communities, demonstrated
discrimination between S1, S7 and S8 with other sites (Fig. 4B). AMBI clearly separated these sites from the rest in the analysis, M-AMBI could not distinguish these sites and BENTIX was successful in separating S1 and S7 from other sites (Table 3). However, M-AMBI was successful to distinguish S1, S7 and S8 in seasonal analysis from other sites similarly to other indices. Table 4 shows that S1, S7 and S8 had fewer total species than other sites. P. maeuticus and B. improvisus were dominant in S1 and S7, and S8, respectively. High dominance of P.
maeuticus with IV score in AMBI
index, resulted changes in ecological status for these sites. The resulted ecological status by M-AMBI diverge from the results of AMBI due to the diversity components included in the method. Species scores are equal in AMBI and M-AMBI formula; and changes in reference value for AMBI, Diversity and Richness; caused changes in calculation of M-AMBI in comparison of AMBI. In addition, B. improvises with score 1 in BENTIX index, was dominant in S8 and resulted to high status classification for this site, while P. maeuticus with score 2 was dominant in S1 and S7 (Table 4). Furthermore, analysis of nutrient content and environmental condition showed that S7 and S8 were clearly separated from other sites (Figs. 4 A,
4C), while S1 overlapped. These changes in ecological health assessment based on macroinvertebrates were also observed in Mediterranean basin. Reizopoulou et al. (2014) reported that BENTIX and M-AMBI underestimated and AMBI overestimated the ecological status of Mediterranean coastal lagoons. Borja et al. (2008) stated that the greatest number of disagreements when comparing AMBI or M-AMBI with other indices is found in low salinity locations. The Caspian Sea is an enclosed inland body of water with average salinity of 13 ppm (Karbassi et al., 2008) and is very low in contrast of estuarine and marine salinity. The problems in assessing the benthic ecological status in low salinity or highly changing salinity habitats have been discussed under the ‘Estuarine Quality Paradox’ (Dauvin et al., 2007; Elliott and Quintino, 2007). In addition, Fig. 2 showed that all seasons were discriminated based on environmental condition and the Caspian Sea basins have highly variable ecosystems. Zubikarai et al. (2014) described two reasons for variation in species richness between rocky substratum s. They declared that reasons for these differences can be (i) lower discharge or (ii) much higher wave energy between sites. However, equitable distribution of trophic groups in environment and sampling area, indicate a healthier ecosystem functioning and, as such, an improvement in the quality of the environment (Bremner et al., 2006). Although many benthic indices were successfully validated during the last
decade, most indices and assessment scales were developed for local geographic regions, and often only for specific habitats within the region (Borja and Tunberg, 2011). In fact, species composition and reference conditions change naturally with ecoregion and habitat (Borja et al., 2009). Therefore, many studies have been conducted to establish different reference conditions for different estuarine habitats before benthic condition assessment (Weisberg et al., 1997; Borja et al., 2008; Teixeira et al., 2008). However, authors set reference value for M-AMBI based on AMBI calculation (by default. Furthermore, these three indices were established to apply for soft bottom communities and employed for hard substratum communities in this study. Nevertheless, some of them have been also successfully applied also for hard bottom communities as BENTIX index in Bhosphorus Strait communities (Kalkan et al., 2007) and was successful to separate control and discharge communities.
Results of this study revealed the weakness of the biotic indices to reflect and discriminate among the anthropogenic and natural stress in the hard substratum ecosystems as well. In addition, species sensitivity, richness and diversity as benthic community traits do not seem to function well in assessing the ecological quality status in these ecosystems. However, AMBI index was more successful to assess ecological health of hard substratum in the southern Caspian Sea basin compared to M-AMBI and BENTIX. In
addition, AMBI showed high sensitivity to environmental variation. Indeed, successful classification of these indices is highly relevant to regional ecological conditions. For instance, Simboura and Reizopoulou (2008) studied the rocky deep and sedimentary shallow water body type three lagoonal sites located in Greece (Eastern Mediterranean) and stated that In the studied the rocky deep areas the BENTIX index seems to give a more biologically relevant and consistent with the environmental conditions classification, compared to the AMBI assessment, while BENTIX was more successful in this study. Furthermore, results indicated that temperature, nitrate, silicate, phosphate and nitrite were the most important factors in spatial and temporal variations of hard substratum macroinvertebrates communities, respectively.
Further studies should be conducted to determine reference value and boundary limits for hard substratum region especially in the southern Caspian Sea. It should be noted that dominant species, food webs, habitat structure, life span and cycle, reproductive rate and dispersal potential are important factors that affect ecological quality status of ecosystems and should be considered in analysis.
Acknowledgments
The financial support received from the Iranian National Institute for Oceanography and Atmospheric Sciences for this research work is gratefully acknowledged.
References
Abbaspour, F., Mirdar Hajirani, J., Gharaei, A., Iezadi, G.H., 2017.
Biological assessment of the Tang Sorkh River (Iran) using benthic macroinvertebrates. Iranian Journal of Fisheries Sciences. 16(3) 1008-1020.
Aller, J.Y, Woodin, S.A. and Aller, R.C., 2001. Organism sediment interactions. Columbia: University of South Carolina Press.403pp.
Amiri, N., Jamili, S. and Abdolbaghian, S., 2014. Diversity of macrobenthos communities and
their relationships with
environmental factors in Jajroud River, Iran. Resources and Environment, 4(2), 95-103.
Arévalo, R., Pinedo, S. and Ballesteros, E., 2007. Changes in the composition and structure of
Mediterranean rocky-shore
communities following a gradient of nutrient enrichment: descriptive study and test of proposed methods to assess water quality regarding macroalgae. Marine Pollution Bulletin, 55(1), 104-113.
Bachelet, G., De Montaudouin, X., Auby, I. and Labourg, P.J., 2000.
Seasonal changes in macrophyte and macrozoobenthos assemblages in three coastal lagoons under varying degrees of eutrophication. ICES Journal of Marine Science, 57(5), 1495-1506.
Bald, J., Borja, A., Muxika, I., Franco, J. and Valencia, V., 2005.
Assessing reference conditions and physico-chemical status according to the European Water Framework Directive: a case-study from the
Basque Country (Northern Spain). Marine Pollution Bulletin, 50, 1508– 1522.
Boaventura, D., Cancela da Fonseca, L. and Teles-Ferreira, C., 1999.
Trophic structure of macrobenthic communities on the Portuguese coast. A review of lagoonal, estuarine and rocky littoral habitats. Acta Oecologica, 20(4), 407-415.
Borja, A., Franco, J. and Pe´rez, V., 2000. A marine biotic index to establish the ecological quality of soft-bottom benthos within European estuarine and coastal environments. Marine Pollution Bulletin, 40, 1100– 1114.
Borja, A., 2005. The European water frame work directive: a challenge for nearshore, coastal and continental shelf research. Continental Shelf Research, 25(14), 1768–1783.
Borja, A. and Muxica, I., 2005.
Guidelines for the use of AMBI (AZTI’s Marine Biotic Index) in the assessment of the benthic ecological quality. Marine Pollution Bulletin, 50, 787-789.
Borja, A., 2006. The new European marine strategy directive: difficulties, opportunities, and challenges. Marine Pollution Bulletin, 52, 239–242.
Borja, A., Dauer, D.M., Diaz, R., Llansó, R.J., Muxika, I., Rodriguez, J.G. and Schaffner, L., 2008. Assessing estuarine benthic quality conditions in Chesapeake Bay: a comparison of three indices. Ecological Indicator, 8(4), 395-403.
Borja, A., Ranasinghe, A. and Weisberg, S.B., 2009. Assessing
ecological integrity in marine waters, using multiple indices and ecosystem components: challenges for the future. Marine Pollution Bulletin, 59, 1–4.
Borja, A. and Tunberg, B.G., 2011. Assessing benthic health in stressed subtropical estuaries, eastern Florida, USA using AMBI and M-AMBI. Ecological Indicator, 11, 295-303.
Bremner, J., Rogers, S.I. and Frid, C. L.G., 2006. Methods for describing ecological functioning of marine benthic assemblages using biological traits analysis (BTA). Ecological Indicator, 6, 609-622.
Browne, J.B. and Peck. S.B., 1996.
The long-horned beetles of south Florida (Cerambycidae: Coleoptera): biogeography and relationships with the Bahama Islands and Cuba. Canadian Journal of Zoology 74, 2154-2169.
Dauvin, J.C., Ruellet, T., Desroy, N. and Janson, A.L., 2007. The ecological quality status of the Bay of Seine and the Seine estuary: use of biotic indices. Marine Pollution Bulletin, 55, 241–257.
De Boer, W. F. and Prins, H. H., 2002. Human exploitation and benthic community structure on a tropical intertidal flat. Journal of Sea Research, 48(3), 225-240.
De Wolf, H., Backeljau, T. and Blust, R., 2004. Sensitivity to cadmium along a salinity gradient in populations of the periwinkle, Littorina littorea, using time-to-death analysis. Aquatic Toxicology, 66(3), 241-253.
Elliott, M. and Quintino, V.M., 2007.
The estuarine quality paradox, environmental homeostasis and the difficulty of detecting anthropogenic stress in naturally stressed areas. Marine Pollution Bulletin, 54, 640– 645.
Erftemeijer, P.L. and Herman, P.M., 1994. Seasonal changes in environmental variables, biomass, production and nutrient contents in two contrasting tropical intertidal seagrass beds in South Sulawesi, Indonesia. Oecologia, 99(1-2), 45-59.
Fletcher, R.L., 1996. The occurrence of ‘‘green tides’’da review. In: Schramm, W., Nienhuis, P.H. (Eds.), Marine benthic vegetation. Recent changes and the effects of eutrophication. Ecological Studies., vol. 123. Springer-Verlag, Berlin, Heidelberg, pp. 7-43.
Fraschetti, S., Bianchi, C.N., Terlizzi, A., Fanelli, G., Morri, C. and Boero, F., 2001. Spatial variability and human disturbance in shallow subtidal hard substrate assemblages: a regional approach. Marine Ecology Progress Series, 212, 1–12
Freeman, W. and Bracegirdle, B., 1971. An atlas of invertebrate structure. Heireman Educational book. Hong Kong. 129pp
Gao, X., Niu, C.J. and Hu, Z.J., 2011.
Macrobenthos community structure and its relations with environmental factors in Taihu River basin. Ying Yong Sheng Tai Xue Bao, 22(12), 3329-36.
Glémarec, M. and Hily, C., 1981. Perturbations apportées a la
macrofaune benthique de la Baie de Concarneau par les effluents urbains et portuaries. Acta Oecologica Application, 2(2), 139–150.
Ghorbanzadeh Zaferani, S.Gh., Machinchian Moradi, A., Mousavi Nadushan, R., Sari, A.R., Fatemi, S.M.R., 2017. Spatial and temporal patterns of benthic macrofauna in Gorgan Bay, south Caspian Sea, Iran. Iranian Journal of Fisheries Sciences, 16(1), 252-274.
Guelorget, O. and Perthuisot, J.P., 1992. Paralic ecosystems. Biological organization and functioning. Vie et Milieu, 42, 215–251.
Hily, C., 1984. Variabilité de la macrofauna benthique dans les milieux hypertrophiques de la Rade de Brest. Thése de Doctorat d’Etat, Univ. Bretagne Occidentale. 1, 359- 2, 337.
Howarth, R.W., Anderson, D.M., Church, T.M., Greening, H., Hopkinson, C.S., Huber, W.C., Marcus, N., Naiman, R.J., Segerson, K., Sharpely, A. and Wiseman, W.J., 2000. Clean coastal waters: Understanding and reducing the effect of nutrient pollution. National academy press. Washington D.C. https://doi.org/10.17226/9812. 405pp.
Kalkan E., Karhan, S.Ü., Mutlu, E., Simboura, N. and Bekbölet, M., 2007. Application of the Bentix index in assessing ecological quality of hard substrata: a case study from the Bosphorus Strait (Turkey). Mediterranean Marine Science, 8(1), 15-29
Karbassi, A.R., Nouri, J., Mehrdadi, N. and Ayaz, G.O., 2008.
Flocculation of heavy metals during mixing of freshwater with Caspian Sea water. Environmental Geology, 53(8), 1811-1816.
Koutsoubas, D., Dounas, C., Arvanitidis, C., Kornilios, S., Petihakis, G., Triantafyllou, G. and Eleftheriou, A., 2000.
Macrobenthic community structure and disturbance assessment in Gialova Lagoon, Ionian Sea. Journal of Marine Science, 57(5), 1472-1480.
Kuffner, I.B. and Paul, V.J., 2001. Effects of nitrate, phosphate and iron on the growth of macroalgae and benthic cyanobacteria from Cocos Lagoon, Guam. Marine Ecology Progress Series, 222, 63-72.
Kutser, T., Vahtmäe, E. and Martin, G., 2006. Assessing suitability of multispectral satellites for mapping benthic macroalgal cover in turbid coastal waters by means of model simulations. Estuarine Coastal Shelf Science, 67(3), 521-529.
Lamptey, E. and Armah, A.K., 2008.
Factors affecting microbenthic fauna in a tropical hypersaline coastal lagoon in Ghana, West Africa.
Coastal and Estuarine, 31,
1006.1019.
López, M.P. and Tomàs, X., 1989.
Chemical composition of the small coastal lagoons of the Mediterranean Spanish littoral. Scientia Marina, 53(2), 591-599.
Muxika, I., Borja, A. and Bald, J., 2007. Using historical data, expert judgement and multivariate analysis
in assessing reference conditions and benthic ecological status, according to the European Water Framework Directive. Marine Pollution Bulletin, 55, 16–29.
Nouri, J., Karbassi, A.R. and Mirkia, S., 2008. Spatial distribution and
assemblage structure of
macrobenthos in a tidal creek in relation to industrial activities.
International Journal of
Environmental Science and
Technology, 6, 651-662.
Pinedo, S., García, M., Satta, M. P., De Torres, M. and Ballesteros, E., 2007. Rocky-shore communities as indicators of water quality: a case study in the Northwestern Mediterranean. Marine Pollution Bulletin, 55(1), 126-135.
Piola, R.F. and Johnston, E.L., 2008. Pollution reduces native diversity and increases invader dominance in marine hard‐substrate communities. Diversity and Distributions, 14(2), 329-342.
Reizopoulou, S., Simboura, N., Sigala, K., Barbone, E., Aleffi, F., Kaisakis, G., Basset, A. and Nicolaidou, A., 2014. Assessing the ecological status of Mediterranean
coastal lagoons using
macroinvertebrates. Comparison of the most commonly used methods.
Mediterranean Marine Science,
15(3), 602-612.
Saghali, M., Baqraf, R., Hosseini, S.A. and Patimar, R., 2013.
Benthic community structure in the Gorgan Bay (Southeast of the Caspian Sea, Iran): Correlation to water physiochemical factors and
heavy metal concentration of sediment. International Journal of Aquatic Biology, 1(5), 245-253.
Shannon, C. E. and Weaver, W., 1949. The mathematical theory of communication. University of Illinois Press, Urbana. 1-117.
Sharma, R.C. and Rawat, J.S., 2009.
Monitoring of aquatic
macroinvertebrates as bioindicator for assessing the health of wetlands: A case study in the Central Himalayas, India. Ecological Indicators, 9, 118-128.
Sigovini, M., Keppel, E. and Tagliapietra, D., 2013. M-AMBI revisited: looking inside a widely-used benthic index. Hydrobiology, 717(1), 41-50.
Simboura, N. and Zenetos, A., 2002.
Benthic indicators to use in ecological quality classification of Mediterranean soft bottom marine ecosystems, including a new biotic index. Mediterranean Marine Science, 3, 77–111.
Simboura N. and Reizopoulou, S., 2008. An intercalibration of classifiation metrics of benthic macroinvertebrates in coastal and transitional ecosystems of the Eastern Mediterranean ecoregion (Greece). Marine Pollution Bulletin, 56, 116-126.
Simboura, N. and Argyrou, M., 2010.
An insight into the function of benthic classification indices tested in Eastern Mediterranean coastal waters. Marine Pollution Bulletin, 60(5), 701-709.
Sivadas, S.K., Ingole, B., Ganesan, P., Sautya, S. and Nanajkar, M., 2012.
Role of environmental heterogeneity in structuring the macrobenthic community in a tropical sandy beach, west coast of India. Journal of Oceanography, 68(2), 295-305.
Spaccesi, F.G. and Rodrigues Capitulo, A., 2012. Benthic communities on hard substrates covered by Limnoperna fortunei Dunker (Bivalvia, Mytilidae) at an estuarine beach (Río de la Plata, Argentina). Journal of Limnology, 71, 144-153.
Stief, P., Beer, D. and Neumann, D., 2002. Small-scale distribution of interstitial nitrite in freshwater sediment microcosms: the role of nitrate and oxygen availability, and sediment permeability. Microbial Ecology, 43(3), 367-377.
Strickland, J.D.H. and Parsons, T.R., l972. A practical handbook of seawater analysis: Bulletin of Fisheries Research Board of Canada. 2nd ed.Canada. Alger Press Ltd.
Teixeira, H., Salas, F., Neto, J. M., Patrício, J., Pinto, R., Veríssimo, H., García-Charton, J.A., Marcos, C., Pérez-Ruzafa, A. and Marques, J.C., 2008. Ecological indices tracking distinct impacts along disturbance-recovery gradients in a temperate NE Atlantic Estuary – guidance on reference values. Estuarine Coastal and Shelf Science, 80, 130–140.
Terlizzi, A., Fraschetti, S., Guidetti, P. and Boero, F., 2002. The effects of sewage discharge on shallow hard substrate sessile assemblages.
Marine Pollution Bulletin, 44(6), 544-550.
Weisberg, S.B., Ranasinghe, J.A., Dauer, D.M., Schaffner, L.C., Díaz, R.J. and Frithsen, J.B., 1997.
An estuarine benthic index of biotic integrity (B-BI) for Chesapeake Bay. Estuaries, 20, 149–158.
Wood, E. D., Armstrong, F.A.J. and Richards, F.A., 1967.
Determination of nitrate in sea water by cadmium-copper reduction to nitrite. Journal of the Marine Biological Association of the UK, 47(1), 23-31.
Zalmon, I.R., Krohling, W. and Ferreira, C.E.L., 2011. Abundance and diversity patterns of the sessile macrobenthic community associated with environmental gradients in Vitória Harbor, Southeastern Brazil. Zoologia (Curitiba), 28(5), 641-652.
Zubikarai, N., Borja, A. and Muxika, I., 2014. Assessment of benthic hard substratum community’s responses to changes in the management of anthropogenic pressures in the Basque coast. Revista de
Investigación Marina,
AZTI-Tecnalia, 21(3), 40-88.