Iranian Journal of Chemical Engineering Vol. 13, No. 1 (Winter 2016), IAChE
An Optimization Study by Response Surface Methodology (RSM)
on Viscosity Reduction of Residue Fuel Oil Exposed Ultrasonic
Waves and Solvent Injection
A. Mohammadi Doust1, M.Rahimi*1, M. Feyzi2
1Department of Chemical Engineering, Faculty of Engineering, Razi University, Kermanshah, Iran 2Department of Physical Chemistry, Faculty of Chemistry, Razi University, Kermanshah, Iran
Received: August 2015 Accepted: October 2015
Abstract
In this study, response surface methodology (RSM) based on central composite design (CCD) was applied for investigation of the effects of ultrasonic waves, temperature and solvent concentration on viscosity reduction of residue fuel oil (RFO). Ultrasonic irradiation was employed at low frequency of 24 kHz and power of 280 W. The results showed that the combination of ultrasonic waves and solvent injection caused viscosity to further reduce. To obtain optimum conditions and significant parameters, the results were analyzed by CCD method. In this method, maximum viscosity reduction (133 cSt) was attained in ultrasonic irradiation for 5 min, temperature of 50°C and acetonitrile volumetric concentration of 5% by means of experimental and three dimensional response surface plots. The kinematic viscosity decreased from 494 cSt to 133 cSt at the optimum conditions. In addition, a multiple variables model was developed by RSM, wherebythe second-order effect of ultrasonic irradiation time was significant on viscosity reduction of FRO. Finally, a comparison between the RSM and artificial neural network (ANN) was applied. The results demonstrated that both models, RSM and ANN, with R2 more than 0.99 were powerful in prediction of kinematic viscosity of RFO.
Keywords: Residue Fuel Oil, Ultrasonic Irradiation, Kinematic Viscosity, Optimization, Response Surface Methodology (RSM)
1. Introduction
Residue fuel oil (RFO) was exited in the bottom of an atmospheric distillation column as the highest concentration of crude oil fraction. The composition of RFO is based on crude oil type and the unit operations in refineries. Residue fractions are made of SARA (saturate, asphaltene, resin, aromatic) compositions. Therefore, the RFOs can be complex compositions. In some countries, to save gas the RFO was used in boilers and furnaces for heat production. It is important to find an appropriate method for reducing viscosity and handling RFO. Reversibility, time-consumption and low quality are the main disadvantages of viscosity reduction of RFOs. The kinematic viscosity is one of the important characteristics that RFOs are classified on [1-4]. Transportation and quality promotion of heavy fuel oils have become a major technical operation. The obstruction often occurs in pipelines by high viscous fluids that require high quality and economical methods to transfer these fluids [5]. Corrosion, equipment failures and downtime of process units are operational problems of RFOs [6]. Many methods have been applied to viscosity reduction and treatment of RFOs which are usually dangerous and costly. These methods are divided into some categories such as Thermal cracking [7-9], Chemical [3,10,11], Electromagnetic heating [4], Acoustical method [12,13] and so on.
Among the above methods, for easy transportation and promotion of quality of RFO, Ultrasonic waves have been introduced as a novel method. Recently, it has been found that the effects of ultrasonic waves in
rejected fuel oil. They used the mixture of methanol-phenol as extractant. Response surface methodology (RSM) and Box-Behnken design (BBD) were employed to investigate and optimize the extraction yield. The aim of this work is to optimize the combination of ultrasonic waves with solvent which was studied in our previous work [31] to find an appropriate kinematic viscosity in the optimum conditions. It is applied for easy transportation and quality enhancement by aid of response surface methodology (RSM). The effects of ultrasonic irradiation, temperature and acetonitrile concentration on fuel oil viscosity have been reported. The important point in an oil process is modeling and optimization to improve a system and increase the efficiency of the process without increasing experiments, cost and time. Furthermore, optimal conditions for producing the maximum viscosity reduction and introduction of a powerful quadratic model were determined using response surface methodology (RSM) based on central composite design (CCD).
2. Experimental
2-1. Experimental setup
Fig.1. depicts experimental setup [31]. In this research, a sample from high kinematic viscosity RFO of Kermanshah Oil Refinery, Iran was provided. The cylindrical beaker with a volume of 300 mL, which contains 100 mL of RFO was used as a container. The top of the beaker was closed and cooling water as a cold bath surrounded it at 16 ± 1°C.
In experiments [31], an ultrasonic apparatus(UP400s,Hielscher Co., Germany) with constant frequency of 24 kHz with power varied in the range of 0-400 W was used. In addition, cycle and amplitude was set and a probe with a diameter of 20 mm and a height of 30 cm was employed in experiments. Based on laboratory results and optimization method, a power of 280 W, cycle of 0.5 and amplitude of 70 percent, were selected. Finally, in order to improve the RFO viscosity reduction, various concentrations of solvent were injected into beaker.
2-2. Materials preparation
The characteristics of RFO sample are shown in Table 1. Acetonitrile (ACT-N) as an
appropriate solvent was used in all experiments. The solvent was supplied from Merck Inc. with a high purity of 99%.
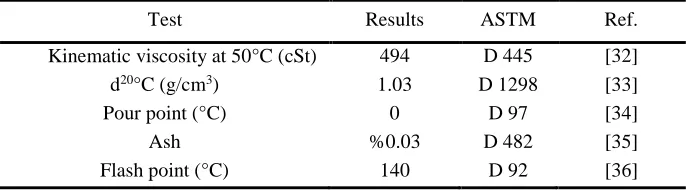
Table 1
The characteristics of RFO sample.
Test Results ASTM Ref.
Kinematic viscosity at 50°C (cSt) 494 D 445 [32]
d20°C (g/cm3) 1.03 D 1298 [33]
Pour point (°C) 0 D 97 [34]
Ash %0.03 D 482 [35]
Flash point (°C) 140 D 92 [36]
2-3. Procedures
In the first step, in order to study the effects of ultrasonic irradiation and solvent on FRO viscosity reduction, 100 ml of RFO according to Table 1 was placed in a 300 mL beaker and heated. The kinematic viscosity without ultrasonic irradiation and solvent was measured at temperatures of 30, 40 and 50°C, respectively. In the second part, a new sample of RFO was radiated with ultrasonic waves without solvent for different times of 5 and 10 min. Once more, the kinematic viscosities of samples were measured at temperatures of 30, 40 and 50°C, respectively. In order to investigate the effect of solvent, three different acetonitrile concentrations of 1, 3 and 5 (v/v% acetonitrile/RFO) were prepared using the same RFO. Solutions were heated and their kinematic viscosities were measured without ultrasonic irradiation at different temperatures. Consequently, other solutions with the same concentrations were ultrasonically irradiated for different times. Finally, the kinematic viscosities of samples with solvent and ultrasonic irradiation were measured at different temperatures. The
Cannon–Fenske Routine viscometer (Cole-Parmer Co., US) in a glycerin bath fixed at specified temperature ± 1°C was used. The kinematic viscosity variation of RFO samples was measured by this viscometer according to ASTM D445 [32] test method. All analyses were employed after one day (Relaxation time=24 h).
recommended. Recently, response surface methodology (RSM) as a combination of mathematical and statistical methods is appropriate for analyzing the effects of independent variables. The RSM is a basic branch of experimental design. It evaluates the relationship between the response(s) and the independent variables, determines the effect of the independent variables, alone or in combination, in the processes [37]. This technique has many advantages such as: cost and time reduction, decreasing the number of tests, studying interaction among variables on response, forecasting of the response(s), determining significance level [37,38].
Central composite design (CCD) and Box-Behnken design (BBD) are important approaches in the RSM which have been reported in literature for many processes [39-51].
In summary, the RSM includes three steps, design of experiment, response surface
modeling and optimization [37]. In the present study, the central composite design (CCD) was employed to determine the effect of each variable and their interactions on the viscosity reduction of RFO. In addition, using this method, an attempt was made to find optimum conditions and the maximum viscosity reduction. The selected variables for this optimization were temperature, solvent concentration and ultrasonic irradiation time. The highest selected temperature for determining kinematic viscosity of RFO is based on ASTM D445. In this standard test method, test should be carried out at 50°C. In addition, temperature of 30°C was selected as the lowest temperature due to high kinematic viscosity at this temperature. Finally, the kinematic viscosity was analyzed at three levels, low (30°C), Medium (40°C) and high (50°C) level. Their range and levels are reported in Table 2.
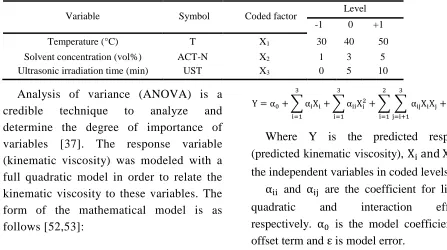
Table 2
Independent variables, their range and levels.
Variable Symbol Coded factor Level
-1 0 +1
Temperature (°C) T X1 30 40 50
Solvent concentration (vol%) ACT-N X2 1 3 5
Ultrasonic irradiation time (min) UST X3 0 5 10
Analysis of variance (ANOVA) is a credible technique to analyze and determine the degree of importance of variables [37]. The response variable (kinematic viscosity) was modeled with a full quadratic model in order to relate the kinematic viscosity to these variables. The form of the mathematical model is as follows [52,53]:
Y = α0+ ∑ αiXi
3
i=1
+ ∑ αiiXi2+ ∑ ∑ αijXiXj
3
j=i+1 2
i=1 3
i=1
+ ε (1)
Where Y is the predicted response (predicted kinematic viscosity), Xi and Xj are
2-5. Performance index
Performance of the developed models in all of the cases was measured statistically by the absolute average deviation (AAD), the average relative deviation (ARD) and coefficient of correlation (R-square) according to the following equations:
𝐴𝐴𝐷 = 1
𝑁 ∑ (
𝑦𝑒𝑥𝑝,𝑖−𝑦𝑚𝑜𝑑𝑒𝑙,𝑖
𝑦𝑒𝑥𝑝,𝑖
)
2 𝑁
𝑖=1
(2)
𝐴𝑅𝐷 = 1
𝑁∑ (
|𝑦𝑒𝑥𝑝,𝑖−𝑦𝑚𝑜𝑑𝑒𝑙,𝑖|
𝑦𝑒𝑥𝑝,𝑖
)
𝑁
𝑖=1
(3)
𝑅 − 𝑠𝑞𝑢𝑎𝑟𝑒
=∑ (𝑦𝑒𝑥𝑝,𝑖− 𝑦𝑚𝑜𝑑𝑒𝑙,𝑚𝑒𝑎𝑛)
2
− ∑𝑁𝑖=1(𝑦𝑒𝑥𝑝,𝑖− 𝑦𝑚𝑜𝑑𝑒𝑙,𝑖) 2 𝑁
𝑖=1
∑𝑁𝑖=1(𝑦𝑚𝑜𝑑𝑒𝑙,𝑚𝑒𝑎𝑛− 𝑦𝑒𝑥𝑝,𝑖)2
(4)
The best results are as follows:
AAD → 0 (5) ARD → 0 (6)
R-square 1 (7)
3. Results and discussion
3-1. Design of experiments (DOE)
In this research, the most important variables; temperature, acetonitrile concentration and ultrasonic irradiation time were selected that could reduce viscosity of RFO. Kinematic viscosity of RFO was chosen as response of experiments. These independent variables were classified into three levels (Table 2). Experimental design was conducted according to CCD method. The coded levels of variables (low, medium and high), experimental design and results are presented in Table 3. All of the experiments were done in triplicate and their averages were considered as a final measurement. Based on Table 3, central composite design (CCD) determined total experimental runs of 18 and number of center points of 3.
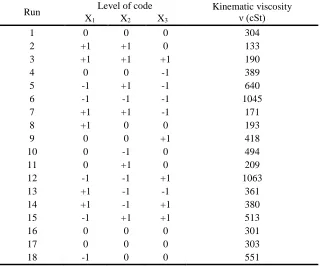
Table 3
Experimental design and results, CCD base.
Run Level of code Kinematic viscosity ν (cSt)
X1 X2 X3 X3
1 0 0 0 304
2 +1 +1 0 133
3 +1 +1 +1 190
4 0 0 -1 389
5 -1 +1 -1 640
6 -1 -1 -1 1045
7 +1 +1 -1 171
8 +1 0 0 193
9 0 0 +1 418
10 0 -1 0 494
11 0 +1 0 209
12 -1 -1 +1 1063
13 +1 -1 -1 361
14 +1 -1 +1 380
15 -1 +1 +1 513
16 0 0 0 301
17 0 0 0 303
3-1-1. Polynomial regression model and analysis of variance (ANOVA)
The experimental results based on CCD model, were developed by polynomial regression model. Eq. (8) shows relation between kinematic viscosity (ν) and independent variables (temperature (X1), solvent
concentration (X2), ultrasonic irradiation time
(X3)). A full quadratic equation was
determined as the best model as follows:
𝜈 = +299.05 − 249.35 X1− 159.65 X2− 4.2 X3
+ 74.82 X1X2+ 18.38 X1X3
− 18.13 X2X3+ 82.54 X12
+ 62.04 X22
+ 102.28 X32 (8)
It covers the important items of interactions between variables which play significant roles in decreasing of error. Based on statistical analysis, the determination coefficient (R2), 0.9886, the adjusted coefficient (R2 adj.), 0.9743, the absolute average deviation (AAD), 0.01398, and the average relative deviation (ARD), 0.08065, were attained. The
target and output data are compared in Fig. 2. A good agreement can be seen between actual and predicted values. In addition, it will be credible for prediction of kinematic viscosity of RFO in different conditions and values as a general model. As shown in Fig. 3, central, axial and factorial points of the model are depicted in cubic dimension. These points were estimated by the model at three levels. To examine the model, analysis of variance was employed. Degree of importance for main, interaction and quadratic effects of variables was found based on P-value. Each variable with the P-value less than 0.01 is considered as highly significant and between 0.01 and 0.05 is significant. Moreover, variable with P-value more than 0.05 is usually introduced as non-significant in statistical analyses. In this methodology, as revealed in Table 4, the very low probability (P-value < 0.0001) with F-value (56.77) indicates that the model is high significant and reliable at 95% confidence level.
Figure 3. Architecture of model outputs in three-dimensional space.
The linear, interaction and quadratic variables (coded), their coefficients and
statistical parameters are shown in Table 5.
Table 4
Analysis of variance (ANOVA) for response surface quadratic model.
Source SS DF MS F P
Model 1.204E+006 9 1.338E+005 56.77 < 0.0001
Residue 18853.72 8 2356.72
Total 1.223E+006 17 71941.176
As mentioned above, it can be recognized that linear effects of X1 and X2
are high significant degree and X3 effect is
not significant. Furthermore, the interaction effect between temperature and solvent concentration (X1X2) reveals a
high significant degree on viscosity reduction of RFO and other interactions do
not have significant effect. The second-order variable of UST (X32) has the most
importance among the other second-order effects, while X12 and X22 were found as
CCD method, it attained a quadratic effect as listed in the last row of Table 5. This
illustrates the importance of employing ultrasound wave for this process.
Table 5
Quadratic regression and importance of variables.
Coded factor Coefficient SS (= MS, DF=1) F P Degree of importance
X1 -249.35 6.601E+005 280.11 < 0.0001 High significant
X2 -159.65 2.706E+005 114.82 < 0.0001 High significant
X3 -4.2 176.4 0.075 0.7913 Non-significant
X1 X2 +74.82 48291.41 20.49 0.0019 High significant
X1 X3 +18.38 2701.13 1.15 0.3156 Non-significant
X2 X3 -18.13 2628.13 1.12 0.3218 Non-significant
X12 +82.54 19181.98 8.14 0.0214 Significant
X22 +62.04 10837.41 4.6 0.0643 Non-significant
X32 +102.28 33505.62 14.22 0.0055 High significant
Finally, as discussed above significant
effects were determined based on P-value,
four terms can be removed and the model
was summarized as the equation below with
a low error:
𝜈 = +299.05 − 249.35 X1− 159.65 X2+ 74.82 X1X2
+ 82.54 X12+ 102.28 X32 (9)
3-1-2. The optimization of kinematic viscosity reduction of RFO
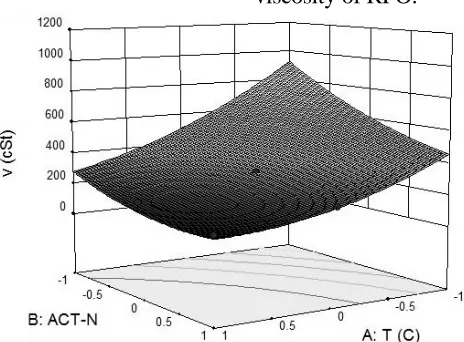
The three dimensional response surface plots were depicted for better understanding of kinematic viscosity reduction of RFO. Three plots were analyzed. Each plot investigates the effect of two variables on viscosity reduction of RFO at medium value of another variable. Fig. 4 shows the simultaneous effect of temperature and solvent concentration on the kinematic viscosity of RFO.
This figure reveals that with increases of temperature and acetonitrile concentration at three levels, kinematic viscosity decreases. The maximum reduction occurs at high level of temperature and solvent concentration. Generally, this figure demonstrates that with increase in solvent concentration the fuel oil viscosity decreases. This could be because of increase in solubility of some hydrocarbons (saturates, asphaltenes, resins, aromatics) by increasing solvent concentrations [19].
Therefore, the influences of temperature and solvent can be significant on viscosity reduction of RFO. Moreover, in this section, temperature of 50°C and solvent volumetric concentration of 5% are determined as optimum values. As shown in Fig. 5, it is clear that with increasing temperature, kinematic viscosity decreases, while ultrasonic irradiation time has a minimum point at medium level.
Figure 5. The effect of temperature and ultrasonic irradiation time on the kinematic viscosity of RFO (ACT-N%=3 (medium)).
In the constant concentration, the increase of ultrasonic irradiation time leads to the increment of viscosity reduction to 5 min and then value gradually increases. Boiling effect may be one reason due to cavitation phenomenon and generated heat, which aid the evaporation of light components [4,19]. The boiling effect was started after 5 min and clearly seen at 10 min. Hence, this leads to the result that ultrasonic irradiation time of 5 min was attained in experimental conditions as an optimum time in viscosity reduction of
RFO. The reduction of fuel oil viscosity before 5 min may be explained by generation of ultrasonic energy, which may cause degradation of hydrocarbons intermolecular bonds and their separation from other particles. On the other hand, growth of RFO viscosity after 5 min can lead to a breakdown of large molecular hydrocarbons such as asphaltene and resin to more tiny cracked particles in the RFO samples [4,19,54,55].
concentration. The fuel oil samples were radiated by ultrasonic irradiation for 0, 5 and 10 min at constant frequency of 24 kHz and power of 280 W. As shown in this figure, increase of solvent concentration reduces the RFO viscosity without ultrasonic irradiation. In addition, decreased viscosity is considerable at UST=5 min than nonirrradiated one. The results reveal that viscosity of fuel oil increased with increase in ultrasonic time by 5 min. Generally, the
figure demonstrates that with increase in solvent concentration, the fuel oil viscosity decreases for all ultrasonic irradiation times based on the above mentioned reasons. As a result, increase in temperature and solvent concentration lead to fuel oil viscosity reduction. However, the ultrasonic waves have positive effect on kinematic viscosity reduction up to 5 min and after that, they have undesirable effect on RFO kinematic viscosity.
Figure 6. The effect of acetonitrile concentration and ultrasonic irradiation time on the kinematic viscosity of RFO (T=40°C (medium)).
The optimum viscosity of RFO (133 cSt) was found at temperature of 50°C, acetonitrile concentration of 5% and ultrasonic irradiation time of 5 min by using the response surface methodology (RSM) and optimization.
3-2. Comparison of RSM with ANN methodology
The performance of the proposed artificial neural network (ANN) for kinematic viscosity prediction of FRO were statistically measured by the absolute average deviation
models. The ANN model has the best performance compared with the RSM. However, although the ANN model reveals more precision the RSM training duration is very transient. In addition, there is no vagueness in the RSM model compared with the ANN approach, because the RSM model presents all of the relationships between linear, interaction and quadratic effects.
Table 6
The performance of RSM and ANN models.
Model Performance indicator
AAD ARD R2
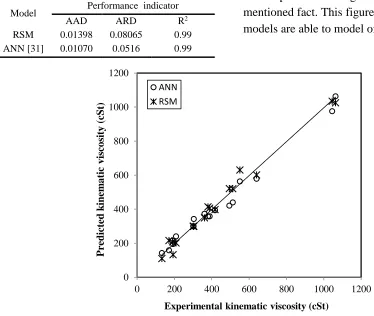
RSM 0.01398 0.08065 0.99
ANN [31] 0.01070 0.0516 0.99
The results demonstrated that the RSM model has a higher error than the ANN. Furthermore, the RSM plays an important role in decreasing experiments, cost and time. It optimized conditions and developed a full quadratic model at optimum conditions. Experimental design of process and determination of important degree of linear, quadratic and interaction effects are also valuable in viscosity reduction of RFO and same processes. Fig. 7 depicts above mentioned fact. This figure illustrates that the models are able to model of measured data.
Figure 7. The RSM and ANN models versus experimental kinematic viscosity of RFO.
4. Conclusions
In this research, influence of ultrasonic irradiation is investigated on RFO kinematic viscosity reduction considering the solvent concentration and temperature by RSM. The results demonstrated that with increasing
temperature and solvent concentration, the kinematic viscosity reduced. In addition, in the range employed optional condition, the optimum ultrasonic irradiation time of 5 min was attained. The results showed that from zero to 5 min ultrasonic irradiation, 0
200 400 600 800 1000 1200
0 200 400 600 800 1000 1200
Predi
ct
ed
k
inem
at
ic
vi
sc
osi
ty
(cSt
)
Experimental kinematic viscosity (cSt)
kinematic viscosity decreased, while it enhanced after this time. The optimum conditions were determined with the aid of the RSM based on central composite design (CCD). The FRO with the best kinematic viscosity, 133 cSt, was found at 50°C, solvent volumetric concentration 5%, and the ultrasonic irradiation time of 5 min which was confirmed by three dimensional response surface plots. Hence, an optimum model of RSM was developed for prediction of kinematic viscosity. In this model, four
terms have been removed because of non-significant effects on viscosity reduction of RFO. The results revealed precision and accuracy of predicted outputs of the RSM (R2=0.99331) and ANN (R2=0.99384)
models. As a result, combining ultrasonic waves and solvent in addition to employing the RSM can be useful in decreasing kinematic viscosity and finding optimum parameters to reach goals with respect to cost, energy, time and safety in oil industries.
Nomenclature
ACT-N Acetonitrile volumetric concentration (vol%)
ASTM American Society for Testing Materials
d20 density at 20°C (g/cm3)
DF Degree of freedom
F F- value
MS Mean of square
P P- value, probability
RFO residue fuel oil
SS Sum of square
T temperature (°C)
UAE United Arab Emirates
UST ultrasonic irradiation time (min)
Greek letter
ν kinematic viscosity (cSt or mm2/s)
Acknowledgments
Authors would like to thank the Research Institute of Petroleum Industry of Kermanshah and Kermanshah Oil Refinery for providing samples and the valuable suggestions of advisors during this work.
References
[2] Perry, R. H. and Green, D. W., Perry’s Chemical Engineers Handbook, McGraw-Hill, New York, (1997).
[3] Gray, M. R., Upgrading of petroleum residue and heavy oil, CRC Press, New York, (1994).
[4] Gunal, O. G. and Islam M. R., "Alteration of asphaltic crude rheology with electromagnetic and ultrasonic irradiation", J. Petrol. Sci. Eng., 26, 263 (2000).
[5] Hasan, S. W. Ghannam, M. T. and Esmail, N., "Heavy crude oil viscosity reduction and rheology for pipeline transportation", Fuel,89, 1095 (2010).
[6] Shalaby, H. M., Refining of Kuwait’s heavy crude oil, material challenges, Kuwait Institute for Scientific Research, Petroleum Research and Studies Center, Kuwait, p. 3 (2005).
[7] David, S. J. and Pujado, P. R., Handbook of Petroleum Processing, Springer, New York, (2006).
[8] Heinemann, H. and Spelght, J. G., The Chemistry and Technology of Petroleum, Taylor and Frances Group, USA, (2006).
[9] Simanzhenkov, V. and Idem, R., Crude oil Chemistry, Marcel Dekker, New York, (2003).
[10] Allen, T. D. and Roberts, A. P., Production Operations: Well Completion, Workover and Stimulation, Oil & Gas Consultants International, Oklahoma, (1982).
[11] Hirscherg, A. Dejong, N. J. Schipper, B. H. and Meijer, J. G., Influence of Temperature and Pressure on Asphaltene Flocculation, Society of Petroleum Engineering of AIME, USA, (1984).
[12] Timothy, J. M. and John, P. L., Applied Sonochemistry: Uses the Power Ultrasound in Chemistry and Processing, Wiley-VCH Verlag Gmbh& Co. KGaA, Germany, (2002).
[13] David, J. and Cheeke, N., Fundamentals and Applications of Ultrasonic Waves, CRC Press, Canada, (2002).
[14] Mironov, M. A. Pirogov, V. A. B. Tumanyan, P. and Chelintsev, S. N., "Acoustic technology for reduction the low-temperature viscosity of petroleum products in pipelines", Chem. Petrol.
Eng.,40, 13 (2004).
[15] Ensumlnger, D. and Stulen, F. B., Ultrasonic’s, Data, Equations and their Practical Uses, Taylor and Francis Group, New York, (2009).
[16] David, J. and Cheeke, N., Fundamentals and Applications of Ultrasonic Waves, CRC Press, Canada, (2002).
[17] Suslick, K. S. Didenko, Y. U. and Fang, M. M., "Acoustic cavitation and its chemical consequences", Philos. Trans.
Royal Soc.,357, 335 (1999).
[18] Suslick, K. S., The Chemical Effect of Ultrasound, Scientific American, USA, (1989).
deposition", J. Petrol. Sci. Eng., 42, 57 (2004).
[20] Bjorndalen, N. and Islam, M. R., "The effect of microwave and ultrasonic irradiation on crude oil during production with a horizontal well", J.
Petrol. Sci. Eng.,43, 139 (2004).
[21] Hong-Xing, X. and Chun-Sheng P., "Experimental study of heavy oil underground aquathermolysis using catalyst and ultrasonic", J. Fuel Chem.
Technol.,39, 606 (2011).
[22] Wang, R. Liu, J. Hu, Y. Zhou, J. and Cen, K., "Ultrasonic sludge disintegration for improving the co- slurrying properties of municipal waste sludge and coal", Fuel Process.
Technol.,125, 94 (2014).
[23] Saikia, B. K. Dutta, A. M. Saikia, L. Ahmed, S. and Baruah, B. P., "Ultrasonic assisted cleaning of high sulphur Indian coals in water and mixed alkali", Fuel Process. Technol., 123, 107 (2014).
[24] Prajapat, A. L. and Gogate, P. R., "Depolymerization of guar gum solution using different approaches based on ultrasound and microwave irradiations", Chem. Eng. Process., 88, 1 (2015).
[25] Ramisetty, K. A. Pandit, A. B. and Gogate, P. R., "Ultrasound assisted preparation of emulsion of coconut oil in water: Understanding the effect of operating parameters and comparison of reactor designs", Chem. Eng. Process.,
88, 70 (2015).
[26] Dasila, P. K. Choudhury, I. R. Saraf, D. N. Kagdiyal, V. Rajagopal, S. and Chopra, S. J., "Estimation of FCC feed composition from routinely measured lab properties through ANN model",
Fuel Process. Technol., 125, 155
(2014).
[27] Vasseghian, Y. Heidari, N. Ahmadi, M. Zahedi, G. and Mohsenipour, A. A., "Simultaneous ash and sulfur removal from bitumen: Experiments and neural network modeling", Fuel Process.
Technol.,125, 79 (2014).
[28] Junior, N. J. Dasilva, A. A. and Marques, M. R. D. C., "Enhanced diesel fuel fraction from waste high-density polyethylene and heavy gas oil pyrolysis using factorial design methodology", Waste Manag., 36, 166 (2015).
[29] Kumar, S. Chary, G. H. V. C. and Dastidar, M. G., "Optimization studies on coal-oil agglomeration using Taguchi (L16) experimental design",
Fuel,141, 9 (2015).
[30] Bendebane, F. Bouziane, L. and Ismail, F., "Extraction of naphthalene, optimization and application to an industrial rejected fuel oil", J. Ind. Eng.
Chem.,16, 314 (2010).
[31] Doust, A. M. Rahimi, M. and Feyzi, M., "Effects of solvent addition and ultrasound waves on viscosity reduction of residue fuel oil", Chem. Eng.
Process., 95, 353 (2015).
Liquids (and Calculation of Dynamic Viscosity), (2012).
[33] Standard Test Method for Density, Relative Density, or API Gravity of Crude Petroleum and Liquid Petroleum Products by Hydrometer Method, (2012).
[34] Standard Test Method for Pour Point of Petroleum Products, (2012).
[35] Standard Test Method for Ash from Petroleum Products, (2012).
[36] Standard Test Method for Flash and Fire Points by Cleveland Open Cup Tester, (2012).
[37] Montgomery, D. C., Design and Analysis of Experiments, 7th ed., John Wiley and Sons, New York, (2008).
[38] Sahan, T. Ceylan, H. Sahiner, N. and Aktas, N., "Optimization of removal conditions of copper ions from aqueous solutions by Trametes versicolor",
Bioresource Technol., 101, 4520
(2010).
[39] Torrades, F. Saiz, S. and Garcia-Hortal, J. A., "Using central composite experimental design to optimize the degradation of black liquor by Fenton reagent", Desalination,268, 97 (2011).
[40] Tsapatsaris, S. and Kotzekidou, P., "Application of central composite design and response surface methodology to the fermentation of olive juice by Lactobacillus plantarum and Debaryomyces hansenii", Int. J.
Food. Microbiol.,95, 157 (2004).
[41] Wang, H. Liu, Y. Wei, S. and Yan, Z., "Application of response surface methodology to optimise supercritical carbon dioxide extraction of essential oil from Cyperus Rotundus Linn", Food
Chem.,132, 582 (2012).
[42] Chen, Y. Zhao, L. Liu, B. and Zuo, S., "Application of response surface methodology to optimize microwave-assisted extraction of polysaccharide from tremella", Phys. Procedia,24, 429 (2012).
[43] Yetilmezsoy, K. Demirel, S. and Vanderbei, R. J., "Response surface modeling of Pb(II) removal from aqueous solution by Pistacia vera L.: Box–Behnken experimental design", J.
Hazard. Mater.,172, 551 (2009).
[44] Va´zquez, G. Calvo, M. Freire, M. S. Gonza´ lez-Alvarez, J. and Antorren, G., "Chestnut shell as heavy metal adsorbent: Optimization study of lead, copper and zinc cations removal", J.
Hazard. Mater.,172, 1402 (2009).
[45] Cornell, J. A., How to Apply Response Surface Methodology, 2nd ed., American Society for Quality Control, Wisconsin, (1990).
[46] Bayraktar, E., "Response surface optimization of the separation of DL-tryptophan using an emulsion liquid membrane", Process Biochem., 37, 169 (2001).
Using Designed Experiments, 2nd ed., John Wiley & Sons, USA, (2002).
[48] Aghaie, E. Pazouki, M. Hosseini, M. R. Ranjbar, M. and Ghavipanjeh, F., "Response surface methodology (RSM) analysis of organic acid production for Kaolin beneficiation by Aspergillus niger". Chem. Eng. J.,147, 245 (2009).
[49] Bahrami, H. Kheradmand, A. Shafiee, M. and Ramazani, S. A., "Preparation of Ultra High Molecular Weight Polyethylene Using ziegler-Natta Catalyst System: Optimization of Parameters by Response Surface Method". Iranian J. Chem. Eng.,11 (1), 55 (2014).
[50] Salamatinia, B. Zinatizadeh, A. A. Kamaruddin, A. H. and Abdullah, A. Z., "Application of Response Surface Methodology for the Optimization of Cu and Zn Removals by Sorption on Pre-treated Oil Palm Frond (OPF)",
Iranian J. Chem. Eng.,3 (2), 73 (2006).
[51] Soleymani, F. Pahlevanzadeh, H. Khani, M. H. and Manteghian, M., "an Biosorption of cobalt (II) by Intact and Chemically Modified Brown Algae:
Optimization Using Response Surface Methodology and an dynamic Equilibrium", Iranian J. Chem. Eng.,11 (2), 56 (2014).
[52] Ozer, A. Gurbuz, G. Calimli, A. and Korbahti, B. K., "Biosorption of copper(II) ions on Enteromorpha prolifera: Application of response surface methodology (RSM) " , Chem.
Eng. J.,146, 377 (2009).
[53] Preetha, B. and Viruthagiri, T., "Application of response surface methodology for the biosorption of copper using Rhizopus arrhizus", J.
Hazard. Mater.,143, 506 (2007).
[54] Leontartits, K. J. and Mansoori, G. A., "Asphaltene Deposition: A survey of field experiences and research approaches", J. Petroleum Sci. Eng., 1, 229 (1988).
[55] Fuse, T. Hirota, Y. Kobayashi, N. Hasatani, M. and Tanaka, Y., "Characteristics of low vapor pressure oil ignition developed with irradiation of mega hertz level ultrasonic", Fuel,
![Figure 1. Schematic view of experimental setup [31].](https://thumb-us.123doks.com/thumbv2/123dok_us/8887007.1823051/3.612.158.454.504.694/figure-schematic-view-experimental-setup.webp)