Turkish Journal of Fisheries and Aquatic Sciences 14: 1-10 (2014)
www.trjfas.org ISSN 1303-2712 DOI: 10.4194/1303-2712-v14_1_01
© Published by Central Fisheries Research Institute (CFRI) Trabzon, Turkey in cooperation with Japan International Cooperation Agency (JICA), Japan
Effects of Dietary Lipid Levels on Growth Performance, Apparent
Digestibility Coefficients of Nutrients, and Blood Characteristics of Juvenile
Crucian Carp (
Carassius auratus gibelio
)
Introduction
Lipid is a component in tissues of fish and shrimps, and general organs contain 1–2% lipid. As a necessary nutrient, lipid is assimilated by fish and shrimps and used for tissue remodeling and new tissue growth (John et al., 2002). Dietary lipid plays a major role in providing a source of concentrated energy, essential fatty acids, phospholipids, sterols, and fat-soluble vitamins, especially for fish, as they may have a limited ability to utilize carbohydrates as an energy source. The effects of dietary lipid levels on growth have been studied in many fish species, such as Senegalese sole (Solea senegalensis) (Morais et al., 2006), darkbarbel catfish (Pelteobagrus vachelli)
(Zheng et al., 2010), meagre (Argyrosomus regius) (Chatzifotis et al., 2010), white seabass (Atractoscion nobilis) (López et al., 2009), cobia (Rachycentron canadum) (Wang et al., 2005), surubim (Pseudoplatystoma coruscans) (Martino et al., 2002), and European sea bass juveniles (Dicentrarchus labrax) (Peres et al., 1999). Digestibility of lipid in fish is high, generally at 80–90%. Dietary
supplemental lipid at appropriate levels can not only improve the palatability and decrease the decomposition of protein for energy, but also can improve the weight growth and feed utilization efficiency. However, studies of the effects of dietary lipid levels on apparent digestibility coefficients and blood biochemical indices in crucian carp are scarce. The few existing studies focused on rainbow trout (Oncorhynchus mykiss) (Torrissen et al., 1990), Atlantic cod (Gadus morhua) (Grisdale-Helland et al., 2008), and tiger puffer (Takifugu rubripe)(Kotaro et al., 2009).
Crucian carp (Carassius auratus gibelio), which is a triploid gynogenetic species, is an important freshwater aquaculture species in China due to its many merits, such as rapid growth, large body size, and strong resistance (Gui, 1996; Yang et al., 1999; Zhou et al., 2000). Understanding the nutritional requirements of crucian carp is crucial to developing cost-effective and nutritionally balanced feed formulations for its culture. Previous studies of the nutrient requirements of crucian carp focused mainly on developing bioenergetics models to estimate feed
Aimin Wang1,*, Guangming Han1, Fu Lv1, Wenping Yang1, Jintian Huang1, Xiaoling Yin1
1
Yancheng Institute of Technology, Key Laboratory for Aquaculture and Ecology of Coastal Pool of Jiangsu Province, Department of Ocean Technology, Yancheng, 224051, China.
* Corresponding Author: Tel.: +86.515 88298357; Fax: +86.515 88298357; E-mail: [email protected]
Received 01 August 2013 Accepted 17 December 2013
Abstract
In this study, the effects of dietary lipid levels on growth, apparent digestibility, and blood biochemical indices of juveniles crucian carp (Carassius auratus gibelio) were evaluated. Triplicate groups of fish (average weight 2.05±0.02 g) were fed four isonitrogenous experimental diets formulated with increasing levels (13.6, 61.3, 115, and 259.8 g kg–1) of lipid. The weight gain (WG), specific growth rate (SGR) was highest in fish fed 115 g kg–1 of lipid, the WG and SGR of 259.8 g kg– 1
lipid group was significantly lower than these of other groups. Second-order regression analysis of WG on levels of dietary lipid indicated that the optimal dietary lipid level for maximum WG was 99.3 g kg–1. The apparent digestibility coefficients of crude protein, lipid, and dry matter tended to increase with increasing level of dietary lipid (P<0.05). With the increased level of dietary lipid, blood glucose, triglycerides, cholesterol and alkaline phosphatase showed a increased trend, the same as total protein and albumin, while globulin showed a decreased trend. The results indicated that the best growth performance of crucian carp juveniles would occur in fish fed a 99.3 g kg–1 lipid diet and that high dietary lipid levels could promote digestion of crude protein, lipid, and dry matter in the nutrient, but may result in liver damage to some degree.
Keywords: Dietary lipid levels, weight gain (WG), nutrients digestibility, blood biochemical indicators, crucian carp
2
requirements, the effects of replacing fish meal with rendered animal protein ingredients, and digestive enzymes (Jany et al., 1976; Zhou et al., 2005; Wang
et al., 2007; Hu et al., 2008; Zhou et al., 2009; Gui et al., 2010; Shao et al., 2010). Pei et al. (2004) reported that the diet containing 14.1% is optimal for its growth; Wang et al. (2008) reported that the optimal lipid demand for fingerling crucian carp (Carassius auratus gibelio) is 4.08~6.04%. So the optimum lipid requirement of crucian carp lipid is not similar at present study. But the influences of dietary lipid on the apparent digestibility coefficients of nutrients and blood characteristics of juvenile crucian carp have not been studied, therefore, the present study was designed to evaluate effects of dietary lipid levels on growth performance, apparent digestibility coefficients and blood characteristics of juvenile crucian carp (Carassius auratus gibelio) reared in freshwater.
Materials and Methods
Experimental Animals
Crucian carp juveniles were supplied by the Yancheng Fisheries fish farm located in Jiangsu Province, China. Fish were reared in a temperature-controlled, recirculating aquaculture system that contained 12 tanks, each with a rounded bottom surface (diameter: 70 cm, water volume: 250 L). Fish were acclimated to laboratory conditions for 20 d before being randomly distributed into the tanks.
Experimental Diets
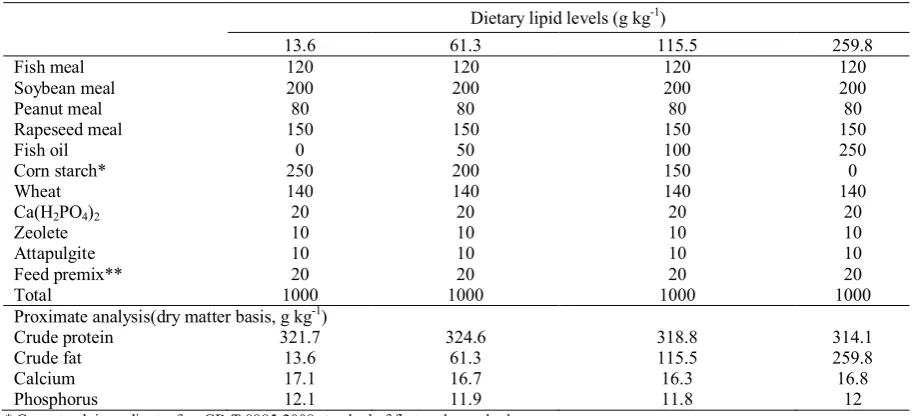
Four isonitrogenous experimental diets (321.0 g
kg–1 crude protein, dry matter) were formulated to contain four lipid levels (13.6 61.3, 115.5, and 259.8 g kg–1 lipid, dry matter). Fish oil was the lipid source, with 0, 50, 100, and 250 g kg–1 fish oil added to the diets, respectively. Chromium oxide was used as an inert marker at a concentration of 5 g kg–1 in the diets. Dietary lipid levels were set according to Wang et al.
(2008). Table 1 lists the ingredients and proximate composition of the experimental diets. Dietary ingredients were ground into fine powder and passed through 260 µm mesh. Micro-components were mixed using the progressive enlargement method. Distilled water and fish oil were added to the premixed dry ingredients and thoroughly mixed with a mixer (SJF-30, Fishery Machinery and Instrument Research Institute, Chinese Academy of Fishery sciences, Shanghai, China). Pellet feeds (1 mm pellet diameter) were made at 70–85°C using an experimental feed pelleter (SLP-80, Fishery Machinery and Instrument Research Institute) and dried for 16 h in a ventilated oven at 60°C. Dry pellets were sealed in plastic bags and stored at –20°C until use.
Experimental Procedure
The experiment was conducted at the Laboratory of Aquatic Nutrition and Feed of Yancheng Institute of Technology, Key Laboratory for Aquaculture and Ecology of Coastal Pool of Jiangsu Province (Yancheng, China). After acclimation, 480 crucian carp juveniles with an average initial body weight of 2.05±0.02 g (mean ± SE) were randomly divided into four groups: one control and three treatment groups. Each of the four groups was divided into triplicate tanks (3 tanks/diet, diameter of tank: 70 cm, water
Table 1. Ingredients and proximate composition of the experimental diets (g kg-1)
Dietary lipid levels (g kg-1)
13.6 61.3 115.5 259.8
Fish meal 120 120 120 120
Soybean meal 200 200 200 200
Peanut meal 80 80 80 80
Rapeseed meal 150 150 150 150
Fish oil 0 50 100 250
Corn starch* 250 200 150 0
Wheat 140 140 140 140
Ca(H2PO4)2 20 20 20 20
Zeolete 10 10 10 10
Attapulgite 10 10 10 10
Feed premix** 20 20 20 20
Total 1000 1000 1000 1000
Proximate analysis(dry matter basis, g kg-1)
Crude protein 321.7 324.6 318.8 314.1
Crude fat 13.6 61.3 115.5 259.8
Calcium 17.1 16.7 16.3 16.8
Phosphorus 12.1 11.9 11.8 12
* Corn starch ingredient refers GB-T 8885-2008 standard of first rank standard;
** The premix provides vitamin and mineral for a kilogram of diet: VE 60 mg; VK 5 mg; VA 15000 IU; VD3 3000 IU; VB1 15 mg; VB2 30
mg; VB6 15 mg; VB12 0.5 mg; Nicotinic acid 175 mg; Folic acid 5 mg; Inositol 1000 mg; Biotin 2.5 mg; Pantothenic acid 50 mg; Fe 25 mg;
3
volume: 250 L) with a density of 40 crucian carp per tank (Wang et al., 2008). Each group was fed its respective trial diet at a feeding amount of about 8.0-10.0% of body weight three times per day (6:30, 12:30, and 18:30). The water source is from underground, and water was exchanged once per week (one-third of the volume was exchanged each time). The water was oxygenated day and night. Water temperature was measured every day, and water quality was measured every week. During the test period the water quality on average was as follows: water temperature 28–32°C, DO > 5 mg L–1, NH3<0.05 mg L–1, H2S<0.1 mg L–1, and pH 6.8–8.0.
At the end of the 60 d test period, fish were fasted for 24 h prior to sampling; at this point three fish from each tank were randomly collected to measure blood characteristics.
Crucian carp juveniles were begun to feed the experimental diets with 5 g kg–1 chromium oxide after reared for 30 d. After 7 d, the feces were collected. Half an hour after each feeding, the rearing tanks were brushed out to remove uneaten feed and fecal residues. Fecal matter was siphoned from each tank three times a day (09:00, 17:00, and 22:30 h), gently rinsed with distilled water, dried on filter paper, and frozen immediately (Merican and Shim, 1995). Daily fecal samples from each tank were pooled together over the course of the experiment until a sufficient sample (approximately 2.0 g fecal dry matter per tank) was obtained for chemical analysis.
Measuring Indices and Methods
During the experiment, initial body weight (IBW) and final body weight (FBW) was measured, and the weight gain (WG), the specific growth rate (SGR), feed conversion ratio (FCR), daily feed intake (DFI), protein efficiency ratio (PER), hepatosomatic index(HSI) and viscerosomatic index(VSI) were calculated using the following formulas:
WG (%) = 100 × (FBW – IBW)/IBW; SGR (%/d) =100× (Inwf-Inwi)/d;
FCR = total feed intake (g)/total wet weight gain of fish (g);
DFI = 100 × total dry feed intake (g)/((IBW + FBW)/2)/feeding days;
PER = body weight gain (g)/protein intake (g); HSI= (liver weight/body weight) ×100; VSI= (viscera weight/body weight) ×100;
wf and wi are final body weight, initial body weight
respectively.
Estimations of apparent digestibility coefficients (ADCs) were based on pooled fecal samples from each replicate for each type of diet collected over 15 d. The samples were analyzed for crude protein (CP), crude lipid, and dry matter in triplicate. ADCs for nutrients of the diets were determined using the following equations:
ADCs of nutrients
(%)
100 – 100×
% Cr2O3 in
feed =
% nutrients in feces % Cr2O3 in
feces
% nutrients in feed
Dry matter, CP, and crude lipid content of the diets and fecal material were determined using standard methods (AOAC, 1996). Dry matter was oven dried at 105°C for 24 h, then crude protein concentration was determined by the Kjeldahl procedure using a Kjeltec Auto Sampler System 1030 Analyzer (Foss Ltd., Sweden). Percent nitrogen was multiplied by 6.25 to obtain an estimate of protein percentage. Crude lipid content was determined by acid hydrolysis with a Soxtex System HT 1047Hydrolyzing Unit (Tecator Application Note 92/87), followed by Soxhlet extraction using a Soxtex system 1043.
At the end of the experiment, 24 h fasting, a venous blood sample with the volume of 0.5 ml was taken from each subject for the measurement of total protein (TP), albumin (ALB), globulin (GLB), and plasma triglyceride (TG), cholesterol (CHOL), alkaline phosphatase (ALP), and glucose (GLU) concentration. The fishes were anesthetized with 0.02% MS-222 (tricaine methanesulphonate, Shang Hai Buxi Chemical Co. Ltd., China) prior to blood drawing, and were prewashed with heparin solution, and tail vein blood was extracted and put into centrifuge tubes that were predried with heparin. The samples then were centrifuged at 3,500 r/min for 15 min to obtain the plasma. TP content of the total blood sample was determined using the Biuret method, and ALB and GLB contents were measured using the Bromocresol green method. TG was measured from the plasma using the glycerol phosphate oxidase-peroxidase method, CHOL was measured using the cholesterol oxidase-peroxidase method (Wang, 2005), and the activity of ALP was measured according to Reit's method and the AMP method (Shimizu, 1982). TP, ALB, GLB, TG, CHOL,
and ALP were measured using the
ABBOTTALOYON 300 automatic biochemical analyzer (USA). Plasma glucose (GLU) concentration was determined using the glucose oxidase method (Panserat et al., 2001).
Statistical Analysis
4
Results
Growth and Feed Utilization
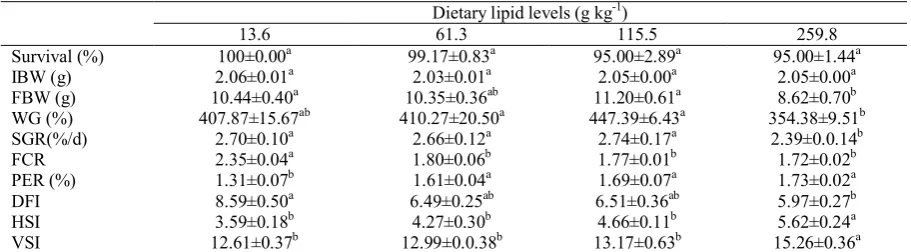
Table 2 shows the growth and feed utilization of
Carassius auratus gibelio juveniles fed the experimental diets for 60 d. Fish survival throughout the growth trial was between 95.0% and 100% and did not differ significantly among treatments. WG for the 115.5 g kg-1 lipid level group was the highest in all groups and it was only significantly higher than that of the 259.8 g kg–1lipid level group (P<0.05). SGR of the 259.8 g kg–1 lipid level group was lower than that of other groups (P>0.05), but there was no significant difference among the 13.6 g kg–1, 61.3 g kg–1 and 115.5 g kg–1 lipid level groups(P>0.05). FCR decreased but the PER increased as the dietary lipid level increased, and FCR and PER differed significantly between the three higher lipid level groups versus the 13.6 g kg-1 lipid level group (P<0.05). The Second order polynomial regression analysis between WG and dietary lipid level was Y = −0.3544X2 + 7.0393X + 401.4 (R2 = 0.8929) (Figure 1), and the optimal dietary lipid level was determined
to be 99.3 g kg–1 for maximum WG. The secondary curve equation between FCR and dietary lipid level was Y = 0.0026X2 − 0.0874X + 2.2971 (R2 = 0.8864) (Figure 2), and the optimal dietary lipid level was determined to be 168.1 g kg–1 for minimum FCR. DFI values were variable (5.97±0.27 to 8.59±0.50), and fingerlings fed the highest gross energy diet (259.8 g kg–1 lipid level) ingested the lowest quantity of feed during the feeding trials (P<0.05).
HSI and VSI of juvenile Carassius auratus gibelio were present in Table 2. The HIS and VSI of 259.8 g kg–1 lipid level group was higher than that of other groups (P<0.05), but there was no significant difference among the 13.6 g kg–1, 61.3 g kg–1 and 115.5 g kg–1 lipid level groups (P>0.05).
Apparent Digestibility Coefficients of Nutrients
ADCs of CP, lipid, and dry matter in the feed increased as the dietary lipid levels increased (Table 3). ADCs of CP, lipid, and dry matter in the 259.8 g kg–1 and 115.5 g kg–1 lipid level groups were significantly higher that those in the 61.3 g kg–1 and 13.6 g kg–1 lipid level groups (P<0.05). ADCs of CP,
Table 2. Survival, growth performance and feed utilization of juvenile C.auratus gibelio fed experiment diets
Dietary lipid levels (g kg-1)
13.6 61.3 115.5 259.8
Survival (%) 100±0.00a 99.17±0.83a 95.00±2.89a 95.00±1.44a IBW (g) 2.06±0.01a 2.03±0.01a 2.05±0.00a 2.05±0.00a FBW (g) 10.44±0.40a 10.35±0.36ab 11.20±0.61a 8.62±0.70b WG (%) 407.87±15.67ab 410.27±20.50a 447.39±6.43a 354.38±9.51b SGR(%/d) 2.70±0.10a 2.66±0.12a 2.74±0.17a 2.39±0.0.14b FCR 2.35±0.04a 1.80±0.06b 1.77±0.01b 1.72±0.02b PER (%) 1.31±0.07b 1.61±0.04a 1.69±0.07a 1.73±0.02a DFI 8.59±0.50a 6.49±0.25ab 6.51±0.36ab 5.97±0.27b HSI 3.59±0.18b 4.27±0.30b 4.66±0.11b 5.62±0.24a VSI 12.61±0.37b 12.99±0.0.38b 13.17±0.63b 15.26±0.36a Values are means of three replicates ± SE. Means within rows with the same letter are not significantly different (P<0.05)
5
lipid, and dry matter did not differ significantly between the two highest lipid level groups, but ADCs of lipid and dry matter were significantly higher in the 61.3 g kg–1 lipid level group compared with the 13.6 g kg–1 lipid level group (P<0.05).
Blood Biochemical Indices
Figure 3 presents the TP, ALB, GLB, ALB\GLB, TG, CHOL, ALP, and GLU content in the plasma of juvenile C. auratus gibelio. The levels of TP, ALB, and ALB\GLB increased as the dietary lipid levels increased, but the GLB content decreased. The ALB and ALB\GLB levels of the of 259.8 g kg–1 lipid level group were significantly higher than those of the13.6 g kg–1 and 61.3 g kg–1 lipid level groups (P<0.05). However, the GLB content of the 259.8 g kg–1 lipid level group was significantly lower than that of the 13.6 g kg–1 and 61.3 g kg–1 lipid level groups (P<0.05).
TG content did not differ significantly among the four groups (P>0.05). As the dietary lipid levels increased, the TG, CHOL, and ALP content in the plasma of juvenile C. auratus gibelio tended to increase. The TG level of the 259.8 g kg–1 lipid level group was significantly higher than that of the other groups (P<0.05). The CHOL content of the 259.8 g kg–1 lipid level group was significantly higher than that of the 61.3 g kg–1 and 115.5 g kg–1 lipid level groups (P<0.05), but there was no significant difference in CHOL content between the 259.8 g kg–1 and 13.6 g kg–1 lipid level groups (P>0.05). In addition, the GLU content tended to increase as a whole as the dietary lipid levels increased. The GLU content of the 259.8 g kg–1 level group was significantly higher than that of the 61.3 g kg–1 lipid level group (P<0.05) but it did not differ significantly from the content of the others groups (P>0.05).
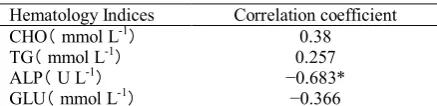
Table 4 shows the correlation coefficients between TG, CHO, ALP, GLU, and WG . WG was found to be negatively correlated with ALP (r2=
-0.683) and GLU (r2 = –0.366) and positively correlated with TG (r2 = 0.257) and CHOL (r2 = 0.380). However, the correlation coefficients between WG and TG, CHOL, and GLU were not significant (P>0.05), but that of ALP was significant (P<0.05).
Discussion
Impacts of dietary lipid levels on HSI and VSI of juvenile Carassius auratus gibelio had been studied in this study, the results showed that high dietary lipid levels (259.8 g kg–1) might lead to damage for the liver of juvenile Carassius auratus gibelio. Our previous research had showed that high dietary lipid level (16.55% lipid) could result in hepatomgaly and pewter in liver color of juvenile GIFT Oreochromis niloticus (Han et al., 2011).
In this study, with increased dietary lipid levels, there was a trend to first increase then decrease, the WG and SGR of the 115.5 g kg-1 was highest, but WG and SGR of the 259.8 g kg-1 were significantly lower than these of other groups (P<0.05). The results showed that a dietary lipid level of 99.3 g kg–1 was determined to be optimal for growth performance and feed utilization of juvenile Carassius auratus gibelio
reared in fresh water. In other studies of other fish species, the optimal dietary lipid level was higher. For example, Xu et al. (2011) found that a 122 g kg–1 dietary lipid level was optimal for growth of juvenile Japanese seabass (Latelabrax japonicus). Kotaro et al.
(2009) reported the optimum dietary lipid level for tiger puffer to be < 110 g kg–1, and Molna´r et al.
(2006) found a 120 g kg–1 dietary lipid level to be optimal for growth of pike perch (Sander iucioperca
L.). The optimal dietary lipid requirement for fish is influenced by factors such as fish species, growth stage, dietary lipid source, and ambient temperature (Borlongan, 1992; Molna´r et al., 2006; Kotaro et al., 2009; Xu et al., 2011). Our previous study showed that the optimal dietary lipid level for juvenile C. auratus gibelio was 40.8–60.4 g kg–1 (Wang et al.,
y = 0.00003x2 - 0.0093x + 2.4111
R2 = 0.8864
0 0.5 1 1.5 2 2.5 3
0 100 200 300
F
C
R
/
%
Lipid level /g kg-1
6
Table 3. Apparent digestibility coefficients (mean ± S E) for crude protein, lipid and dry matter in juvenile crucian carp (%) n=3
Dietary lipid levels (g kg-1)
13.6 61.3 115.5 259.8
Crude protein 78.15±1.40b 79.28±0.05b 84.31±1.42a 84.38±0.19a Lipid 68.73±2.28c 73.63±0.99b 88.38±0.23a 91.72±0.07a Dry matter 54.79±0.15c 56.89±0.77b 59.98±0.40a 61.12±0.11a Values are means of three replicates ± SE. Means within rows with the same letter are not significantly different (P<0.05)
a a a a
0 10 20 30 40
13.6 61.3 115.5 259.8
TP(
g
/L
) a a
ab b
0 5 10 15 20
13.6 61.3 115.5 259.8
GLB
(g/
L)
c
b ab a
0 5 10 15 20 25 30
13.6 61.3 115.5 259.8
-1
AL
B
(
g/
L
)
b b
ab a
0 5 10 15 20
13.6 61.3 115.5 259.8
-1
AL
B
/
GL
B
b b b
a
0 2 4 6 8 10
13.6 61.3 115.5 259.8
TG
(
mm
o
l
/L)
ab b
b a
0 2 4 6 8 10
13.6 61.3 115.5 259.8
-1
CH
OL
(mm
ol/
L)
b a
ab ab
0 5 10 15 20 25 30
13.6 61.3 115.5 259.8
Lipid level(g kg-1)
AL
P(
U/L
) ab
b
ab a
0 5 10 15 20
13.6 61.3 115.5 259.8
Lipid level(g kg-1)
GL
U(
mm
ol/L
)
Figure 3. Effects of dietary lipid level on plasma biochemical indices of juvenile Carassius auratus gibelio
TP (
g
/L
)
ALB
(
g/
L)
G
LB
(g/
L)
ALB
/GLB
T
G (
mmol
/L)
CHO
L
(mmol
/L
)
ALP (U
/L)
GLU (
mm
o
l/
7
2008). The difference in results for C. auratus gibelio
may be due to the different body weight of juveniles used in the two experiments: The former was 17.00±0.15 g, but the average body weight was 2.05±0.02 g in the current study at the start of the experiment. This result further illustrates that the optimal dietary lipid requirement for fish is related to growth stage.
Our results also showed that higher dietary lipid levels could inhibit the growth of juvenile C. auratus gibelio. Negative effects of high lipid levels on growth performance also have been reported for the tiger puffer (Kotaro et al., 2009), cobia (Wang et al.
2005), red drum (Ellis and Reich, 1991), halibut (Nortvedt and Tuene, 1998), and Japanese seabass (Xu et al., 2011). A growth depression effect of higher dietary lipid may be due to reduced feed intake by fish (Tocher, 2003). The present study also showed that DFI of fish fed 259.8 g kg–1 lipid diet was significantly lower than those fed lower lipid diets, which further supported this assumption. In addition, the ALP, TG, and CHOL values of fish fed the 259.8 g kg–1 lipid level diet were indicative of liver injury to a certain extent, which may be one explanation for decreased growth.
Survival rates of juvenile C. auratus gibelio in this experiment ranged from 95% to 100%, but there was no significant difference among the four groups. Thus, the dietary lipid levels tested in this study (< 259.8 g kg–1) did not have a significant effect on the survival rate of juvenile C. auratus gibelio. In contrast, Ai et al. (2008) reported that higher dietary lipid resulted in lower survival. In this study, with increasing dietary lipid levels, the PER tended to increase, which showed that high dietary level could improve the utilization of protein in feed. Improvement of growth and PER with increasing dietary lipid (energy) level at constant dietary protein level also was found for rainbow trout (Takeuchi et al., 1978; Beamish and Medland, 1986) and white seabass (López et al., 2009). Replacing dietary protein with lipid also improved the growth and PER of Atlantic salmon (Salmo salar) when the diets were administered isonitrogenously (Hillestad and Johnsen, 1994).
Digestibility of a feed is an important factor to consider when evaluating the utilization of feed (Akiyama et al., 1989). Digestibility data reflect the percentage of a feed sample that is absorbed from an animal's intestinal tract. In the present study, ADCs of
crude protein, lipid, and dry matter tended to increase as the dietary lipid levels increased. The results suggest that a high dietary lipid level can promote the digestion of nutrients in juvenile C. auratus gibelio
but that the apparent digestibility does not increase significantly once the dietary lipid content reaches a certain level. Similar results were reported for GIFT tilapia Oreochromis niloticus (Wang et al., 2011), rainbow trout (Torrissen et al., 1990), and Atlantic cod (Grisdale-Helland et al., 2008). A possible reason for the increase in ADC with increased dietary level is a follows: On the one hand, the lipid provides enough energy for the fish, thereby decreasing the protein consumption and increasing the feed digestibility; on the other hand, lipids, as solvents in the fish body, promote the absorption of other nutrients, thereby improving the apparent digestibility of the feed. However, once a certain dietary lipid level is reached, these tendency stops, likely because when the fat content reaches a certain level, the digestive rate has no significant difference although it increased. This may be because when the fat content reaches a certain level, excess fat is deposited in the liver. A fatty liver becomes overburdened, and thus the apparent digestibility, has no significant increase, but the specific mechanism needs further research.
Blood biochemical characteristics are affected by the internal and external environment, thus they can indirectly reflect the metabolic health status of fish and be used as a clue to determine if fish are sick, what type of illness they have, and how severe the illness is (Chen et al., 2008; Wang et al., 2011). No comparable data are available about the effect of dietary lipid levels on the blood characteristics of juvenile C. auratus gibelio,and there are only limited reports for other finfish species (Kotaro et al., 2009; Chatzifotis et al., 2010; Wang et al., 2011).
The maintenance of plasma colloid osmotic pressure mainly depends on ALB, which is synthesized by the liver (Quinlan, 2005). GLB is related to immunity and is mainly synthesized by extra cell. ALB content will rise and GLB content will drop when the liver is abnormal or the body contains a virus antigen. In this study, the TP and ALP content tended to increase and the GLB level tended to decrease as the dietary lipid levels increased, there was significant difference between the ALB and GLB content of the highest lipid level group and the two lowest lipid level groups (P<0.05). This result suggests that the liver of juvenile C. auratus gibelio in the highest dietary lipid level group might be injured.
Blood lipid is a compulsory material of living cell basal metabolism. Generally speaking, the main parts of lipid are TG and CHOL. Under normal circumstances, CHOL usually increases or decreases with increasing or decreasing of TG, respectively (He, 2000). The content of TG and CHOL often are low in fish (Chen, 2000). Kotaro et al. (2009) found that the blood TG content in tiger puffer increased as the Table 4. Correlation coefficient between hematology
indices and weight gain
Hematology Indices Correlation coefficient CHO(mmol L-1) 0.38 TG(mmol L-1) 0.257 ALP(U L-1) −0.683* GLU(mmol L-1) −0.366
8
dietary lipid levels increased. Wang et al. (2011) reported that the CHOL content of GIFT tilapia serum increased significantly (P<0.01) with increasing dietary lipid level, but it had no significant influence on the TG content (P>0.05). The experimental results reported herein showed that the TG and CHOL levels increased significantly with increasing dietary lipid level, which agrees with reports for tiger puffer (Kotaro et al., 2009), grass carp (Du et al., 2005), and Atlantic salmon (Hamre et al., 2004). It is possible that TG synthesized by the liver cannot be transported in time and cause fatty liver, while the formation of fatty liver is often accompanied by increasing of blood lipid.
In this study, WG was positively correlated with TG and CHOL and negatively correlated with GLU and ALP, but only the correlation with ALP was statistically significant (P<0.05). In contrast, Chatzifotis et al. (2010) reported that CHOL, TG, and TP levels in meagre blood were not affected by the different diets. Wang et al. (2011) found that with the increase in dietary lipid, the content of TG and CHOL declined significantly (P<0.05). Gan et al. (2009) found that the diet lipid level was negatively correlated with and CHOL and TG levels, and the reasons for this relationship remain to be determined.
The plasma ALP level is related to nutrition immunity. Under normal circumstances, the ALP activity of the plasma is low, but liver or bone disease cause the ALP activity to increase significantly. Gan
et al. (2009) found that increased dietary lipid levels led to a gradual increase in the activity of GPT and ALP. In the experiment conducted herein, the ALP level increased gradually as the dietary lipid levels increased; one explanation for this result is that too much lipid in the diet caused liver disease.
GLU levels can be used as an indicator of stress (Rotllant and Tort, 1997; Rotllant et al., 1997; Pottinger, 1998), but they also are affected by other factors, including temperature, fish size (Hemre and Sandnes, 1999), photoperiod, time since last feeding (Pavlidis et al., 1999), and diet. In this study, GLU levels in the blood of juvenile C. auratus gibelio
increased with increasing dietary lipid levels expect but the 13.6 g kg-1 lipid, indicated that the increase of dietary lipid cause stress represented by glucose levels, which was supported by other reports for Atlantic salmon (Hemre and Sandnes, 1999), cod (Rosenlund et al., 2004), and white sturgeon (Acipenser transmontanus) (Hung et al., 1997). The reason that the GLU content of the of 13.6 g kg–1 lipid level group was higher than that of the 61.3 g kg–1 lipid level group may be because of the corn starch present in the 13.6 g kg–1 diet. Hemre et al. (1996) reported that the GLU content increases with the increase of starch in the diet.
Correlation analysis of WG versus blood biochemical indices revealed that ALP level was significantly negatively related to WG (P<0.05), GLU significantly negatively related to WG (P<0.01);
Correlation between all other blood biochemical indices and WG was not significant (P>0.05). Overall, the results indicate that excessive dietary lipid can lead to liver damage, which in turn will affect indices such as ALP. Liver damage also can emaciate the body and cause growth retardation and metabolic disorders. Therefore, the potential relationship between blood biochemical indices and growth performance may provide a way to comprehensively assess fish health status and nutritional requirements.
Conclusions
In summary, the results of the present study demonstrated that a dietary lipid level of 99.3 g kg–1 will result in optimal growth of C. auratus gibelio
juveniles. A dietary lipid level that is too high (e.g., 259.8 g kg–1) can have negative effects on growth. High dietary lipid levels can promote digestion of CP, lipid, and dry matter in the food source, but too high level of 259.8 g kg-1 lipid maybe result in liver damage in this species to some degree.
Acknowledgements
This work was funded by “Three Projects” on aquaculture of Jiangsu Province (No. PJ2010-59), Jiangsu Province Coastal Aquaculture Fish Feed
Engineering Technology Research Center
(BM2012520) and was supported by funding from the “333 High-level Personnel Training Project” in Jiangsu province.
References
Ai, Q.H., Zhao, J.Z., Mai, K.S., Xu, W., Tan, B.P., Ma, H.M. and Liufu, Z.G. 2008. Optimal dietary lipid levels for large yellow croaker (Pseudosciaema
crocea) larvae. Aquaculture Nutrition, 14: 515-522.
Akiyama, D.M., Coelho, S.R., Lawrence, A.L. and Robison, F.H. 1989. apparent digetibility of feedstuffs by the marine shrimp Penaeus vannamei Boone. Nippon Suisan Gakkaishi, 55: 91-98.
AOAC. 1996. Official methods of analysis of the association of official analytical chemists. Association of Official Analytical Chemists, Arlington, VA, USA. Beamish, F.W.H. and Medland, T.E. 1986. Protein sparing
effects in large rainbow trout, Salmo gairdneri. Aquaculture, 55: 35-42.
Borlongan, I.G. 1992. Lipid and fatty acid composition of milkfish (Chanos chanos) grown in fresh water and seawater. Aquaculture, 140: 79-89.
Chatzifotis, S., Panagiotidou, M., Papaioannou, N., Pavlidis, M., Nengas, I. and Mylonas, C.C. 2010. Effect of dietary lipid levels on growth, feed utilization, body composition and serum metabolites of meagre
(Argyrosomus regius) juveniles. Aquaculture, 307:
65-70.
Chen, X.P. 2008. Effects of starvation on some hematological indices of Sparus macroephalus. Fisheries Science and Technology, 4: 19-25. (In Chinese, with English abstract).
9
Teachers College, 19. (In Chinese, with English abstract).
Du, Z.Y., Liu, Y.J., Tian, L.X., Wang, J.T., Wang, Y. and Liang, G.Y. 2005. Effect of dietary lipid level on growth, feed utilization and body composition by juvenile grass carp (Ctenopharyngodon idella). Aquaculture Nutrition, 11: 139–146.
Ellis, S.C. and Reich, R.C. 1991. Effects of dietary lipid and carbohydrate level on growth and body composition of juvenile red drum (Scienops ocellatus). Aquaculture, 97: 383-394.
Gan, H., Li, J.M., Feng, G.P., Gong, Z.L., Huang, K. and Li, J.L. 2009. Effects of different lipid levels on growth and haematological biochemistry in juvenile tilapia (Oreochromis niloticus × Oreochromis
aureus). Journal of Shanghai Ocean University, 18:
36-41. (In Chinese, with English abstract).
Grisdale-Helland, B., Shearer, K.D., Gatlin III, D.M. and Helland, S.J. 2008. Effects of dietary protein and lipid levels on growth, protein digestibility, feed utilization and body composition of Atlantic cod (Gadus
morhua). Aquaculture, 283: 156-162.
Gui, D., Liu, W.B., Shao, X.P. and Xu, W.N. 2010. Effects of different dietary levels of cottonseed meal protein hydrolysate on growth, digestibility, body composition and serum biochemical indices in crucian carp (Carassius auratus gibelio). Animal Feed Science and Technology, 156: 112-120.
Gui, J.F. 1996. A unique study system: gynogenetic fish
Carassius auratus gibelio. Sci. Found. China, 4:
44-46.
Hamre, K., Christiansen, R., Waagbø, R., Maage, A., Torstensen, B.E., Lygren, B., Lie Ø Wathne, E. and Albrektsen, S. 2004. Antioxidant vitamins, minerals and lipid levels in diets for Atlantic salmon (Salmo
salar, L.): effects on growth performance and fillet
quality. Aquaculture Nutrition, 10: 113-123.
Han, G. M., Wang, A.M., Xu, P., Lv F., Feng, G.N., YU, Y.B. and Yang, W.P. (2011) Effects of dietary lipid levels on fat deposition and fatty acid profiles of GIFT, Oreochromis niloticus. Journal of Fishery Sciences of China, 18: 338-349. (In Chinese with English abstract)
He, Z.Q. 2000. Human nutrition (second edition). Beijing: People's Medical Publishing House, 95-123. (In Chinese, with English abstract).
Hemre, G.I., Hjertnes, B., Aksnes, A. and Waagbø, R. 1996. Effect of gelatinized wheat and maize in diets for large Atlantic salmon (Salmo salar L.) on glycogen retention, plasma glucose, and fish health. Aquaculture Nutrition, 2: 33-39.
Hemre, G.I. and Sandnes, K. 1999. Effect of dietary lipid level on muscle composition in Atlantic salmon Salmo
salar. Aquaculture Nutrition, 5, 9-16.
Hillestad, M. and Johnsen, F. 1994. High-energy/low-protein diets for Atlantic salmon: effects on growth, nutrient retention and slaughter quality. Aquaculture, 124: 109-116.
Hu, M.H., Wang, Y.J., Wang, Q., Zhao, M., Xiong, B.X., Qian, X.Q., Zhao, Y.J. and Luo, Z. 2008. Replacement of fish meal by rendered animal protein ingredients with lysine and methionine supplementation to practical diets for gibel carp,
Carassius auratus gibelio. Aquaculture, 275:
260-265.
Hung, S.S.O., Storebakken, T., Cui, Y., Tian, L. and Einen, O. 1997. High-energy diets for white sturgeon,
Acipenser transmontanus Richardson. Aquaculture Nutrition, 3: 281-286. doi: 10.1046/j.1365-2095.1997.00047.x
Jany, K.D. 1976. Studies on the digestive enzymes of the stomachless bonefish Carassius auratus gibelio (bloch): Endopeptidases. Comp. Biochem. Phys. B: Comp. Biochem., 53: 31-38.
John, R., Douglas, R.J. and Gordon, B. 2002. Fish Nutrition. Copyright: Elsevier Science, USA, 181-258.
Kotaro, K., Takeshi, F., Nakahiro, I., Kazue, O. and Tamo, N. 2009. Effect of dietary lipid levels on the growth, feed utilization, body composition and blood characteristics of tiger puffer Takifugu rubripes. Aquaculture, 298: 111-117.
doi: 10.1016/j.aquaculture.2009.10.026
López, L.M, Durazo, E., Viana, M.T., Drawbridge, M. and Bureau, D.P. 2009. Effect of dietary lipid levels on performance, body composition and fatty acid profile of juvenile white seabass, Atractoscion nobilis. Aquaculture, 289: 101-105. doi: 10.1016/j.aquaculture.2009.01.003
Martino, R.C., Cyrino, J.E.P., Portz, L. and Trugo, L.C. 2002. Effect of dietary lipid level on nutritional performance of the surubim, Pseudoplatystoma
coruscans. Aquaculture, 209: 209-218.
doi: 10.1016/S0044-8486(01)00738-4
Merican, Z.O. and Shim, K.F. 1995. Apparent digestibility of lipid and fatty acids in residual lipids of meals by adult Penaeus monodon. Aquaculture, 133: 275-286. doi: 10.1016/0044-8486(95)00019-X
Molna´r, T., Szabo´, A., Szabo´, G., Szabo´, C. and Hancz, C. 2006. Effect of different dietary fat content and fat type on the growth and body composition of intensively reared pikeperch (Sander lucioperca L.). Aquaculture Nutrition, 12: 173-182. doi: 10.1111/j.1365-2095.2006.00398.x
Morais, S., Caballero, M.J., Conceição, L.E.C., Izquierdo, M.S. and Dinis, M.T. 2006. Dietary neutral lipid level and source in Senegalese sole (Solea senegalensis) larvae: Effect on growth, lipid metabolism and digestive capacity. Comp. Biochem. Phys. B: Biochem. Mol. Biol., 144: 57-69.
doi: 10.1016/j.cbpb.2006.01.015
Nortvedt, R. and Tuene, S. 1998. Body composition and sensory assessment of three weight groups of Atlantic halibut (Hipoglossus hippoglossus) fed three pellet sizes and three dietary fat levels. Aquaculture, 161: 295-312. doi: 10.1016/S0044-8486(97)00277-9 Panserat, S., Capilla, E., Gutierrez, J., Frappart, P.O.,
Vachot, C., Plagnes-Juan, E., Aguirre, P., Br`eque, J. and Kaushik, S. 2001. Glucokinase is highly induced and glucose-6-phosphatase poorly repressed in liver of rainbow trout (Oncorhynchus mykiss) by a single meal with glucose. Comp. Biochem. Phys. B, 128: 275-283. doi: 10.1016/S1096-4959(00)00322-5 Pavlidis, M., Greenwood, L., Paalavuo, M., Mölsä, H., and
Laitinen, J.T. 1999. The Effect of Photoperiod on Diel rhythms in serum melatonin, cortisol, glucose, and electrolytes in the Common Dentex, Dentex dentex. General and Comparative Endocrinology, 113: 240-250. doi: 10.1006/gcen.1998.7190
Pei,Z., Xie, S., Lei, W., Zhu, X., and Yang, Y. 2004. Comparative study on the effect of dietary level on growth and feed utilization for gibel carp (Carassius
auratus gibelio) and Chinese longsnout catfish
10
Nutrition, 10: 209-216. doi: 10.1111/j.1365-2095.2004.00291.x
Peres, H. and Oliva-Teles, A. 1999. Effect of dietary lipid level on growth performance and feed utilization by European sea bass juveniles (Dicentrarchus labrax). Aquaculture, 179: 325-334. doi: 10.1016/S0044-8486(99)00168-4
Pottinger, T.G. 1998. Changes in blood cortisol, glucose and lactate in carp retained in anglers' keepnets. Journal of Fish Biology, 53: 728-742.
Quinlan, G.J., Martin, G.S. and Evans, T.W. 2005.Albumin: biochemical properties and therapeutic potential. Hepatology, 41:1211-1219. doi: 10.1002/hep.20720 Rosenlund, G., Karlsen, Ø., Tveit, K., Mangor-Jensen, A.
and Hemre, G.I. 2004. Effect of feed composition and feeding frequency on growth, feed utilization and nutrient retention in juvenile Atlantic cod, Gadus
morhua L. Aquaculture Nutrition, 10: 371-378.
doi: 10.1111/j.1365-2095.2004.00312.x
Rotllant, J., Pavlidis, M., Kentouri, M., Adad, M.E. and Tort, L. 1997. Non-specific immune responses in the red porgy, Pagrus pagrus, after crowding stress. Aquaculture, 156: 279-290. doi: 10.1016/S0044-8486(97)00075-6
Rotllant, J. and Tort, L. 1997. Cortisol and glucose responses after acute stress by net handling in the sparid red porgy previously subjected to crowding stress. Journal of Fish Biology, 51: 21-28. doi: 10.1111/j.1095-8649.1997.tb02510.x
Shao, X.P., Liu, W.B., Xu, W.N., Lu, K.L., Xia, W. and Jiang, Y.Y. 2010. Effects of dietary copper sources and levels on performance, copper status, plasma antioxidant activities and relative copper bioavailability in Carassius auratus gibelio. Aquaculture, 308: 60-65.
doi: 10.1016/j.aquaculture.2010.07.021
Shimizu, D. 1982. The principle and application of enzyme-analysis. Shanghai Science and Technology Press, Shanghai: 113-114.
Takeuchi, T., Yokoyama, M., Watanabe, T. and Ogino, C. 1978. Optimum ratio of dietary energy to protein for rainbow trout. Bull. Jpn. Soc. Sci. Fish., 44: 729-732. doi: 10.2331/suisan.44.729
Torrissen, O.J., Hardy, R.W., Shearer, K.D., Scott, T.M. and Stone, F.E. 1990. Effects of dietary canthaxanthin level and lipid level on apparent digestibility coefficients for canthaxanthin in rainbow trout
(Oncorhynchus mykiss). Aquaculture, 88: 351-362.
doi: 10.1016/0044-8486(90)90160-O
Tocher, D.R. 2003. Metabolism and functions of lipids and fatty acids in teseost fish. Reviews in Fisheries Science, 11: 107-184. doi: 10.1080/713610925 Wang, A.M., Han, G.M., Fenng, G.N., Yang, W.P., Guo,
J.H., Wang, T. and Xu, P. 2011. Effects of dietary lipid levels on growth performance, nutrient digestibility and blood biochemical indices of GIFT
tilapia (Oreochromis niloticus). Acta Hydrobiologica Sinica, 35(1): 80-87 (In Chinese, with English abstract). doi: 10.3724/SP.J.1035.2011.00080 Wang, A.M., Xu, P., Li, P., Li, J., Huang, J.T. and Shao, R.
2008. Study on the optimal lipid content of feed for
Carassius auratus gibelio. Journal of Shanghai Ocean
University, 17: 661-667. (In Chinese, with English abstract).
Wang, J.T., Liu, Y.J., Tian, L.X., Mai, K.S., Du, Z.Y., Wang, Y. and Yang, H.J. 2005. Effect of dietary lipid level on growth performance, lipid deposition, hepatic lipogenesis in juvenile cobia (Rachycentron
canadum). Aquaculture, 249: 439-447.
doi: 10.1016/j.aquaculture.2005.04.038
Wang, Y.B., Han, J.Z., Li, W.F. and Xu, Z.R. 2007. Effect of different selenium source on growth performances, glutathione peroxidase activities, muscle composition and selenium concentration of allogynogenetic crucian carp (Carassius auratus gibelio). Animal Feed Science and Technology, 134: 243-251.
doi: 10.1016/j.anifeedsci.2006.12.007
Xu, J.H., Qin, J., Yan, B.L., Zhu, M. and Luo, G. 2011. Effects of dietary lipid levels on growth performance, feed utilization and fatty acid composition of juvenile Japanese seabass (Lateolabrax japonicus). Aquaculture International, 19: 79-89.
doi: 10.1007/s10499-010-9342-7
Yang, Z.A., Li, Q.H., Wang, Y.F. and Gui, J.F. 1999. Comparative investigation on spindle behavior and MPF activity changes during oocyte maturation between gynogenetic and amphimictic crucian carp. Cell Research, 9: 145-154. doi: 10.1038/sj.cr.7290012 Zheng, K.K., Zhu, X.M., Han, D., Yang, Y.X., Lei, W. and
Xie, S.Q. 2010. Effects of dietary lipid levels on growth, survival and lipid metabolism during early ontogeny of Pelteobagrus vachelli larvae. Aquaculture, 299(1-4): 121-127.
doi: 10.1016/j.aquaculture.2009.11.028
Zhou, L., Wang, Y. and Gui, J.F. 2000. Genetic evidence for gonochoristic reproduction in gynogenetic silver crucian carp (Carassius auratus gibelio) as revealed by RAPD assays. Journal of Molecular Evolution, 51: 498-506.
Zhou, X.X., Wang, Y.B., Gu, Q. and Li, W.F. 2009. Effects of different dietary selenium sources (selenium nanoparticle and selenomethionine) on growth performance, muscle composition and glutathione peroxidase enzyme activity of crucian carp (Carassius
auratus gibelio). Aquaculture, 291, 78-81.
doi: 10.1016/j.aquaculture.2009:03.007
Zhou, Z.G., Xie, S.Q., Lei, W., Zhu, X.M. and Yang, Y.X. 2005. A bioenergetic model to estimate feed requirement of gibel carp, Carassius auratus gibelio. Aquaculture, 248: 287-297.