Detection and tracking of pigs in natural environments based on video
analysis
Deqin Xiao
*, Aijing Feng, Jian Liu
(Department of Computer Science and Technology, South China Agricultural University, Guangzhou 510642, China)
Abstract: Detection and tracking of pigs are important for analyzing pig behavior using computer vision. However, in natural environments, illumination changes, complex scenes, adhesion, occlusion, and individual identification from multiple objects are challenges for detection and tracking. This paper provided an anti-interference algorithm for pig detection and tracking based on video analysis. Firstly, pigs were recognized in natural environment based on color information, and noises were removed based on the analysis of connected regions in the binary images. Secondly, multiple pigs were separated by contours and edges. Thirdly, pigs were tracked based on a set of association rules with constraint items (DT-ACR). When DT-ACR fails, targets that are not lost were tracked continuously, while lost targets were retrieved in the nearby location, which effectively increased the duration of tracking. Experiments showed that the algorithm was able to track each individual pig in the following conditions: no-light scenes, sun glint scenes, adhesion scenes and occlusion scenes. The overall tracking accuracy reached up to 87.32% (83.85% for serious adhesion, 87.4% for occlusion, 82.4% for strong light, 82.17% for no light and dark, 96.58% for 2 pigs, 88.33% for 3 pigs and 77.63 for 4 pigs). A pig activity analysis study based on the pig detection and tracking algorithm was carried out, and the results showed that the proposed method was able to track pigs for a long period of time and extract the values that reflected pigs’ movements.
Keywords: computer vision, pigs, animal behaviors, tracking, detection
DOI: 10.25165/j.ijabe.20191204.4591
Citation: Xiao D Q, Feng A J, Liu J. Detection and tracking of pigs in natural environments based on video analysis. Int J
Agric & Biol Eng, 2019; 12(4): 116–126.
1 Introduction
Pig breeding is an important topic in livestock industry. Disease, sow production and group fighting need to be monitored and intensively managed during breeding periods. Conventional monitoring by human labor in real time is normally difficult due to low accuracy and time-consuming. It cannot meet the requirements of large-scale farming and efficient production. Information technology is promising to address this problem. Many researches used RFID (radio frequency identification technology) and sensor technology for livestock industry automation[1,2]. Compared to that, computer vision technology could avoid the shortcomings such as signal distance limitations and physical contact with animals which makes them feel uncomfortable. Moreover, it is low cost on hardware, and can monitor and manage the animals in large-scale farms automatically. Thus, it is suitable to monitor and manage pigs’ behaviors using computer vision.
Pig detection and tracking are important foundations for the video analysis of pig behavior. However, it is sometimes difficult to identify and track each individual pig from multiple objects under natural environment. Compared to laboratory conditions, natural environment has more challenges such as changes of light, complex scenes, adhesions and occlusions.
Received date: 2018-08-21 Accepted date: 2019-06-25
Biographies: Aijing Feng, Postgraduate student, research interests: computer vision, Email: [email protected]; Jian Liu, Undergraduate student, research
interests: computer vision, Email: [email protected].
*Corresponding author: Deqin Xiao, PhD, Professor, research interests:
precision agriculture and computer vision. South China Agricultural University, Guangzhou 510642, China. Tel: +86-20-85280320, Email: deqinx@ scau.edu.cn.
Researchers have investigated different approaches to detect and track pig using computer vision. Zhu and Zhang[3] detected a single pig based on background subtraction and frame difference; Ma et al.[4] automatically segmented a pig by its profile feature. These detection methods were used only on a single pig. As for the detection and tracking multiple pigs, many scholars tried group characteristics. Shao and Xin[5] evaluated population comfort by using the degree of crowding. Nasirahmadi et al.[6] used Delaunay triangulation to analyze the relationship between ambient temperature and the degree of crowding of pig. Bloemen et al.[7] used activity index to analyze animal responses to the environment. Oczak et al.[8] used activity index and a feed forward neural network to classify aggressive behavior. However, detection and tracking of an individual pig from multiple pigs is still a problem that needed to be solved. Pu et al.[9] and Zhu et al.[10] identified each pig by sticking marks on pigs’ bodies, while Kashiha et al.[11] did the same thing by drawing different marks. Since the marks were easy to fall off or fade, these two methods were difficult to apply in long-term monitoring. To deal with the above problems, Ahrendt et al.[12] used support map to track pigs in loose-housed stables. Zhou et al.[13] tracked multiple pigs by combining Camshift and Kalman filters while Yu et al.[14] used target association based on the Kuhn-Munkres (KM) algorithm. They carried out tests on videos with non-occlusive and non-adhesive scenes. However, pig behavior analysis requires a continuous and long-term detection and tracking of pigs. Especially, in natural environment, with frequent changes in light, adhesion and occlusion, identify and track pigs correctly are challenging. None of the existing studies addresses these difficult and important issues.
based on a set of association rules with constraint items (DT-ACR) and recent research[15,16]. Various methods were used to eliminate interference problems in the natural environment, and to detect and track pigs over a long period.
2 Materials and methods
Our study was carried out on a swine barn in Lichi Agricultural Co., Ltd, Guangzhou, Guangdong, China. A 4 million pixels hemispherical web video camera (DS-2CD2355(D)-I, Hikvision, Hangzhou, China) was installed at about 5 m high on the top of the piggery (area of 4 m×5 m). Videos instead of a sequence of still images were captured by the camera to obtain pig's activity without interruption. Frame-by-frame pig detection and inter-frame motion correlation of the pigs are the key to the anti-interference algorithm. Using the detection and tracking results from previous few frames could help the detection and tracking of the currently frame more efficiently. Videos were saved in an NVR (Network Video Recorder) which was placed in the staff working chamber. Figure 1 shows the steps in the procedure.
Figure 1 Procedure of video captures and detection and tracking method
2.1 Distinction between pigs and background based on color information
Pigs often lie down for a long period of time and detection of pigs based on motion analysis[17] are ineffective. Also, pigs’ activities are casual and fixed template matching for detection[18] would fail. Deformable template matching[19] is computationally complex and unable to meet real-time requirements. Color characteristics are simple for calculation and not depend on shape, which have been shown to be suitable for pig detection[20]. Consequently, this paper used color characteristics to distinguish the pigs from the background.
The most frequently used color spaces are RGB, YCbCr, and HSV[21]. Zhou et al.[16] used the Hue, one component of the HSV space to identify pigs, while Yu et al.[20] selected the Cr, one component of the YCbCr space. In the early stage of our experiments, we observed different pigsties on multiple farms, and realized that it was not advisable to choose a fixed component of a color space in advance since the light, perspective and surroundings of the environment are changing continuously.
To recognize pigs in various environment, this paper proposes a scheme based on self-adaption selection of component of a color space. Consider if a specific component c of a color space could
divide an image into background C0 and objects C1 based on a value of gray-scale T (which serves as a threshold) in the range of the total gray values [0, L][22,23]. Here L is the max gray values in the gray image, i.e. L=255. The variance of intra-class and between-class of C0 and C1 can be defined by Equations (1) and (2): 2 2 0 0 0 0 0 2 1 1 1
1 1 1 1
1 / / T T i i
intra class T i
i i
i
L
L i T i
i L i T i i T ip
σ w i p w
p
ip
w i p w
p = − = = − − = + − = + = + ⎛ ⎛⎛ ⎞ ⎞⎞ ⎜ ⎜⎜ ⎟ ⎟⎟ = ⎜ ⎜ − ⎟⎟+ ⎜ ⎟ ⎜ ⎟ ⎜ ⎝⎝ ⎠ ⎠⎟ ⎝ ⎠ ⎛ ⎛⎛ ⎞ ⎞⎞ ⎜ ⎜⎜ − ⎟ ⎟⎟ ⎜ ⎜⎜⎜ ⎟ ⎟⎟⎟ ⎜ ⎝⎝ ⎠ ⎠⎟ ⎝ ⎠
∑
∑
∑
∑
∑
∑
(1) 1 2 02 0 0
0 0 ( ) (1 ) L T i i i i
between class T i i
w ip ip
σ ip w − = = − = ∗ − = −
∑
∑
∑
(2)where, i is the grayscale value of this image, and pi is the
probability of each grayscale value appearing. 0 0
T i i
w =
∑
= p isthe probability of C0 appearing,
1
1 1
L i i T
w =
∑
= +− p is the probability of C1 appearing.The optimal method to recognize pigs C1 from background C0 is to find a threshold T iteratively which makes the between-class variance bigger but intra-class variance smaller[24]. Thus, the threshold T that makes η(T) the largest is the optimal threshold, as shown in Equation (3):
2
2 2
max ( ) intra class intra class between class
σ ηT σ σ − − − =
+ (3)
There are n components considered for classification of C0 and C1, and let N={c1, c2, c3, …, cn} be the set of these color
components. A color component c which has the maximum δin
N should be chosen. In other words, it is easier to distinguish pigs from the background in component c because it has the biggest ηc(T)
in all components, as shown in Equation (4):
1
( ) max ( )
( ) c n c c η T δ c η T = =
∑
(4)To speed up the operational efficiency to meet real-time requirements, the following steps were used:
(1) The algorithm gives priority to the component ci that
selected in last frame. If ηci>ε (the accuracy ε is assigned
artificially), that is to say, ηci meets the precision requirement. Then
we choose this component ci directly;
(2) Sort n candidate component artificially according to the prior knowledge at system initialization. If condition (1) is not satisfied, calculates every δ in each component in order. If it encounters the ηof a specific component ci′ which is greater than
the accuracy ε, (ηci′>ε), then the algorithm chooses this component
ci′directly and stop calculates ηof the rest components;
(3) If condition (2) is not satisfied, the algorithm chooses the component ci″which has the maximum δci″.
2.2 Denoising based on connected regions in binary image
After the classification of C0 and C1, a binary image that including objects to be detected was obtained. Firstly, the method for searching connected regions in a binary image is introduced as follows:
(1) Scan each value Binary(x, y) in the binary image row by row and column by column.
the four adjacent positions (x–1, y), (x+1, y), (x, y–1), (x, y+1) into the stack with the corresponding values of 1 or 0, as shown in Figure 2.
Figure 2 Connected regions in binary image
(3) The stack elements temp(x, y) are popped up one by one from the stack and are assigned temp(x, y)=Label. The algorithm then pushes the coordinates of the four adjacent fields of temp(x, y), i.e. (x–1, y), (x+1, y), (x, y–1), (x, y+1), into the stack with the corresponding values of 1 or 0.
(4) Repeat step 2 and step 3 until the stack is empty, which means the search for this connected region is over.
(5) Label=Label+1, then return to step 2 to continue looking
for the next connected region until the entire image is scanned. Secondly, there are four kinds of noise interference:
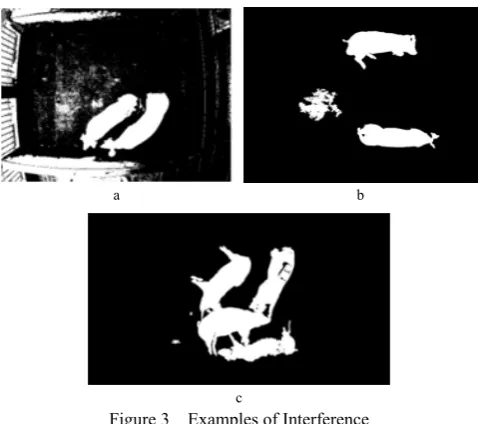
(1) The noises of trough, sink, fence, railings which are fixed facilities and are always in the same positions of the videos (as shown in Figure 3a) when a stabilized camera was used. They can be eliminated at the time of initialization by manually delineating the locations (the four corner coordinates) where pigs can appear, as demonstrated by Kashiha et al.[25].
a b
c
Figure 3 Examples of Interference
(2) Ground texture, dust, sun glint and some small environmental noise (also shown in Figure 3a) can be eliminated by morphological erosion and dilation.
(3) The wrong detected targets which has larger area than those in (2) but relatively smaller than pigs, such as large ground texture and dirt (as shown in Figure 3b), it can be denoised by the following algorithm. First, find every connected region with a value of 1, and then calculate the its area. Remove small area targets according to a given area threshold Tb. Assume that the
area of a pig isτ={τmin, τmax}, then Tb should be set smaller than
τmin.
(4) Noises like dust, bulky light, and markings on the pig’s body can make a pig’s profile incomplete and leave holes in the center of the pig, as shown as Figure 3c. The following algorithm
can be used for denoising. First, find every connected region with a value of 0, and then calculate its area. Fill the hole with the value 1 if its area is smaller than a given area threshold Tf. This
will eliminate the holes in the pig.
These four kinds of noise interference were deal with one by one in the order from (1) to (4). Process (1) was conducted at the initialization. Small hole fillings of (4) should be done after filtering (2) and (3), or it may increase ambient noise. Tf should
be set considered the width of the pig’s body as the black holes on the pigs are only a small part of the body of a pig. A slightly smaller value would be more appropriate. The process could not work for the case when the ‘black hole’ connects to the background. But it could be dealt with in Section 2.4 as long as these noises do not divide the area of a pig into two parts. If the noises do divide the area of a pig into two parts, the inter-frame motion correlation described in Section 2.5 could deal with this case. Denoising is an efficient and time-saving operation. The noise removal here is to deal with some of the conditions before Section 2.4 and 2.5 to save their processing time and make them work efficiently.
2.3 Segmentation of pigs based on contours and edge
Pigs are raised in groups and the algorithm faces the problem of adhesion and occlusion during prolonged monitoring. Figure 4 shows examples (also see the levels of interference in Table 2).
a. Non-Adhesion, Non-Occlusion b. Mild Adhesion
c. Serious Adhesion d. Partial Occlusion Figure 4 Examples of Adhesion and Occlusion The method provided in Feng and Xiao[15] and Xiao et al.[16] was used here for pig segmentation. We defined each connected region after the process of Section 2.2 as a block that including pig targets. A block included an individual pig can be obtained directly if there is no adhesion and no occlusion as shown in Figure 4a. However, a block could include multiple pigs if there are adhesion and occlusion as shown in Figure 4b-4d. The edge of each pig was detected, and then segment the block that included adhering pigs into multiple blocks by enhancing their contours and edges and then split the pigs based on them. After that, a number of blocks of individual pigs can be obtained, denoted by bti, where t
is the time as the pigs were detected frame by frame, and i is the id of a block including a specific pig. The set of blocks is denoted by B={b1t, b2t, b3t, b4t…bit}. In the case of partial occlusion, a pig
might be segmented into two blocks and this would be dealt with in section 2.5.
2.4 Locating every pig
the set of coordinates of the edge for each block were extracted and then these coordinates were fit into an ellipse by least square method[17]. The information for each pig target is denoted by
pit=f(Cx, Cy, θ, α, β). Cx and Cy are the center coordinates of the
ellipses, θis theangle of the ellipses, and αandβare thelong axis and short axis of the ellipses. The meaning of i and t are the same as they were described in bti. The set of pigs is denoted by P={p1t,
p2t, p3t, p4t ... pit}.
2.5 Detection and tracking based on a set of association rules with constraint items (DT-ACR)
To describe the inter-frame motion correlation of the pigs, assume that the last frame of each individual pig is pit–1=f (Cx, Cy, θ,
α,β) and that each block detected by the current frame is bti. In
the video, the following four cases occurred[26]:
Case 1: The block bti does not have any overlap with every
target of pig pti–1in last frame. This means the current frame has a
new target bti.
Case 2: The target of pig pti–1 in last frame does not have any
overlap with every block bti in this frame. This means this target pti–1 is missing at this current frame.
Case 3: The block bti and the target of pig pti–1 correspond to
each other.
Case 4: The block bti corresponds to a number of targets of pig pti–1in last frame. This means two targets in the current frame are
adhering or occluding.
Assume that each pixel in bti can be represented as pointjt = I(x, y), then the positional relationship between pti–1 and pointjt can
be defined as:
1
( t, t )
j i
D point p− = v vr r∗ (5)
where, cos( ) sin( ) , sin( ) cos( )
y x
θ θ x C y C
v
θ θ α β
− ⎛ − ⎞
⎡ ⎤ −
=⎢ ⎥⎜ ⎟
⎣ ⎦⎝ ⎠
r .
From the definition of D, when D<1, it means the pixel pointjt
is inside the ellipse pti–1. When D>1, it means the pixel pointjt is
outside the ellipse pti–1.
In order to track pigs continuously over a long period of time, an anti-interference algorithm for detection and tracking is proposed based on DT-ACR. These rules are defined as follows.
The correlation between pti–1 and every pixel pointjt inside bti is
defined as C(pit–1, pointjt), which should satisfy the following rules:
Rule 1: If pointjt is inside a certain ellipse pti–1 (D<1), this pixel pointjt should be assigned to the ellipse pti–1.
Rule 2: If pointjt is outside every ellipse pti–1 (D>1), this pixel
pointjt should be assigned to a certain ellipse pti–1 which has the
minimum value of D and is smaller than the accuracy ζ, where the accuracyζ is set artificially.
Rule 3: If pointjt is outside every ellipse pti–1 (D>1) and every D is larger than the accuracy ζ, then pointjt is considered to be a
noisy point (such as a large spot that is difficult to eliminate in the pretreatment) and should not have any association.
In response to real-time, the algorithm proceeds as the following rules:
Rule 4: The algorithm has to first determine which of the four cases (as above) the current frame faced.
Rule 5: If it encounters Case 3, there is no need for a calculation of positional relationship and any association, and this pig block bti has a direct one-to-one connection with the ellipse pti–1.
Rule 6: If the situation is not Case 3, the algorithm calculates the association between bti and pointjt, as in Rules 1-3 above, which
can deal with adhesion and occlusion.
Rule 7: Since the movement of pigs in a short time does not change too much, the five thresholds of maximum change for elliptic parameters μ={μcx,μcy,μθ,μα,μβ} are provided manually at the time of algorithm initialization. The maximum variation of the elliptic pti is subject to the threshold μ.
Rule 8: The area of a pig is subject toτ ={τmin, τmax} to deal with the partial occlusion which might cut an individual pig block
bti into two parts.
The value of ζin Rule 2 should not be set too large, or it will not achieve the function of filtering noise. On the other hand, if the value is too small, then the pig might run too fast to be tracked. The value of ζshould therefore be set with reference to the speed of pig activity.
The purpose of Rules 4-8 is to correct detection errors, and to speed up the computational efficiency to achieve real-time requirements. The cases (Case 1 to Case 4) encountered in real-time video frames are counted in our experiment, as explained in Section 3.1. In practical applications, most of the frames correspond to Case 3, which can have good tracking results without DT-ACR, as demonstrated in the studies of Feng and Xiao[15] and Xiao et al.[16]. Case 1 and Case 2 will occur when the pig is completely occluded. However, in our experiment, the pigs are reared in captivity, the number of pigs is fixed, and the camera placed on top of the piggery can shoot all the positions they can appear, so the case of complete occlusion rarely appears. Case 1 and Case 2 will also occur when the target is lost and then re-occurring, as explained in Section 2.6. Case 4 is the case of adhesion and occlusion. As described above, skipping the calculation of position when encountering Case 3 can achieve real-time requirements without reducing the recognition rate.
The value of μ in Rule 7 should not be set too large, or the set of point in elliptic ptiwill expand very rapidly, which makes the pig
target large when the case of adhesion or occlusion is encountered (see Section 3.3). On the other hand, if the value is too small, then the pig will run too fast and the tracking will be lost. When the pigs are crowded, a pig’s speed may be much smaller than the speed when they are alone, so μ should be set smaller than the average daily speed of pigs. The appropriate value μ can also serve to filter noise and false targets.
The value of τ should be set with reference to the size and shape of a pig.
After completing all calculation and rules list above, the ellipse
pti of the current frame are updated according to each C. The
whole process of DT-ACR is shown in Algorithm 1.
Algorithm 1: DT-ACR
Input: bti, pti–1 (i=1,2,3,4...)
Output: pti (i=1, 2 ,3, 4...)
if t t corresonding t1
j i i
point b p−
∀ ∈ (Case 3) then
C(pit–1, pointjt): bti pti (Rule 5)
else (non-Case 3) for pointjt in bti (Rule 6)
for t 1
i
p− in all
( t, t 1)
j i
D point p− = v vr r∗ (Equation (5))
if D<1D<1 then
C(pit–1, pointjt): pointjt∈pit (Rule 1)
break end if end for
search min D(pointjt, bit) & D<ζ, C(pit–1, pointjt): pointjt∈pit (Rule 2)
end if
if pointjt ∩ every pit–1=null & all D>ζ (Rule 3)
C(pit–1, pointjt): pointjt is distraction
end if end for end if
update pit=f(Cx, Cy, θ, α, β) (i=1,2,3,4...) subject to μ={μcx,
μcy, μθ, μα, μβ} and τ={τmin,τmax} (Rule 7 and Rule 8) 2.6 Handling error and lost pigs
In order to enhance the robustness of the algorithm, the following methods for handling error and lost pigs is proposed:
(1) When the detection algorithm fails and a pig is lost, the unmatched pti in P retains the old value of the previous frame;
(2) If the algorithm can detect a pig again near the lost pti in
the next frames, then this target will be associated with the lost
pti. The algorithm is considered to have recovered the lost pti,
which is still able to be tracked continuously. That is to say, “found the pig in where it lost.”
(3) When the detection algorithm fails for a long time, and cannot match pti and bti for more than frames, it needs to wait Twait seconds. Then the lost pig needs to be re-identified and its
label needs to be re-assigned. The setting of should refer to the size and speed of a pig, as explained in Feng and Xiao[15].
(4) When labels need to be re-assigned, the algorithm first searches the lost label in P. The labels of the pigs that are not lost are marked as 0, while the lost labels are marked as 1. The labels marked as 0 do not need to be re-assigned, retaining the original label and continuing tracking. For the new targets detected in this frame, they are assigned with a label which is marked as 1 in P. If there is only one lost label, the algorithm is considered that it recovers the lost pig. If there is more than one lost label, the new target labels are randomly assigned and the pigs’ labels may not be the same as it lost before.
Those are extremely simple methods for handling error and the lost pigs. Moreover, they greatly increase the duration of
continuous monitoring, as explained in Section 3.3.
3 Experimental results and analysis
3.1 Introduction of test data
The experiment was carried out from November 15, 2015 to August 15, 2016, with a time span of 9 months. A total of 1318 videos were captured, and each lasts 20 to 80 minutes, for a total of 1075 hours. In these videos, some pigsties had 2 pigs, some had 3 pigs, and some had 4 pigs. Due to the large number of videos, only a small number of videos were chosen as experimental data. These experimental data were analyzed as follows.
(1) We statistically analyzed the data from November 12, 2015 to November 16, 2015, every day from 09:00 to17:00 with 2 pigs in each pen. Statistics from this experiment suggested that most of the time pigs were in a state of sleep, as shown in Table 1. As for the pigsties with 3 pigs and 4 pigs, the activity time would not be longer than 2 pigs in each pen due to crowding (see Section 3.4 below). The algorithm proposed in this paper is designed to detect the movement of pigs, so most of the data was selected in these two periods: 11:00 to 13:00 and 15:00 to 17:00, which are the most active periods for pigs throughout the day because of feeding[16].
Table 1 Motion statistics (min)
Total duration
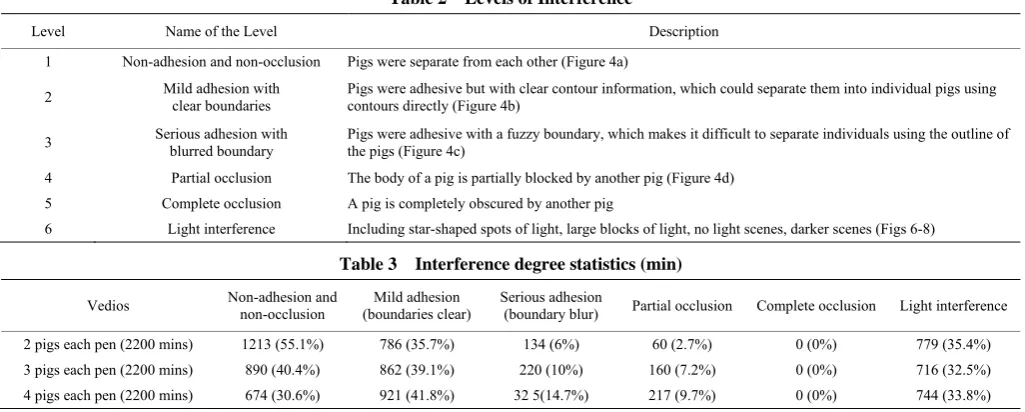
(2200 min) Sleeping Lying Walking Eating NO. 1 (Large White) 994 (45.2%) 265 (12%) 343 (15.6%) 423 (19.2%) NO. 2 (Landrace) 1642 (74.6%) 128 (5.8%) 159 (7.2%) 178 (8.1%) (2) The videos were classified into six levels of interference, as described in Table 2.
(3)Data from April 18, 2016 to April 30, 2016 were statistically analyzed, every weekday from 9:00 to 17:00 with 3 pigs in each pen, and from July 15, 2016 to July 19, 2016, every day from 9:00 to 17:00 with 4 pigs in each pen, as shown in Table 3. Statistics suggested that as the number of pigs in the pigsty increases, adhesion and occlusion would become more and more serious, also with a higher probability. Light interference and occlusion or adhesion could occur in the same scene. However, there were no complete occlusions in this experiment.
Table 2 Levels of Interference
Level Name of the Level Description
1 Non-adhesion and non-occlusion Pigs were separate from each other (Figure 4a)
2 Mild adhesion with clear boundaries Pigs were adhesive but with clear contour information, which could separate them into individual pigs using contours directly (Figure 4b) 3 Serious adhesion with blurred boundary Pigs were adhesive with a fuzzy boundary, which makes it difficult to separate individuals using the outline of the pigs (Figure 4c) 4 Partial occlusion The body of a pig is partially blocked by another pig (Figure 4d)
5 Complete occlusion A pig is completely obscured by another pig
6 Light interference Including star-shaped spots of light, large blocks of light, no light scenes, darker scenes (Figs 6-8) Table 3 Interference degree statistics (min)
Vedios Non-adhesion and non-occlusion
Mild adhesion (boundaries clear)
Serious adhesion
(boundary blur) Partial occlusion Complete occlusion Light interference 2 pigs each pen (2200 mins) 1213 (55.1%) 786 (35.7%) 134 (6%) 60 (2.7%) 0 (0%) 779 (35.4%) 3 pigs each pen (2200 mins) 890 (40.4%) 862 (39.1%) 220 (10%) 160 (7.2%) 0 (0%) 716 (32.5%) 4 pigs each pen (2200 mins) 674 (30.6%) 921 (41.8%) 32 5(14.7%) 217 (9.7%) 0 (0%) 744 (33.8%)
(4) In the case of tracking pigs without adhesion or occlusion, a simple solution, but with a high correctness rate, is provided by Feng and Xiao[15] and Xiao et al.[16]. They also had good results in the case of mild adhesion. However, it cannot handle the problems of serious adhesion and occlusion, which proposes to
the adhesive or occlusive pigs, as shown in Figure 5.
Figure 5 Outline information of clear and blur boundaries Since choosing non-adhesion and non-occlusion data again was of little significance, in this experiment we only selected the videos with serious adhesion and occlusion from the database. The specific parameters of videos are described in Table 4. Test 1 and Test 2 correspond to Test 1 and Test 4 in Feng and Xiao[15] and Xiao et al.[16], while Test 3 corresponds to Test 6 in Feng and Xiao[15]. The purpose of Test 1-3 was to compare the algorithm in this paper with the algorithm in our previous work[15,16]. Compared to our previous research, this paper used a wealth of multi-objective experiments.
(5) The NVR automatically named the video files according to the time (for example, 20151117121452 represented November 17, 2015 at 12:14:52). NVR automatically divided the videos into small sections for easy storage. The length of each video was not the same and varied between 20-80 minutes. In order to test the long-term tracking of the algorithm, this experiment tried to select longer videos as test data. In the case of Test 1-3, every frame was processed in order to compare with Feng and Xiao[15] and Xiao et al.[16]. The other tests were processed every 5 frames per second to facilitate manual statistics (this is only for manual statistics here, the program processed every frames of the videos in the application of the farm). Some pigs were painted with labels to facilitate manual identification and statistical accuracy, but the algorithm did not use the labels for tracking purposes.
3.2 Detection and tracking performance test under interference conditions
3.2.1 Light interference (1) No lighting scenes
The experimental results showed that the self-adaptive color component selection was able to find the optimal component to recognize pigs. This method was able to solve the problem that mentioned in Feng and Xiao[15] when lack of illumination, as shown in Figure 6a. Figure 6b shows the result of no light scene using the algorithm described in this paper. The camera was equipped with night infrared that shows black and white effects.
a b Figure 6 Examples of no lighting scenes
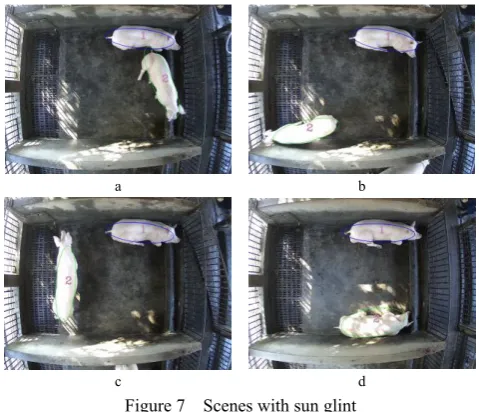
(2) Scenes with sun glint
The experimental results showed that sun glint had no effect on
the algorithm. Morphological erosion and dilation, and removing the small size of connected regions in binary image was able to filter sun glint effect. The distant sun spot was not associated with any pigs because of Rule 7. Rule 7 and Rule 8 limited the size of an ellipse avoiding it to be cut into two small ellipses when the pig was stay in sun glint, and were able to effectively limit the expansion of an ellipse so that recognition was not impaired. Figure 7a-7d show scenes in which a pig passes through sun glint and then stays in another sun glint.
a b
c d Figure 7 Scenes with sun glint
(3) Scenes with large spots of light
The experimental results showed that large patches of light distant from the pigs were not affected because of Rule 7. However, if the video started with a large spot, the detection algorithm would identify the spot as a pig because the spot was the same size as a pig, as shown in Figure 8a. In addition, the algorithm cannot make any association with the previous frame when it starts. Moreover, when a pig passed through a non-initial large spot, the tracking algorithm could not track the pig correctly, as the ellipse would stay at the spot and the error could not be corrected even with the error handing methods are used. This case was due to the shortcoming of Rule 7 and Rule 8. The algorithm regards a large spot as a pig and then the actual pig which passes through the spot is filtered out as noise. Figures 8b-8c show the result of pigs passing through a large spot. The problem of large spots is difficult, and its solution will require further improvements to the detection algorithm.
a
3.2.2 Serious adhesion
In the case of mild adhesion, the algorithm was able to identify and track pigs with 100% accuracy (see Section 3.3 below). Figure 9a shows a scene of mild adhesion using the method in Feng and Xiao[15], and Figure 9b shows the same scene using the algorithm described in this paper. In the case of serious adhesion, the algorithm in this paper could also identify and track pigs effectively (Section 3.3). Figure 9c shows the result of serious adhesion in the case of 3 pigs, and Figure 9d shows the result in the case of 4 pigs.
a b
c d Figure 9 Results of adhesion
3.2.3 Partial occlusion
As regards partial occlusion, this algorithm was also able to identify and track pigs effectively (Section 3.3). The method in Feng and Xiao[15] failed to solve the occlusion problem (Figure 10a). The resistance of interference favored the algorithm in detecting and tracking pigs over a long period of time. Figure 10b shows the result of the algorithm in this paper on occlusion scenes. Figure 10c-10d show occlusion scenes with 3 pigs, and Figure 10e-10f show occlusion scenes with 4 pigs.
Although the target was identified correctly and the labelling was not chaos, sometimes the detected pigs were incomplete in occlusion scenes (such as the Figures 10b, 10c and 10f, the heads of the pigs did not include in the ellipses). The main reasons for this were:
(1) When pigs were in a complex state of motion, point set associations with the blocks tended to be confusing, which resulted in incomplete contours; and
(2) When pigs were in a state of occlusion, some point sets are filtered out by the inflated edge information of pigs.
The experimental results also showed that the success rate of the algorithm was very high at the beginning of an occlusion scene, but with the increasing complexity of movement and the duration of the occlusion, point set become confused, especially in the later stages of the occlusion. Thus, the error rate increases. In addition, sometimes label exchange situation would occur in the later stages.
a b c
d e f
Figure 10 Results of occlusion
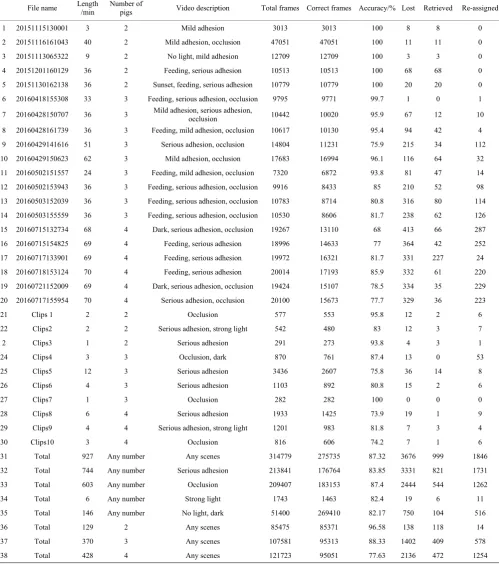
3.3 Accuracy test
Two series of tests--long-term tracking and anti-interference, were carried out, as shown in Table 4. Tests 1-20 focused on long-term tracking, in which the length of videos were longer and each video might contain several levels of adhesion and occlusion. Tests 21-30 focused on anti-interference, in which the videos comprised artificial clips of shorter duration and the entire video included adhesions or occlusions with light interference. The correct frame refers to the correct detection of individual pigs and continuous label tracking. The error frames were counted from the beginning of each label error to the last frame. Because we used the methods of error handling, a detection error did not necessarily lead to a label losing. In addition, label losing did not necessarily cause label re-assignment. If the algorithm can recover the lost pigs, it does not need label re-assignment. #31-38
are the statistical analysis of different situations.
It can be seen from Table 4 that in the long-term detection and tracking test, the algorithm had good performances with 2 pigs and 3 pigs, while the accuracy rate decreased with 4 pigs. The algorithm performed well on most adhesion and occlusion scenes. However, in some serious adhesion and occlusion scenes, the increases and duration of adhesion or occlusion affected the accuracy, because of the point set association error. The mislabeled rate also increased with the upsurge of the detection and tracking error. The accuracy rate of the strong light, no light and dark scenes are a little bit lower, which indicated the light effect is still a problem that could be improved in the future study.
long-term continuous tracking. However, there were still some detection errors that could not be corrected, which could only be re-assigned new labels. The re-assignment might not be successful every time, depending on whether the disturbance condition disappeared or not. Only when the detection algorithm was able to correctly identify pigs would the re-assignment be
successful; otherwise the error handling mechanism would locate the ellipses with the old labels in a state of waiting for a match. The effectiveness of the recover depends on the pigs movement at that time. Detection errors persisted for a long time and too much positional changes in conjunction are the main reasons for the recover failure.
Table 4 Accuracy statistics
File name Length /min Number of pigs Video description Total frames Correct frames Accuracy/% Lost Retrieved Re-assigned
1 20151115130001 3 2 Mild adhesion 3013 3013 100 8 8 0
2 20151116161043 40 2 Mild adhesion, occlusion 47051 47051 100 11 11 0
3 20151113065322 9 2 No light, mild adhesion 12709 12709 100 3 3 0
4 20151201160129 36 2 Feeding, serious adhesion 10513 10513 100 68 68 0
5 20151130162138 36 2 Sunset, feeding, serious adhesion 10779 10779 100 20 20 0 6 20160418155308 33 3 Feeding, serious adhesion, occlusion 9795 9771 99.7 1 0 1 7 20160428150707 36 3 Mild adhesion, serious adhesion, occlusion 10442 10020 95.9 67 12 10 8 20160428161739 36 3 Feeding, mild adhesion, occlusion 10617 10130 95.4 94 42 4 9 20160429141616 51 3 Serious adhesion, occlusion 14804 11231 75.9 215 34 112 10 20160429150623 62 3 Mild adhesion, occlusion 17683 16994 96.1 116 64 32 11 20160502151557 24 3 Feeding, mild adhesion, occlusion 7320 6872 93.8 81 47 14 12 20160502153943 36 3 Feeding, serious adhesion, occlusion 9916 8433 85 210 52 98 13 20160503152039 36 3 Feeding, serious adhesion, occlusion 10783 8714 80.8 316 80 114 14 20160503155559 36 3 Feeding, serious adhesion, occlusion 10530 8606 81.7 238 62 126 15 20160715132734 68 4 Dark, serious adhesion, occlusion 19267 13110 68 413 66 287 16 20160715154825 69 4 Feeding, serious adhesion 18996 14633 77 364 42 252 17 20160717133901 69 4 Feeding, serious adhesion 19972 16321 81.7 331 227 24 18 20160718153124 70 4 Feeding, serious adhesion 20014 17193 85.9 332 61 220 19 20160721152009 69 4 Dark, serious adhesion, occlusion 19424 15107 78.5 334 35 229 20 20160717155954 70 4 Serious adhesion, occlusion 20100 15673 77.7 329 36 223
21 Clips 1 2 2 Occlusion 577 553 95.8 12 2 6
22 Clips2 2 2 Serious adhesion, strong light 542 480 83 12 3 7
2 Clips3 1 2 Serious adhesion 291 273 93.8 4 3 1
24 Clips4 3 3 Occlusion, dark 870 761 87.4 13 0 53
25 Clips5 12 3 Serious adhesion 3436 2607 75.8 36 14 8
26 Clips6 4 3 Serious adhesion 1103 892 80.8 15 2 6
27 Clips7 1 3 Occlusion 282 282 100 0 0 0
28 Clips8 6 4 Serious adhesion 1933 1425 73.9 19 1 9
29 Clips9 4 4 Serious adhesion, strong light 1201 983 81.8 7 3 4
30 Clips10 3 4 Occlusion 816 606 74.2 7 1 6
31 Total 927 Any number Any scenes 314779 275735 87.32 3676 999 1846
32 Total 744 Any number Serious adhesion 213841 176764 83.85 3331 821 1731
33 Total 603 Any number Occlusion 209407 183153 87.4 2444 544 1262
34 Total 6 Any number Strong light 1743 1463 82.4 19 6 11
35 Total 146 Any number No light, dark 51400 269410 82.17 750 104 516
36 Total 129 2 Any scenes 85475 85371 96.58 138 118 14
37 Total 370 3 Any scenes 107581 95313 88.33 1402 409 578
38 Total 428 4 Any scenes 121723 95051 77.63 2136 472 1254
The value of μ had an impact on the accuracy rate. Different settings of μhad different effects on different scenarios. Figure 11a shows an example where μwas set so high that the point set was spread too large which half of the nearby pig was included within the ellipse of the most left pig. If Pig No.4 tended to move
to the direction of Pig No.3, the two labels were easily confused. However, too small of value μ was not conducive to tracking movement. Figure 11 shows the effect of different μ values on the same frame image.
to test the time of processing one frame in the following situations: no adhesion an no occlusion, mild adhesion, serious adhesion and occlusion of 2 pigs, 3 pigs and 4 pigs. The test was conducted in a desktop that consisting of 16 G random access memory (RAM), a CPU of Intel® CoreTM i7-7700 with 3.60 GHz and a GPU of GeForce GTX 570 with 1G. Table 5 shows the average time spent on one frame. The frame rates of videos vary from 21-26 frames per second. It could be seen from Table 5 that even in serious adhesion and occlusion cases the algorithm still meets the real-time requirement.
a b Figure 11 Results of different µ
Table 5 Average time (s) spent on one frame
Number of
pigs No adhesion an no occlusion adhesion Mild adhesion Serious Occlusion
2 0.023 0.022 0.032 0.041
3 0.022 0.024 0.047 0.046
4 0.022 0.022 0.042 0.042
3.4 Application test of pig activity
The social habits of pigs, including fighting, feeding, excretory, and exploratory habits, can all be monitored by motion detection. Motion detection can capture their regular daily activities, health, heat regulation, performance, and so on. Here are specific examples:
(1) Pigs have their own regular habits. Monitoring their activities over a long period of time can capture these regular daily routines, and play an important role in the study of pig behavior and in agricultural improvements.
(2) Pig behavior varies according to the breed and the age of the pig. Healthy pigs usually maintain stable daily activities. An abnormal change indicates that the pigs’ health are malfunctioning
or their comfort are being affected by the environment. Abnormal data can be used to find sick pigs or environmental changes.
(3) Monitoring can be used to develop a suitable breeding plan according to different activities associated with stages of growth, environment, season, climate, and so on.
(4) Monitoring is of great significance for the selection of breeding pigs. High activity within a reasonable range indicates that the pigs are more productive and more suitable for breeding.
However, there is no clear way to measure pig activity based on motion detection. Bloemen et al.[7] used image analysis to measure activity index, while Oczak et al.[8] used activity index to classify aggressive behavior. For this paper, activity accumulation was used to measure pig activity, because it was considered a more important index in reflecting the animal’s activity status, and is also capable of describing the movement characteristics quantitatively in the long term. The measurement is calculated as follows.
Let’s assume that the position of the pig pti at time t is (Cxt, C yt)
and the position at time t+1is (Cxt+1, C yt+1). Then, from t to t+1
the pig’s displacement can be expressed as:
1 2 1 2
( t t) ( t t)
i x x y y
s = C+ −C + C+ −C (10)
In the course of detecting the activity of pig pti, the program
accumulated displacement continuously, so the amount of displacement accumulated in a period of time can be expressed as:
1
end
t i t i
S =
∑
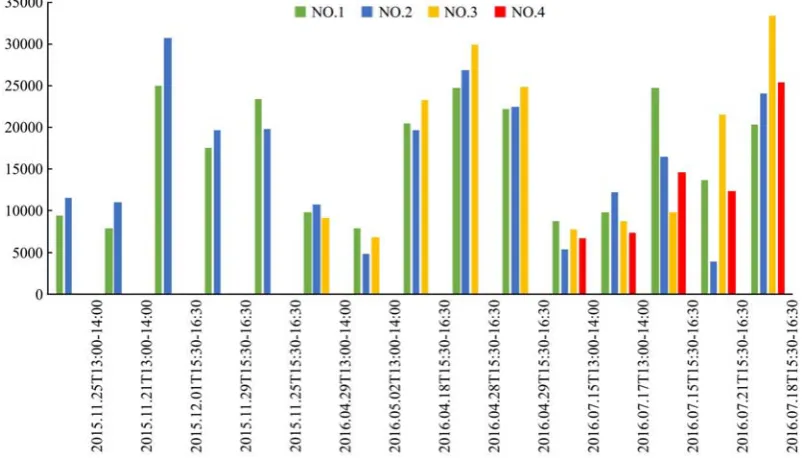
= s (11) As the algorithm in this paper was able to solve the problems of adhesion and occlusion, which Xiao et al.[16] was unable to do, we extended the experiment to 3 pigs and 4 pigs in each pen.In order to ensure the accuracy of the activity accumulation statistics, highly accurate detection and tracking dataset were selected for this test. A small amount of detection and tracking errors did not have a large impact on the overall trend, because the test only concerned with the overall trend but not the exact numerical values. We selected the dataset of quiet periods (13:00-14:00) and feeding periods (15:30-16:30) for testing. As the NVR automatically divided the video, the video was manually edited and spliced for the test. Figure 12 shows the activity accumulation statistics.
The results showed that whether there were 2 pigs, 3 pigs or 4 pigs in each pen, the activity accumulation in active periods was significantly larger than that in quiet periods. In the quiet periods, the activity accumulation of 2 pigs, 3 pigs and 4 pigs in each pen was almost the same. During the feeding periods, the activity accumulation of 4 pigs in each pen fluctuated greatly and the difference between pigs was very obviously. During the feeding periods, the activity accumulation of 2 pigs in each pen was larger than that of 3 pigs in each pen. This conclusion was in agreement with the experimenters’ observations after watching the video. In quiet periods the activity of a pig was small, so the difference of activity accumulation was not significant. When the number of pigs increased, food competition became more intense, which explained why the activity accumulation of 3 pigs in each pen was greater than that of 2 pigs in each pen. This could also explain why the activity accumulation of 4 pigs in each pen fluctuated greatly and the values between pigs varied widely. Another explanation for the fluctuation of activity accumulation with 4 pigs in each pen is crowding.
The statistical results of activity accumulation do not provide a more detailed explanation of pig behavior, because the main focus of this paper was to illustrate the effectiveness of the proposed method in long-term pig detection and tracking. After all, animal behaviors are influenced by many external factors, such as season, weather, temperature, humidity, and so on[27,28]. When long-term detection and tracking can be achieved, the study and analysis of animal behavior will enter a new stage, which will also be the focus for the next stage of this research.
4 Conclusions
In this paper, an anti-interference algorithm for pig detection and tracking was proposed, based on a set of association rules with constraint items (DT-ACR). The algorithm was able to effectively deal with the problems of illumination change, adhesion, occlusion and individual identification in the natural environment, and the correctness rate reached 87.32%. The self-adaption selection of color components was able to recognize pigs in non-illumination scene and sun glint scenes. For the large spot scene, the algorithm was able to identify and track correctly, except for the situation that a large spot is in the first frame of video or when a pig passes through a large spot. An application test of pig activity base on pig detection and tracking also was carried out. The experimental results show that the algorithm can be applied to long-term tracking of real scenes. Also, it can reflect the movement of pigs with a high degree of accuracy, and provides an important technical basis for the further study of pig behavior. The proposed DT-ACR could effectively resist the adhesion and occlusion scenes during pig activity, but when the number of pigs increased, the adhesions and occlusions were more serious with duration increased. In such instances, the algorithm failed. The mechanism for handling error and lost pigs greatly improved the algorithm’s duration of tracking. However, when the pig motion was complex and the detection and tracking algorithms retained errors over a long period, the mechanisms failed.
Acknowledgements
This work was supported by the National Key Research and Development Program of China (grant number 2017YFD0701601) and Guangdong Science and Technology Program, China (grant number 2019B020215004 and 2019B090922002).
[References]
[1] Ma C, Wang Y, Ying G. The pig breeding management system based on RFID and WSN. 2011 Fourth International Conference on Information and Computing. IEEE, 2011; pp.30–33.
[2] Zhu W, Zhong F, Li X. Automated monitoring system of pig behavior based on RFID and ARM-LINUX. 2010 Third International Symposium on Intelligent Information Technology and Security Informatics. IEEE, 2010; pp.431–434.
[3] Zhu J, Zhang L. Detection method on single pig target based on image processing. Computer and Communication, 2014; 12: 11–12. (in Chinese)
[4] Ma L, Ji B, Liu H, Zhu W, Li W, Zhang T. Differentiating profile based on single pig contour. Transactions of the CSAE, 2013; 29(10): 168–174. (in Chinese)
[5] Shao B, Xin H. A real-time computer vision assessment and control of thermal comfort for group-housed pigs. Computers and Electronics in Agriculture, 2008; 62(1): 15–21.
[6] Nasirahmadi A, Richter U, Hensel O, Edwards S, Sturm B. Using machine vision for investigation of changes in pig group lying patterns. Computers and Electronics in Agriculture, 2015; 119: 184–190.
[7] Bloemen H, Aerts J M A, Berckmans D, Goedseels V. Image analysis to measure activity index of animals. Equine Veterinary Journal, 1997; 29(S23): 16–19.
[8] Oczak M, Viazzi S, Ismayilova G, Sonoda L, Roulston N, Fels M, Bahr C, Hartung J, Guarino M, Berckmans D, Vranken E. Classification of aggressive behavior in pigs by activity index and multilayer feed forward neural network. Biosystems Engineering, 2014; 119(4): 89–97.
[9] Pu X, Zhu W, Lu C. Sick pig behavior monitor system based on symmetrical pixel block recognization. Computer Engineering, 2019; 35(21): 250–252.
[10] Zhu W, Pu X, Li X, Lu C. Automatic identification system of suspected diseased pig based on behavior monitoring. Transactions of the CSAE, 2010; 26(1): 188–192. (in Chinese)
[11] Kashiha M, Bahr C, Ott S, Moons C, Niewold T, Odberg F, Berckmans D. Automatic identification of marked pigs in a pen using image pattern recognition. Computers and Electronics in Agriculture, 2013; 93: 111–120.
[12] Ahrendt P, Gregersen T, Karstoft H. Development of a real-time computer vision system for tracking loose-housed pigs. Computers and Electronics in Agriculture, 2011; 76(2): 169–174.
[13] Zhou Y, Yu S, Ou J. Intelligent tracking of pigs combining camshift and Kalman filtering. Guangdong Agricultural Sciences, 2013; 40(9): 174–177, 188. (in Chinese)
[14] Yu S, Chen Z, Ou J. Tracking algorithm based on multi-feature detection and target association of pigs on large-scale pig farms. Journal of Information and Computational Science, 2015; 12(10): 3837–3844. [15] Feng A, Xiao D. Motion parameter extraction algorithm for pigs under
natural conditions. Journal of Computer Applications, 2016; 36(10): 2900–2906.
[16] Xiao D, Feng A, Yang Q, Liu J, Zhang Z. Fast motion detection for pigs based on video tracking. Transactions of the CSAM, 2016; 47(10): 331, 351–357. (in Chinese)
[17] Fu E Y, Leong H V, Ngai G, Chan S. Automatic fight detection based on motion analysis. IEEE International Symposium on Multimedia (ISM), 2015; pp.57–60.
[18] Xiao Q, Hu X, Gao S, Wang H. Object detection based on contour learning and template matching. The 8th World Congress on Intelligent Control and Automation, IEEE, 2010; pp.6361–6365.
[19] Bai X, Li, Q, Latecki L J, Liu W, Tu Z. Shape band: A deformable object detection approach. IEEE Conference on Computer Vision and Pattern Recognition, 2009; pp.1335–1342.
[20] Yu S, Chen J, Ou J, Xu D. Multi-target tracking based on regional correlation and color histogram match. Advanced Materials Research, 2014; 631–637.
[21] Tkalcic M, Tasic J F. Colour spaces: perceptual, historical and applicational background. IEEE, 2003; 1: 304–308.
[23] Zhou L P, Chen Z, Chen D, Yuan Y W, Li Y S, Zheng J H. Pig ear root detection based on adapted Otsu. Transactions of the CSAM, 2016; 47(4): 1–7. (in Chinese)
[24] Otsu N. A threshold selection method from gray-level histograms. IEEE Transactions on Systems, Man, and Cybernetics, 1979; 9(1): 62–66.
[25] Kashiha M, Bahr C, Ott S, Moons C, Niewold T, Tuyttens F, Berckmans D. Automatic monitoring of pig locomotion using image analysis. Livestock Science, 2014; 159: 141–148.
[26] Argyros A, Lourakis M. Real-time tracking of multiple skin-colored
objects with a possibly moving camera. In Pajdla T, Matas J (eds.), Computer Vision – ECCV 2004, Springer, 2004; pp.368–379.
[27] Edwards-Murphy F, Magno M, Whelan P, O’Halloran J, Popovici E. b+WSN: Smart beehive with preliminary decision tree analysis for agriculture and honey bee health monitoring. Computers and Electronics in Agriculture, 2016; 124: 211–219.