Paperless Processes: Benchmarking Small Firm Level of Implementation to Larger
Firm Level of Implementation
Jefferson T. Davis, PhD, CPA CISA
School of Accountancy
Weber State University
3803 University Circle
Ogden, UT 84408-3803, USA
Joseph Hadley
Assistant Controller
Cornerstone Research & Development, Inc.
900 South Depot Dr.
Ogden, Utah 84404, USA
Hal Davis, Attorney
Davis & Sanchez, PLLC
4543 S. 700 E., Suite 100
Salt Lake City, UT 84107, USA
Roman Kepczyk, CPA, CITP
Info Tech Partners North America, Inc.
13656 S. 37th Place
Phoenix, AZ 85044, USA
Abstract
Many professional CPA firms are taking advantage of technology and software to implement paperless office processes in their client services and firm operations. With current technology, a paperless office is not just for large firms. This survey gathers information to determine the extent that paperless office processes are being utilized by local accounting firms. The survey provides an opportunity for each firm surveyed to benchmark their paperless processes with the results of a national survey of accounting firms.These results provide a comparison of smaller firms versus larger firms in their levels of paperless office implementation. Not surprisingly, the local (smaller) firms are not as paperless as the national (larger) firms. The results of the benchmarking questions, however, suggest that the local firms reporting themselves as paperless may not be as paperless to the degree they might think they are.
Keywords:
paperless processing, paperless office, digital office1.
Introduction
In recent years, paperless processes and technology have been developed and increasingly used by businesses and touted as a means to be more efficient and lower costs of operation, while at the same time provide better service to customers and clients (Special Focus Report, 2011; AICPA, 2010). Mike Sabbatis of CCH stated in a Special Focus Report article that,
Over the last several years, several articles have discussed the implementation, benefits and best practices of paperless processes in accounting (Forum of Private Business, 2008; Albrecht, 2009; Manzelli, 2010; Jennings, 2011). Some estimates of reduced cost in paper, storage, processing time, and search time reach up to 30 percent. For example savings can be in time not spent deciphering handwriting, searching for files, determining the status of a return or audit document request at any given time, and responding to staff and client questions at various stages.In addition,how, when, and where work is done becomes more flexible. Interaction with clients and customers, especially where documents are concerned, is faster and easier. An effective document management system provides security, retention management for the document life cycle, an integrated search engine, a check-out/check-in system so that multiple people can work on individual documents, and an audit trail,(Focus Report, 2011). Although the typical software such as Microsoft WindowsTM and OfficeTM provide such features, a workflow management system organizes these features in a cohesive and efficient way.
As computer hardware and software has developed, the cost and complexity of ―going paperless‖ has been reduced, thus making paperless processes more accessible and useful to large as well as small organizations (Davis and Davis 2004; Graham, 2006; DeFelice, 2007). This study measures the ways in which smaller accounting firms utilizepaperless office processes in comparisonto larger firms. The study sent surveys to partners at firms registered with the Utah Association of CPAs. Results from thesurvey are compared to results of a national survey sent to firms registered with Association forAccounting Administration (AAA)(see Kepczyk 2008, 2010, 2011).The average size of firms responding to the local survey was about 23 professionals and 7 staff members. The average size of firms responding in the national survey was above 50 professionals, roughly twice the average size of the local firms. No information was available for number of staff.
2.
Survey Administration
The original survey was sent out to partners of firms listed as their firm’s contact person with the Utah Association of Certified Public Accountants (UACPA). The request, conducted via e-mail, explained the survey and included a link to the online survey administered using SurveyMonkeyTM. Also included in the e-mail was a link to the results of the AAA 2009 Benchmarking Paperless Office Best Practices Survey(Kepczyk, December,2008).Two follow-up requests were also sent via email. Each respondent completed the survey by going to the SurveyMonkeyTMlink. The local firms’ responses serve as a proxy for responses from smaller firms. The national survey results sever as a proxy for responses from larger firms.
3.
Survey Results
Table 1: Firm Size and Paperless Processes Overall
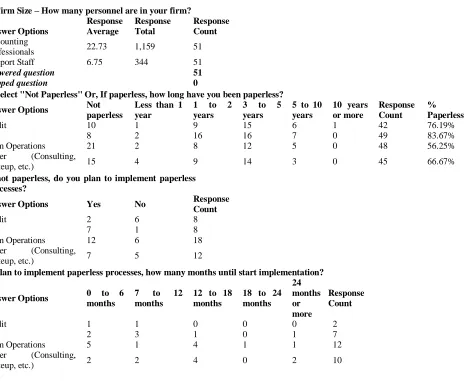
Of the 51 partners responding in general, the response count was lower for the specific areas of the practice than the overall response count in question 1. The missing responders either did not have that type of work in their practice or did not choose to respond to the particular part of question two. As reported in Table 1, tax was the highest area reported as paperless (84%), followed by audit, (76%), consulting (67%) and then firm operations (56%). These percentages are an overall report of whether the firm is paperless, but does not indicate level or degree of how paperless they really are. The benchmark study questions provide a useful tool for measuring the level or degree to which the firm is paperless.
3.1 Comparison of Local Survey Results to National Survey Benchmark Questions
The national survey had 30 questions divided into tax (9 questions), audit (6 questions), and operations, (15 questions). The operations questions included administration, practice management, communications, and technology questions. Answers for each question in the national benchmark survey which the local firms answered were categorical responses of: All, Most, Some, None, and Don’t Know. The results shown by the national survey summarized the results into Yes/No categories. Since the four category responses of the local firms do not match up with the Yes/No categories of national survey, the ―Yes‖ category included all and most. The ―No‖ category included some, none, and don’t know. The local results were categorized into yes/no in the same manner and then compared to the yes/no percentages from the national survey. The average results of all 30 questions for the national survey was 21 percent higher for national survey results compared to local results (66% yes to 45% yes).
1. Firm Size – How many personnel are in your firm?
Answer Options Response Average Response Total Response Count Accounting
Professionals 22.73 1,159 51
Support Staff 6.75 344 51
answered question 51
skipped question 0
2. Select "Not Paperless" Or, If paperless, how long have you been paperless?
Answer Options Not
paperless
Less than 1 year
1 to 2
years
3 to 5
years
5 to 10 years
10 years or more
Response Count
% Paperless
Audit 10 1 9 15 6 1 42 76.19%
Tax 8 2 16 16 7 0 49 83.67%
Firm Operations 21 2 8 12 5 0 48 56.25%
Other (Consulting,
writeup, etc.) 15 4 9 14 3 0 45 66.67%
If not paperless, do you plan to implement paperless processes?
Answer Options Yes No Response
Count
Audit 2 6 8
Tax 7 1 8
Firm Operations 12 6 18
Other (Consulting,
writeup, etc.) 7 5 12
If plan to implement paperless processes, how many months until start implementation?
Answer Options 0 to 6
months
7 to 12
months
12 to 18 months
18 to 24 months 24 months or more Response Count
Audit 1 1 0 0 0 2
Tax 2 3 1 0 1 7
Firm Operations 5 1 4 1 1 12
Other (Consulting,
The results and comparisons for the specific benchmark questions are included in Table 2 (Tax), Table 3 (Audit), and Table 4 (Operations). The detail category responses for each question are provided for the local survey results. The tables also show the ―yes‖ responses in terms of percentage to each question as well as the difference in percentage between the local and the national survey. The average percentages for yes responses and the corresponding average difference between larger and smaller firms is found at the end of each table for tax, audit, and operations. Before looking at the detailed responses for the benchmark questions, it is interesting to compare the percentage reported as paperless from question 2 in Table 1 for audit, tax, and firm operations to the averages of the questions answered with ―Yes‖ defined as including the categories ―All,‖―Most,‖ and ―Some‖ found in tables 2, 3, and 4. The average responses of the detail benchmark questions fall short of the percentages reported by the same firms as paperless in question 2 Table 1, (59% to 76% for audit, 71% to 84% for tax, and 64% to 56% for firm operations.) The national survey does not have any questions specific to consulting practice. This comparison result suggests the importance of firms using benchmark questions to determine what level or degree they really are paperless.
Table 2: Comparison of Local to National Survey Results—Tax Benchmarking Questions
Local Detail Responses
% Yes
Local (Includes
All and
Most)
Difference (Local minus National)
% Yes
National 1. Tax – Is the due date status of returns updated electronically by personnel in real time format (including managing the digital workflow of Tax documents)?
Answer Options Response Percent 73.9% 2.9% 71.0%
All 47.8%
Most 26.1%
Some 10.9%
None 10.9%
Don't Know 4.3%
2. Tax – Is your firm scanning the client supplied information for storage of Tax return supporting document?
Answer Options Response Percent 86.9% 0.9% 86.0%
All 80.4%
Most 6.5%
Some 8.7%
None 4.3%
Don't Know 0.0%
3. Tax – Does your firm scan client source documents (WS, 1099, etc.) at the front end of the process when the return is received and/or prior to review so they are utilized online?
Answer Options Response Percent 58.7% -6.3% 65.0%
All 45.7%
Most 13.0%
Some 8.7%
None 30.4%
Don't Know 2.2%
4. Tax – Does your firm primarily utilize administrative staff for scanning tax documents?
Answer Options Response Percent 58.7% -22.3% 81.0%
All 15.2%
Most 43.5%
Some 15.2%
None 26.1%
Don't Know 0.0%
5. Tax – Does your firm instruct its personnel to primarily utilize email for communicating with tax clients for additional information requests?
Answer Options Response Percent 41.3% -7.7% 49.0%
All 10.9%
Most 30.4%
Some 47.8%
None 8.7%
Table 2—Continued: Comparison of Local to National Survey Results—Tax Benchmarking Questions
Local Detail Responses
% Yes
Local (Includes
All and
Most)
Difference (Local minus National)
% Yes
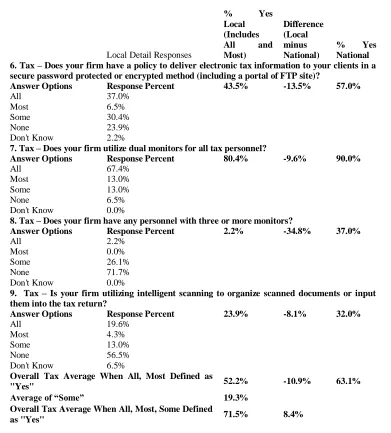
National 6. Tax – Does your firm have a policy to deliver electronic tax information to your clients in a secure password protected or encrypted method (including a portal of FTP site)?
Answer Options Response Percent 43.5% -13.5% 57.0%
All 37.0%
Most 6.5%
Some 30.4%
None 23.9%
Don't Know 2.2%
7. Tax – Does your firm utilize dual monitors for all tax personnel?
Answer Options Response Percent 80.4% -9.6% 90.0%
All 67.4%
Most 13.0%
Some 13.0%
None 6.5%
Don't Know 0.0%
8. Tax – Does your firm have any personnel with three or more monitors?
Answer Options Response Percent 2.2% -34.8% 37.0%
All 2.2%
Most 0.0%
Some 26.1%
None 71.7%
Don't Know 0.0%
9. Tax – Is your firm utilizing intelligent scanning to organize scanned documents or input them into the tax return?
Answer Options Response Percent 23.9% -8.1% 32.0%
All 19.6%
Most 4.3%
Some 13.0%
None 56.5%
Don't Know 6.5%
Overall Tax Average When All, Most Defined as
"Yes" 52.2% -10.9% 63.1%
Average of ―Some‖ 19.3%
Overall Tax Average When All, Most, Some Defined
Table 3: Comparison of Local to National Survey Results—Audit Benchmarking Questions
Local Detail Responses
% Yes
Local (Includes
All and
Most)
Difference (Local minus National)
% Yes
National 10. Audit – Are documents prepared by clients requested in an electronic format such as a PDF, spreadsheet or scanned image?
Answer Options Response Percent 50.0% -23.0% 73.0%
All 11.9%
Most 38.1%
Some 28.6%
None 14.3%
Don't Know 7.1%
11. Audit – Are all workpapers stored in a paperless audit application?
Answer Options Response Percent 68.3% -17.7% 86.0%
All 53.7%
Most 14.6%
Some 7.3%
None 12.2%
Don't Know 12.2%
12. Audit – Is your firm producing financial statements utilizing electronic links between the audit application and the reports, rather than re-keying data?
Answer Options Response Percent 59.0% -20.0% 79.0%
All 35.9%
Most 23.1%
Some 10.3%
None 17.9%
Don't Know 12.8%
13. Audit – Does your firm primarily link its audit applications to its tax application to digitally transfer trial balance information?
Answer Options Response Percent 31.7% -41.3% 73.0%
All 14.6%
Most 17.1%
Some 19.5%
None 36.6%
Don't Know 12.2%
14. Audit – Do your personnel working outside the office access firm application and information via a virtual private network or CITRIX/WTS more than 50% of the time?
Answer Options Response Percent 53.7% -9.3% 63.0%
All 31.7%
Most 22.0%
Some 14.6%
None 17.1%
Don't Know 14.6%
15. Audit – Do your auditors carry dual monitors in the field?
Answer Options Response Percent 2.5% -27.5% 30.0%
All 0.0%
Most 2.5%
Some 15.0%
None 72.5%
Don't Know 10.0%
Overall Audit Average When All, Most Defined as ―Yes‖
44.2% -23.1% 67.3%
Average ―Some‖ 15.2%
Overall Audit Average When All, Most, Some Defined
Table 4 Comparison of Local to National Survey Results—Firm Operations Benchmarking Questions
Local
Difference (Local minus
National) National
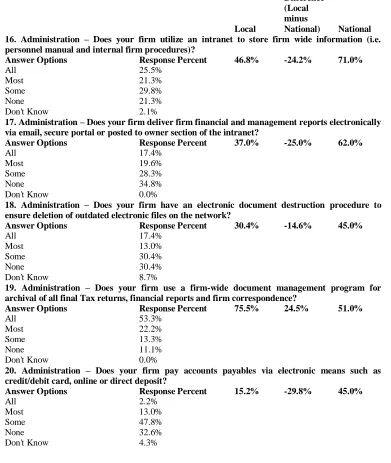
16. Administration – Does your firm utilize an intranet to store firm wide information (i.e. personnel manual and internal firm procedures)?
Answer Options Response Percent 46.8% -24.2% 71.0%
All 25.5%
Most 21.3%
Some 29.8%
None 21.3%
Don't Know 2.1%
17. Administration – Does your firm deliver firm financial and management reports electronically via email, secure portal or posted to owner section of the intranet?
Answer Options Response Percent 37.0% -25.0% 62.0%
All 17.4%
Most 19.6%
Some 28.3%
None 34.8%
Don't Know 0.0%
18. Administration – Does your firm have an electronic document destruction procedure to ensure deletion of outdated electronic files on the network?
Answer Options Response Percent 30.4% -14.6% 45.0%
All 17.4%
Most 13.0%
Some 30.4%
None 30.4%
Don't Know 8.7%
19. Administration – Does your firm use a firm-wide document management program for archival of all final Tax returns, financial reports and firm correspondence?
Answer Options Response Percent 75.5% 24.5% 51.0%
All 53.3%
Most 22.2%
Some 13.3%
None 11.1%
Don't Know 0.0%
20. Administration – Does your firm pay accounts payables via electronic means such as credit/debit card, online or direct deposit?
Answer Options Response Percent 15.2% -29.8% 45.0%
All 2.2%
Most 13.0%
Some 47.8%
None 32.6%
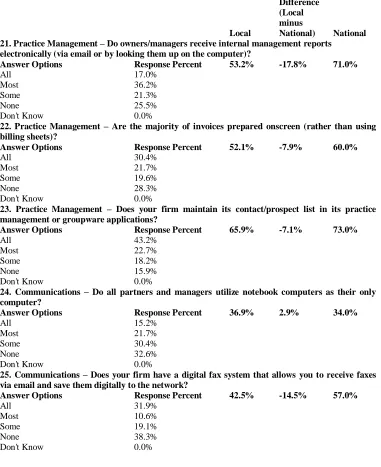
Table 4—Continued: Comparison of Local to National Survey Results—Firm Operations Benchmarking Questions
Local
Difference (Local minus
National) National
21. Practice Management – Do owners/managers receive internal management reports electronically (via email or by looking them up on the computer)?
Answer Options Response Percent 53.2% -17.8% 71.0%
All 17.0%
Most 36.2%
Some 21.3%
None 25.5%
Don't Know 0.0%
22. Practice Management – Are the majority of invoices prepared onscreen (rather than using billing sheets)?
Answer Options Response Percent 52.1% -7.9% 60.0%
All 30.4%
Most 21.7%
Some 19.6%
None 28.3%
Don't Know 0.0%
23. Practice Management – Does your firm maintain its contact/prospect list in its practice management or groupware applications?
Answer Options Response Percent 65.9% -7.1% 73.0%
All 43.2%
Most 22.7%
Some 18.2%
None 15.9%
Don't Know 0.0%
24. Communications – Do all partners and managers utilize notebook computers as their only computer?
Answer Options Response Percent 36.9% 2.9% 34.0%
All 15.2%
Most 21.7%
Some 30.4%
None 32.6%
Don't Know 0.0%
25. Communications – Does your firm have a digital fax system that allows you to receive faxes via email and save them digitally to the network?
Answer Options Response Percent 42.5% -14.5% 57.0%
All 31.9%
Most 10.6%
Some 19.1%
None 38.3%
Table 4—Continued: Comparison of Local to National Survey Results—Firm Operations Benchmarking Questions
Local
Difference (Local minus
National) National
26. Communications – Does your firm deliver client invoices by email or digital fax?
Answer Options Response Percent 10.9% -9.1% 20.0%
All 0.0%
Most 10.9%
Some 39.1%
None 50.0%
Don't Know 0.0%
27. Communications – Does your firm utilize a client portal/extranet to transfer and store client documents?
Answer Options Response Percent 15.2% -24.8% 40.0%
All 8.7%
Most 6.5%
Some 39.1%
None 43.5%
Don't Know 2.2%
28. Technology – Does your firm backup all firm data to the internet (web-based storage on at least a monthly basis?
Answer Options Response Percent 39.1% 7.1% 32.0%
All 30.4%
Most 8.7%
Some 4.3%
None 56.5%
Don't Know 0.0%
29. Technology – Does your firm utilize a SharePoint team server or Lotus Notes knowledge database?
Answer Options Response Percent 13.3% -9.7% 23.0%
All 11.1%
Most 2.2%
Some 6.7%
None 68.9%
Don't Know 11.1%
30. Technology – Do your personnel utilize smart phones for remote email, calendar, and contacts?
Answer Options Response Percent 42.5% -31.5% 74.0%
All 8.5%
Most 34.0%
Some 36.2%
None 21.3%
Don't Know 0.0%
Overall Admin Average When All, Most Defined as
―Yes‖ 38.4% -12.1% 50.5%
Average ―Some‖ 25.6%
Overall Admin Average When All, Most, Some Defined
as "Yes" 64.0% 13.5%
None of the six audit questions had the local results higher than the national firm results. Three of the operations questions (#19, #24, #28) showed the local survey results were higher than the results from the national survey. Question #19 about using a firm-wide document management software showed the local results about 24% higher than the national results.
4.
Conclusion and Limitations
The results of the survey of local/small firms compared to those of the national/large survey indicate that large firms engage a more paperless process than smaller firms in tax, audit and operations, with audit representing the largest difference. Both the national and local surveys show that accounting firms’ implementation of paperless processes is lowest in the area of firm operations. Although it may not be a surprise to find that smaller firms are not as paperless as larger firms, benchmarking to the smaller firms suggests that the local firms reporting themselves as paperless may not be as paperless to the degree they might think they are.
The national survey is administered every two years. The local survey results in this study were collected after the 2009 national survey and prior to the 2011 national survey, so the timing of the comparison is not exact. The local survey used the 2009 questions of the national survey. Each year some questions in the national survey are added or modified. Comparing those questions that were identical between the 2009 and 2011 surveys demonstrated that the results were not substantially different in the areas of tax and audit. In the area of firm operations, however, the national survey 2011 results revealed that paperless processes were used at about a seven percent higher ratethan in the 2009 results. This result increased the difference between local and national results from about 12 percentin 2009 to 19 percent for 2011. A limitation of this study is its exclusive use of members of the Utah Association of CPAs. Extendibility of results to firms elsewhere, therefore, may be compromised. Additional study with broader geographic representation would be useful.
This analysis is limited to a summary descriptive comparison of the local survey to the national survey results. A comparison using statistical analysis such as t-tests cannot be used to compare local survey results to the national survey results because the national results are given in percentages rather than individual firm survey result data. While survey results presented here measure and compare level of implementation for smaller firms versus larger firms, the results do not answer the question, ―Why is the percentage of small firms with paperless processes lower than big firms with paperless processes when technology makes it accessible to both?‖ One way this question may be answered would be a survey about costs and benefits of implementing and ongoing use of paperless processes for accounting firms. Such a survey may be useful in helping smaller firms’ management overcome their reluctance to take better advantage of the benefits of paperless processes.
References
AICPA. 2010. PCPS/TSCPA National MAP
Surveyhttp://www.aicpa.org/interestareas/privatecompaniespracticesection/resources/nationalmapsurvey/downloada
bledocuments/pcpstscpanationa%20mapsurveycommentary.pdf
Albrecht, M. (2009, July). Six Good Reasons to Go Paperless Today.Journal of Accountancy.
Davis, J. T. & Davis, H. T. (2004). Less is More—Paper and Profitability. Journal of Accounting and Finance
Research,Spring:33-38.
DeFelice, A. (2007). Paperless Payoffs: Rewards from Document Management Systems. Accounting Technology. June: 19-26.
Forum of Private Business.(2008, August 21). Top 10 Benefits a Paperless Office Can
Provide.http://www.fpb.org/hottips/303/Top_10_benefits_a_paperless_office_can_provide.htm
Graham, S. (2006, February 24). A Small Firm’s Approach to Competition – Go Paperless. Baltimore Business Journal.
Jennings, E. (2011, February 22). Crucial Best Practices on the Paperless Trail.Accounting Today.
Kepczyk, R. H. (2008, December). AAA 2009 Benchmarking Paperless Office Best Practices
Survey.http://xcentric.com/consulting-resources/aaa-2009-benchmarking-paperless-office-best-practices-survey
Kepczyk, R. H. (2010, December). AAA 2011 Benchmarking Paperless Office Best Practices Survey.
http://xcentric.com/wp-content/uploads/2011/05/Kepczyk-2011-Paperless-Benchmark-Survey-Results.pdf
Kepczyk, R. H. (2011). Quantum of Paperless—Partners Guide to Accounting Firm Optimization. Roman H. Kepczyk: Phoenix AZ 2011.
Manzelli, J. (2010, March). Toward a (More) Paperless Tax Practice.Journal of Accountancy.
Special Focus Report: Going Paperless--Digital Technology and how it is changing the way the world does business. (2011,