Energy Procedia 14 (2012) 304 – 311
1876-6102 © 2011 Published by Elsevier Ltd. Selection and/or peer-review under responsibility of the organizing committee of 2nd International
Conference on Advances in Energy Engineering (ICAEE).
doi:10.1016/j.egypro.2011.12.934
Available online at www.sciencedirect.com
Energy
Procedia
Energy Procedia 00 (2011) 000–000
www.elsevier.com/locate/procedia
Distribution Feeder Reconfiguration for Loss Minimization Based on
Modified Honey Bee Mating Optimization Algorithm
Javad Olamaei
a, Taher Niknam
b, sirous badali, Arefi
a,a
∗
a
Islamic Azad University, South Tehran Branch, Tehran, Iran.b
Department of Electrical Engineering, Shiraz University of Technology, Shiraz, Iran.
Abstract
This paper presents an efficient algorithm for multi-objective distribution feeder reconfiguration based on Modified Honey Bee
Mating Optimization (MHBMO) approach. The main objective of the Distribution feeder reconfiguration (DFR) is to minimize the
real power loss, deviation of the nodes’ voltage. Because of the fact that the objectives are different and no commensurable, it is
difficult to solve the problem by conventional approaches that may optimize a single objective. So the metahuristic algorithm has
been applied to this problem. This paper describes the full algorithm to Objective functions paid, The results of simulations on a 32
bus distribution system is given and shown high accuracy and optimize the proposed algorithm in power loss minimization.
.
.
Keywords: Distribution feeder reconfiguration (DFR), Modified honey bee mating optimization (MHBMO), Multi-objectives distribution feeder reconfiguration (MDFR);
1.
Introduction
Distribution systems usually open ring design and operation as are radial. If all keys are closed, the network losses will be minimal.
But due to the complexity and high level of protection short circuit if it does not work. In these systems there are two types of
switches; sectionalizing-switches (normally closed) and tie-switches (normally open). The configuration of the distribution system
is changed by opening sectionalizing switches and closing tie switches so that the radial structure of the network is maintained and
all of the loads are supported, and reduced power losses and improve power quality and increase system security.Distribution feeder
reconfiguration (DFR) is a complex nonlinear combinatorial problem since the status of the switches is non-differentiable.
Therefore, most of the algorithms in the literature are based on heuristic search techniques, which use either analytical or
knowledge-based engines. Generally, DFR is defined as altering the topological structure of the distribution feeders by changing the
open/close states of sectionalizing and tie switches so that the objective function is minimized and the constraints are met.
One of the first papers on this topic was presented by Merlin and Back
[1]
. Civanlar et al. introduced a simple innovative method
for calculating the loss through the network reconfiguration [2]. Shirmohammadi and Hong presented the use of the power flow
method based on a heuristic algorithm to determine the minimum loss configuration for radial distribution networks
[3, 5]
. Baran
and Wu modeled the problem of loss reduction and load balancing as an integer programming problem
[4]
. Nara et al. have
presented an implementation using a genetic algorithm to look for the minimum loss configuration
[6]
. Chiang and Rene proposed a
solution procedure which used simulated annealing to search for an acceptable non inferior solution
[7, 8]
. Goswami and Basu
introduced a power-flow-minimum heuristic algorithm for distribution feeder reconfiguration [9]. Vanderson Gomes et al. proposed
a heuristic strategy for reconfiguration of distribution systems [10]. Lopez presented an approach for online reconfiguration [11].
Das proposed a fuzzy multi-objective approach to solve the network reconfiguration problem
[12]
. Niknam et al. presented an
efficient hybrid algorithm for multi-objective distribution feeder reconfiguration based on Honey Bee Mating Optimization
(HBMO) and fuzzy multi-objective approach [13].
Olamaei et al. proposed a cost based on compensation methodology for
distribution feeder reconfiguration considering distributed generators [17-19]. Niknam et al. presented an efficient multi-objective
modified shuffled frog leaping algorithm that has been used to solve MDFR problem [16].
The present work considers the network reconfiguration problem as a multi-objectives distribution feeder reconfiguration
(MDFR), problem subject to operational and electric constraints. The problem formulation proposed here in considers two
different objectives related to:
•
Minimizing of the power losses;
∗ Corresponding author. Telfax.: 00982188653923. E-mail address:[email protected]
2
•
Minimizing the deviation of the bus voltage;
2. Problem Formulation
This section proposes two objective functions for the network reconfiguration problem [22–24].
2.1. objective functions
As mentioned before, the proposed DFR problem has the following objectives:
2.2. Minimization of the power losses:
The minimization of the total real power losses arising from feeders can be calculated as follows:
)
1
(
[
Tie Tie TieNtie Sw Sw SwNtie]
X
i I br N
i Ri x f
,..., 2 , 1 , ,..., 2 , 1
2 1 ) ( 1
=
× ∑ = =
where
R
i
and
Ii
are resistance and actual current of the
i
ihbranch, respectively
.
N
br
is the number of the branches. X is the
control variables vector.
T
iei
is the state of the
i
ih tie switch (0 = open and 1=close).S
wi
is the sectionalizing switch number that
forms a loop with
T
iei
.
N
tie
is the number of the tie switches.
2.1.2) Minimizing the deviation of the bus voltage:
Bus voltage is one the most significant security and service quality indices, which can be described as follows:
)
2
(
bus N i
rate V i V i x
f2( )= max − , =1,2,3,....,
where
N
bus
is total number of the buses
.
Vi
and
V
rate
are the real and rated voltages on the
i
ihbus, respectively
.
3.
Original HBMO Algorithm
The honey bee is a social insect that can survive only as a member of a community, or colony. The colony inhabits an enclosed
cavity. A honey-bee colony typically consists of a single egg laying long-lived queen, anywhere from zero to several thousand
drones (depending on the season) and usually 10,000 to 60,000 workers. Queens are specialized in egg laying[39].
The HBMO Algorithm combines a number of different procedures [35-37]. Each of them corresponds to a different phase of the
mating process of the honey bee. A drone mates with a queen probabilistically using an annealing function as follows:
)
3
(
))
(
/
)
(
exp(
)
(
Pr
ob
D
=
−
Δ
f
S
t
where
Prob(D)
is the probability of adding the sperm of drone
D
to the sperm theca of the queen,
Δ
(
f
)
is the absolute difference
between the fitness of
D
and the fitness of the queen and
S(t)
is the speed of the queen at time t. It is apparent that this function acts
as an annealing function, where the probability of mating is high when either the queen is still in the start of her mating–flight and
therefore her speed is high, or when the fitness of the drone is as good as the queen's. After each transition in space, the queen’s
speed,
S
(
t
), and energy,
E
(
t
), decay using the following equations:
S
(
t
+ 1) =
α
×
S
(
t
) (4)
E
(
t
+ 1) =
E
(
t
) −
γ
(5)
where
α
is a factor
∈
(0,1) and is the amount of speed and energy reduction after each transition and each step.
Initially, the speed of the queen is generated at random. A number of mating flights are realized. Thus, an Honey-Bees Mating
Optimization (HBMO) algorithm may be constructed with the following five main stages [38]:
1. The algorithm starts with the mating–flight, where a queen (best solution) selects drones probabilistically to form the sperm theca
(list of drones). A drone is then selected from the list at random for the creation of broods.
2. Creation of new broods (trial solutions) by crossover ring the drones’ genotypes with the queen’s.
3. Use of workers (heuristics) to conduct local search on broods (trial solutions).
4. Adaptation of workers’ fitness based on the amount of improvement achieved on broods.
5. Replacement of weaker queens by fitter broods.
3
Figure1. The HBMO algorithm
4. Solution of Multi-objective Distribution Feeder Reconfiguration
To apply the proposed algorithm in the distribution feeder reconfiguration problem, the following steps have to be taken [13,20]:
Step 1: Define the input data:
In this step, the input data including the network configuration, line impedance and status of switches, the speed of queen at the
start of a mating flight (
S
max), the speed of queen at the end of a mating flight (S
min),
the speed reduction schema (
α
), the number
of iteration, the number of workers (
N
Worker),
the number of drones (
N
Dreone), the size of the queen's sperm theca (N
Sperm) and thenumber of broods (
N
Brood) are defined.Step 2: Transfer the constraint optimization problem to an unconstraint one.
Step 3: Generate an initial population:
In this step, an initial population based on state variable is generated, randomly. That is formulated as:
[
]
[
Tie
Tie
Tie
N
tie
]
i
N
Drone
X
Drone
N
X
X
X
Drone
,..., 3 , 2 , 1 2 1 2 1,...,
,
...
=
=
=
(6)Step 4: Calculate the objective function value by using results of the distribution load flow.
Step 5: Sort the initial population based on the objective function values.
Step 6: Select the queen:
The individual
(Xbest)
that has the maximum objective function should be considered as the queen.
Step 7: Generate the queen speed:
The queen speed is randomly generated as:
min min
max
)
(
(.)
S
S
S
rand
queen
S
=
×
−
+
(7)
where
rand(.)
is a random function generator.
Step 8: Select the population of the drones:
The population of drones is selected from the sorted initial population as:
[
]
Drone N i tie N Sw Sw Sw tie N Tie Tie Tie i DD DroneN D D Population Drone ,..., 3 , 2 , 1 ,..., 2 , 1 , ,..., 2 , 1 2 1 _ = = =
⎥
⎥
⎥
⎥
⎦
⎤
⎢
⎢
⎢
⎢
⎣
⎡
(8)
Where
D
iis the
i
thdrone.
Step 9: Generate the queen’s sperm theca matrix (Mating flight):
At the start of the mating flight, the queen flies with her maximum speed. A drone is randomly selected from the population of
drones. The mating probability is calculated based on the objective function values of the queen and the selected drone. A number
between 0 and 1 is randomly generated and compared with the calculated probability. If it is less than the calculated probability, the
drone’s sperm is sorted in the queen’s sperm theca and the queen speed is decreased. Otherwise, the queen speed is decreased and
another drone from the population of drones is selected until the speed of the queen reaches to her minimum speed or the queen’s
sperm theca is full:
Select a Drone at Random
Mat Replace the queen if the best brood is better than the queen.
Apply Local Search
Selected Best Brood
List of Drones
4
[ ]
[
]
Sperm N i tie N Sw Sw Sw tie N Tie Tie Tie n j s i Sp Sperm N Sp Sp Sp matrix ca Spermacthe ,..., 3 , 2 ,1 ,..., 2 , 1 , ,..., 2 , 1 1 ... 2 1 _ = = × = =⎥
⎥
⎥
⎥
⎥
⎦
⎤
⎢
⎢
⎢
⎢
⎢
⎣
⎡
(9)
where
Spi
is the
i
thindividual in the queen’s sperm theca.
Step 10: Breeding process:
In this step, a population of broods is generated based on mating between the queen and the drones stored in the queen’s sperm
theca. The
i
thindividual is generated as:
[
]
[
]
(
)
(
Xbest βXbest Spi)
,j 1,2,3,...,NBrood round j Brood n is is i s i Sp n best x best x best x best X = − + = = = . ... 2 1 .... 2 1 (10)where
β
is a random number between 0 and 1. Brood j is the
j
thbrood.
Step 11: Feeding selected broods and queen with the royal jelly by workers:
The population of broods is improved by applying different heuristic functions and mutation operators as follows:At first the
i
thbrood is randomly selected. Two integer numbers (
B1
and
B2
) between 1 and
n
are randomly generated. It is assumed
B1 < B2
. The
brood is changed and improved as below:
(
)
ker ,...., 3 , 2 , 1 2 ) ( ) ( 2 1 , min min max (.) ) ( 1 ) ( ) ( Wor N i B j if j i Brood j i Brood B J B if j x j x j x rand j i Brood B j if j i Brood j i Brood = > = ≤ ≤ + − × = < =(11)
where
x
maxjand
x
minjare the maximum and minimum values of the j
thstate variables, respectively.
Step 12: Calculate the objective function value for the new generated solutions.
Step 13: Check the termination criteria:
If the termination criteria satisfied finish the algorithm, else discard all previous trial solutions and go to step 3 until convergence
criteria met.
5. Modified Honey Bee Mating Optimization (MHBMO) Algorithm
J. Olamaei ,s.badali/ Energy Procedia 00 (2011) 000–000
5
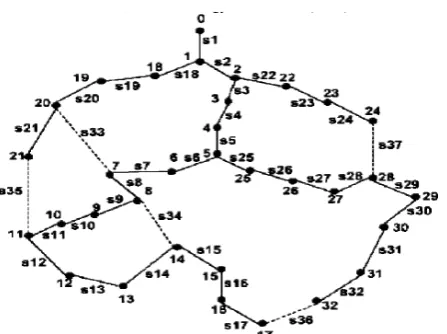
Figure 2. A single line diagram of Baran and Wu distribution test system.
Table 1.Differences between the original and Modified HBMO algorithms
Modified HBMO HBMO
Defination ID
Queen feeding has been added after its generation by using some heuristic functions as workers.
There is not a certain step for queen feeding after generating the population and selecting the best solution as Queen.
Improvement of the best solution (Queen feeding).
1
Linear factor with initial value of 1 and linear reduction till zero. Technically, this reduction factor (
α
) is the number of successful parent nominations (mating flight and adding a drone’s sperm into sperm theca) over the size of mating pool (sperm theca).Constant factor e (0,1). Temperature (Queen’s speed)
reduction factor (
α
).2
Breeding would be done first using crossover functions and afterwards mutation functions are applied for broods feeding.
These two steps are done by using the crossover and mutation functions simultaneously. Crossover (breeding) and
mutation (broods feeding).
3
Number and type of heuristic functions are improved. The best scheme is selected after conducting sensitivity analysis.
6 heuristic functions are used for local search (broods feeding).
Heuristic functions (workers) Application.
4
These allocated spaces from the population (hive) are determined relatively based on the amount of improvement which is produced by heuristic functions.
Allocated space to heuristic functions in updating process is determined based on functions ranking. Considering multipliers of 10. Apparently, the better function quality, the more allocated space.
Heuristic functions (workers) Updating.
5
At first, total active power losses, the number of switching operations and the voltage deviation of the buses are separately
optimized to find the extreme points of the trade-off front. The best results obtained by optimizing the first and the Second
objectives separately are shown in Tables (2) and (3), respectively. The results shown change in the status of the tie and
sectionalizing switches. In Table (2) the best results obtained by optimizing the first objective of the proposed algorithm have been
shown, and it is obvious that the solution obtained by the proposed algorithm is better than the others. In Table (3) the best results
obtained by optimizing the first objective of the proposed algorithm are compared with other studies. As shown in the Tables (2)
and(3), the algorithm is capable of finding the best solutions for each objective function in power loss minimization. According to
Tables (2) and (3), the best solutions obtained by minimizing power losses and voltage deviation separately are not the same, hence
despite saying these objective are not different; in these tables (Tables 2 and 3) it has been shown that in some solutions these
objectives are not commensurable. Also in most references, ‘‘Deviation of the node’s voltage’’ and ‘‘real power loss’’ are
considered as two objective functions.
Table 2. Results obtained by optimizing the total real power losses. Method Power losses
(Kw) Loss reduction (%) Minimum voltage (p.u) Open switches
Optimum [10] 139.53 31.14 0.93781964 s7, s9, s14, s32, s37
Goswami [9] 139.53 31.14 0.93781964 s7, s9, s14, s32, s37
MeDemott [24] 139.53 31.14 0.93781964 s7, s9, s14, s32, s37
Shirmohammadi [3] 140.26 30.78 0.93781964 s7, s10, s14, s32, s37
Vanderson Gomes [10] 139.53 31.14 0.93781964 s7, s9, s14, s32, s37
DPSO-HBMO [22] 139.53 31.14 0.93781964 s7, s9, s14, s32, s37
DPSO [20] 139.53 31.14 0.93781964 s7, s9, s14, s32, s37
PSO-ACO [20] 139.53 31.14 0.93781964 s7, s9, s14, s32, s37
DPSO-ACO [21] 139.53 31.14 0.93781964 s7, s9, s14, s32, s37
HBMO [13] 139.53 31.14 0.93781964 s7, s9, s14, s32, s37
MMSFL[16] 139.53 31.14 0.93781964 s7, s9, s14, s32, s37
Table 3. Results obtained by optimizing the voltage deviation of the buses. Method Minimum deviation
of the bus voltage Minimum voltage (p.u) Power losses (kW) Open switches DPSO-HBMO [22] 0.061203 0.9387968 142.80820 s6, s9, s14, s32, s37 DPSO [20] 0.061203 0.9387968 142.80820 s6, s9, s14, s32, s37 PSO-ACO [20] 0.061203 0.9387968 142.80820 s6, s9, s14, s32, s37 DPSO-ACO [21] 0.061203 0.9387968 142.80820 s6, s9, s14, s32, s37 HBMO [13] 0.061203 0.9387968 142.80820 s6, s9, s14, s32, s37 MMSFL[16] 0.054261 0.9457390 140.06828 s7, s9, s14, s32, s28
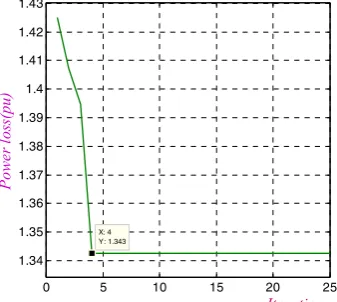
The proposed algorithm 0.057838 0.9421622 135.95491 s7, s9, s14, s28, s36
As Figure (3) Shows, after the 5 repeat (4iteration) the above algorithm to optimal response is achieved. The high accuracy and
speed in the optimization algorithm shows:
0 5 10 15 20 25
1.34 1.35 1.36 1.37 1.38 1.39 1.4 1.41 1.42 1.43
X: 4 Y: 1.343
Iteration
Po
we
r l
os
s(
pu)
Figure 3. Diagram out put real power loss test system
6. Conclusion
In this paper, an modified honey bee mating optimization (MHBMO) algorithm, make-up distribution network for reconfiguration
32 Bus samples (Baran and Wu distribution test system) used, and simulations. The results show that the above algorithm for real
power loss minimization to be the most effective and efficient. Because optimization algorithms based on search work, Can be
shown that the new arrangement, which can reduce real power loss much better results and optimal response is achieved.The
simulation results shown that global or close to global optimum solutions for the system losses, than the other algorithms
respectively attained.
7. References
[1].Merlin A, Back H. ‘Search for a minimal-loss operating spanning tree configuration in an urban power distribution system’. Proc. 5th Power System Computation Conf., Cambridge (U.K.), 1975; 1–18.
[2]. Civanlar S, Grainger JJ, Yin. H, Lee SSH. "Distribution feeder reconfiguration for loss reduction. IEEE Transactions on Power Delivery 1988; 3(3):1217–1223.
[3]. Shirmohammadi D, Hong HW. Reconfiguration of electric distribution networks for resistive line loss reduction. IEEE Transactions on Power Systems 1989; 4(1):1492–1498.
[4]. Baran ME, Wu FF. Network reconfiguration in distribution systems for loss reduction and load balancing. IEEE Transactions on Power Delivery 1989; 4(2):1401–1407.
[5]. Zhou Q, Shirmohammadi D, Liu WHE. Distribution feeder reconfiguration for service restoration and load balancing. IEEE Transactions on Power Systems 1997; 12(2):724–729.
[6]. Nara, K., A. Shiose, M. Kitagawoa and T. Ishihara,1992. “Implementation of genetic algorithm for distribution systems loss minimum reconfi -guration,” IEEE Trans. Power Syst., 7(3):1044-1051.
[7]. Chiang HD, Rene JJ. Optimal network reconfiguration in distribution systems:Part 1: A new formulation and a solution methodology. IEEE Trans Power Delivery 1990;5(4):1902–8
[8]. Chiang HD, Rene JJ. Optimal network reconfiguration in distribution systems:Part 2: Solution algorithms and numerical results. IEEE Trans Power Delivery.1990;5(3):1568–74.
7
[10]. Vanderson Gomes F, Carneiro S, Pereira JLR, Garcia Mpvpan, Ramos Araujo L. A new heuristic reconfiguration algorithm for large distribution systems. IEEE Transactions on Power systems 2005; 20(3):1373–1378.
[11]. Lopez E. h. OpasoOnline reconfiguration considering variability demand: Applications to real networks. IEEE Transactions on Power Systems 2004; 19(1):549–553.
[12]. Das D. A fuzzy multi-objective approach for network reconfiguration of distribution systems. IEEE Transactions on Power Delivery 2006; 21(1): 202–209.
[13]. Niknam T, Olamaie J, Khorshidi R. A Hybrid Algorithm Based on HBMO and Fuzzy Set for Multi-Objective Distribution Feeder Reconfigur- ation. Science China Technological Science 2008; 4(2):308–315.
[14]. Niknam T, Azad Farsani E. A hybrid evolutionary algorithm for distribution feeder reconfiguration. Science China Technology Science 2010; 53:950–959.
[15]. Niknam T, Azad Farsani E. A hybrid self-adaptive particle swarm optimization and modified shuffled frog leaping algorithm for distribution feeder reconfiguration. Engineering Applications of Artificial Intelligence. 2010. DOI:10.1016/j.engappai.2010.02.005.
[16].Taher Niknam*,y, Ehsan Azad farsani and Majid Nayeripour. An efficient multi-objective modified shuffled frog leaping algorithm for distribution feeder reconfiguration problem.2010. DOI: 10.1002/ etep. 473.
[17]. Olamaei J, Niknam T, Gharehpetian G. Application of particle swarm optimization for distribution feeder reconfiguration considering distributed generators. Applied Mathematics and Computation journal 2008; 201(11–12):575–586.
[18]. Olamaei J, Niknam T, Gharehpetian G. ‘Impact of distributed generators on distribution feeder reconfiguration’,IEEE PowerTech Conference, Switzerland, 2007; 1747–1751.
[19]. Olamaei, J., T. Niknam and G. Gharehpetian.“An approach based on ant colony optimization for distribution feeder reconfiguration considering distributed generators”19th International Conference on Electricity Distribution, 2007, Vienna.
[20]. Niknam T. ‘An efficient hybrid evolutionary based on PSO and ACO algorithms for distribution feeder reconfiguration.European Transaction on Electrical Power 2009 (in press). DOI: 10,1002/etep.339
[21]. Niknam T. A new hybrid algorithm based on DPSO and ACO algorithms for multi-objective Distribution Feeder Reconfiguration . Energy Conversion and Management 2009; 50(8) :2074–2082.
[22]. Niknam T. A new hybrid algorithm based on DPSO and HBMO algorithms for multi-objective Distribution Feeder Reconfiguration . Cybernetics and Systems:An International Journal 2009; 40(6):508–527.
[23]. Chiou J, Chang C. Variable scaling hybrid differential evaluation for solving network reconfiguration of distribution system. IEEE Transactions on Power Systems 2005; 20(2):668–674.
[24]. Ching-Tzong Su., Chu-sheng Lee. Network reconfiguration of distribution systems using improved mixed-integer hybrid differential evolution. IEEE Transactions on power 2003; 18(3):1022–1027.
[25]. Ahuja A, Das S, Pahwa A. An AIS-ACO hybrid approach for multi-objective distribution system reconfiguration.IEEE Transactions on Power Systems 2007; 22(3):1101–1111.
[26]. Liu. L, Chen. X. Reconfiguration of distribution networks based on fuzzy genetic algorithms. Proceedings of the CSEE (in Chinese) 2000; 20:66–69.
[27]. Bi. P, Liu. J, Liu. C. A refined genetic algorithm for power distribution network reconfiguration. Automation of Electric Power Systems (in Chinese) 2002; 26:57–61.
[28]. Zhenkun Li, Xingying Chen, Kun Yu. Yi Sun, Haoming Liu. A hybrid particle swarm optimization approach for Distribution Network reconfiguration problem. IEEE Power and Energy Society General Meeting 2007; 1–7.
[29]. Jianming Yu., Fan Zhang, Feng Ni., Yuanshe Ma. Improved genetic algorithm with infeasible solution disposing of distribution network reconfiguration. IEEE Intelligent System 2009; 2:48–52.
[30]. Lin. CM, Gen. M. Multi-criteria human resource allocation for solving multistage combinatorial optimization problems using multiobjective hybrid genetic algorithm. Expert Systems with Applications 2008; 34(4) :2480–2490.
[31]. Chang PC, Chen. SH, Liu. CH. Sub-population genetic algorithm with mining gene structures for multiobjective flowshop scheduling problems. Expert Systems with Applications 2007; 33(3):762–771.
[32]. Eusuff M, Lansey K. Optimization of water distribution network design using the shuffled frog leaping algorithm.Journal of Water Resources Planning and Management 2003; 129(2):10–25.
[33]). Xuncai Zhang., Xuemei Hu., Guangzhao Cui., Yanfeng Wang., Ying Niu. An improved shuffled frog leaping algorithm with cognitive behavior. IEEE Intelligent Control and Automation’ 2008; 6197–6202.
[34]. Su. CT, Lee. CS. Network reconfiguration of distribution systems using improved mixed-integer hybrid differential evolution. IEEE Transactions on Power Delivery 2003; 18(3):1022–1027.
[35]. Afshar, A., O. Bozog Haddad, M.A. Marino and B.J. Adams, 2007. Honey-bee mating optimization (HBMO) algorithm for optimal reservoir operation,Journal of the Franklin Institute, pp: 452-462.
[36]. Fathian, M., B. Amiri and A. Maroosi, 2007.Application of honey bee mating optimization algorithm on clustering, Applied Mathematics and Computation, 190: 1502-1513.
8
[38]. Babak Amiri and Mohammad Fathian 2007, Integration Of Self Organizing Feature Mapsand Honey bee mating optimization Algorithm For Market Segmention, 70-76.