6 Copyright © 2011-15. Vandana Publications. All Rights Reserved.
Volume-5, Issue-1, February-2015 International Journal of Engineering and Management Research Page Number: 06-10
Return & Risk Analysis of Selected Sector Specific Mutual Funds in India
Arti Sharma
Research Scholar, Department Of Commerce, S.S.J Campus, Kumaun University, Almora
ABSTRACT
Sector funds are industry specific funds which invest money in a particular sector of economy such as banking, healthcare, real estate, technology, transportation, etc. These funds provide diversification within a particular sector. They provide stable returns than equity shares. Therefore investing in sector fund is less risky than that in equity shares. But there returnability is more volatile than diversified equity mutual funds. The present study is based on analyzing the performance of some selected Indian sector fund schemes in terms of risk and return. In this paper Compound Annualized return, Standard Deviation, Beta, Alpha and R-Squared are determined for last five year period.
Keywords--- Diversification, returns, Compound
annualized return, standard deviation, Beta, alpha, performance, risk return relationship.
I.
INTRODUCTION
Sector fund is a mutual fund that invests in a specific industrial sector of the economy, such as energy, utilities, real estate, financial funds, pharma and healthcare, etc. Sector funds come in many different flavors and can vary substantially in market capitalization, investment objective (i.e. growth and/or income) and class of securities within the portfolio. Sector funds are designed to provide market participation for investors whose portfolios lack exposure in a given sector. They can also provide a greater measure of diversification within a given sector than may be otherwise possible. The main reason that an investor would want to consider a sector fund is the same as for a particular individual stock: the investor feels that the sector is about to experience a period of strong growth. Instead of investing directly in the stock of a company that has just released a revolutionary new
technology, the investor could consider allocating assets to a technology fund that holds that company's stock in its portfolio. Sector funds can also serve to hedge
Fama (1972) advocated a different measure of
portfolio performance. He proposed that overall portfolio performance has two components first the performance due to stock selection ability of the fund manager and a portfolio, as some sectors tend to move opposite the economy as a whole. Sector funds are appropriate for aggressive investors seeking exposure within either an entire sector of the economy or a specific subsection thereof. Overexposure to any given sector of the market can subject investors to undue risk and volatility, and appropriate measures should be taken to avoid this.
II.
LITERATURE REVIEW
Treynor (1965) and Sharpe (1966) presented the conceptual framework of relative measure of performance of equity mutual funds performance. Treynor (1965) established a way to measure the performance of the
portfolio, known as Reward to Volatility ratio which is
describe as the average portfolio excess return. It was
followed by Sharpe (1966) who developed a Reward to
Variability Measure which refers to the average portfolio excess return divided by the portfolio standard deviation. Treynor evaluated systematic risk whereas Sharpe employed overall risk to evaluate the portfolio performance of mutual fund. Both Treynor's and Sharpe’s measure of portfolio performance is relative measure that ranks the funds in terms of risk and return.
Jensen (1968) developed an absolute measure of performance based on the Capital Asset Pricing Model and concluded that mutual funds were not able to gain
abnormal return when the transaction costs were included
7 Copyright © 2011-15. Vandana Publications. All Rights Reserved. second the performance due to higher portfolio risk
assumed by the fund manager.
Fredman (1996) recommended that the risk is
measured in terms of the variation or volatility of the net asset value of funds. The more extreme the variations in aggregate value of the assets of the fund over a period, the greater is the volatility or risk. He described standard deviation as the most perceptive and reliable indicator of determining volatility or risk.
Gruber (1996) reported that an average mutual fund had negative performance compared to the market and provided evidence to support the persistence of performance. It resolved the puzzle that sophisticated clientele withdrew money from mutual funds in the event of poor performance whereas they attracted money from disadvantaged clientele under such circumstances.
Khorana and Nelling (1997) analyzed the
performance of 147 sector funds on the period 1976-1992. According to their study, Sector funds perform better than sector indexes but less well than diversified indexes. They reveal high peculiar and low systematic risk. The comparison of sector funds with equity funds is confusing. If the benchmark is the S&P 500, sector funds underperform equity funds but outperform sector index. The authors conclude that sector funds perform globally on a risk-adjusted basis.
O Neal (2000) observed the return of 31 fidelity sector funds over a 10 year period. He found that industry momentum is present in the highest performing sector funds and majority of high performing sector funds outperform the market portfolio. It is reasonable to assume that sector fund manager outperform general mutual fund managers.
Narasimhan.M.S and Vijayalakshmi.S (2001) evaluated the performance of the Mutual
Funds in terms of achieving diversification benefit and fund manager’s timing ability.
The study found that there was a general shift in the investment strategy of holding a diversified portfolio and in optimizing the risk-returns of investments to invest in predictive winners of the period.
Eakins and Stansell (2004) examined whether an investment strategy based on using the prior performance of sector funds to direct future investments can give superior risk-adjusted performance. Most momentum research had been oriented towards individual stocks. A few studies have came across the momentum in industries. They further investigated whether sector funds capture the success reported using momentum strategies on industry groups. They observe momentum in sector funds over 1995-2001 verifying O’Neal’s (2000) evidence of profitable momentum trading strategies.
Nicolas P.B. Bollen and Jeffrey A. Busse (2004) examined the issue of determination in mutual fund
performance emphasizing short measurement period in their article entitled “Short-Term Persistence in Mutual Fund Performance”. The authors have suggested that misspecification of the performance model was not driving the results. The results found no evidence of ability using the concentrated returns and isolate a negative long-term relation between factor loadings and factor returns as the source of the difference between the results of different
horizons.
Tiwari and Vijh (2004) analyzed sector fund cash flow and find that volatility does not significantly impact sector fund performance in spite of the fact that these fund have higher cash flow volatility.
Abhay Kaushik in 2010 in his research found that Sector funds reveal positive timing ability during recessions and negative timing ability during expansions when using the S&P 500 as the benchmark, but this timing ability disappears when sector specific benchmarks are used. As a whole, sector funds exhibit significant negative timing ability across all stages of the business cycle. When using the more appropriate industry specific benchmarks, only the utility sector demonstrates significant timing ability over both stages of the business cycle.
Bodie, Kane and Marcus (2010) define portfolio performance attribution. In this study stock selection is broken down into two categories: sector allocation and security selection. In this study, asset allocation is at least 80% equity which makes asset allocation a very minor portion of the return. The excess return is then attributed to either sector allocation or security selection. Since the sector weights of the Fidelity simulated portfolios are identical to the weights of the multi-sector equity fund portfolios, this leaves security selection as the sole determinant of outperformance. Therefore, if the Fidelity simulated portfolios outperform the multi-sector equity fund portfolios, it is likely that sector fund managers have superior stock selection ability.
III.
OBJECTIVES
1. To measure the five years compounded annual growth return given by the selected funds.
2. To analyze risk associated with selected sector funds . 3. To measure the risk return relationship of selected sector fund schemes.
4. To determine the correlation between selected sector Funds’ return and benchmarks’ return.
IV.
RESEARCH METHODOLOGY
8 Copyright © 2011-15. Vandana Publications. All Rights Reserved. relevant data has collected from, valueresearchonline.com,
mutualfundindia.com as on 27th December 2014. The
present study analyses the performance of top ten performing sector funds for last five years. (2009- 2014). Some mathematical and some statistical tools have been taken into consideration for analysis. In this study Compound Annualized Growth Rate of Return, arithmetic mean, percentage, standard deviation , Beta , Alpha , Sharpe ratio and R-Squared have been applied.
iii) ANALYSIS
1. Performance of 10 top performing sector funds in terms of last 5 years return:
TABLE 1: Five Compound Annualised Growth returns of Top 10 sector funds
From table-1 it is clear that UTI transportation & logistic fund has yielded highest return (29.14%). Although SBI FMCG fund (28.33%) and SBI pharma fund (26.68%) are another better performing funds after UTI transportation & logistic fund. It is clearly visible from this table that all the sector fund schemes yield more than 20% return.
2. Risk Analysis of sector funds:
2.1.Standard Deviation: Standard Deviation is the measure of total risk. It is used to measure the variation in returns from the expected returns. Higher value of standard deviation shows high volatility and high risk.
2.2Beta coefficient: It is the measure of the volatility, or systematic risk, of a security or a portfolio in comparison to the market as a whole. Beta is used in the capital asset pricing model (CAPM), a model that calculates the expected return of an asset based on its beta and expected market returns.
2.3 Alpha: Size of Alpha shows stock’s unsystematic risk and it is the average independence of market return. Positive value of alpha shows that fund manager produces
return greater than expected for the risk taken. .
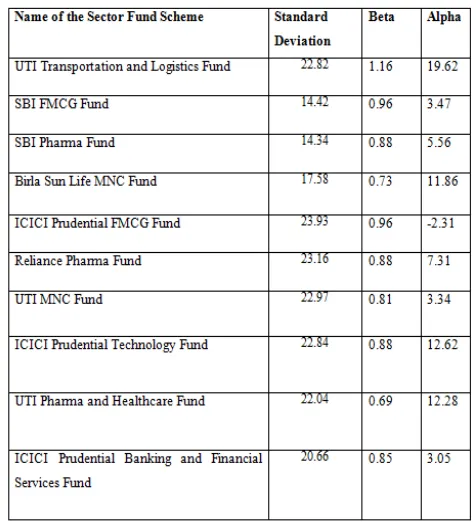
TABLE 2 : Standard deviation, beta and alpha of Top 10 performing sector funds
As it is depicted in table 2, ICICI Prudential FMCG (23.93) has highest value of standard deviation, which means that this fund is the most risky. Although, Reliance Pharma (23.16), UTI MNC fund (22.97), UTI transport & logistic fund (22.82) are the funds with higher risk, Birla Sun Life MNC fund( 17.58), SBI Pharma fund (14.34).
It is clear from the third column of table 2 that
of β (1.16), which means this fund covaries the most with
respect to the market return. Except all other sector funds in the table has β value less than one, which implies that these sector funds have low volatility with respect to market return.
It is also obvious from the fourth column of table 2 that
value of α (19.62). It implies that this sector fund provides highest excess return that the portfolio generates over its
expected return.(α =
12.62), (α = 12.28),
(α = 11.86) are next best
performing sector funds in terms of alpha. Whereas
(α = - 2.31) has negative value of
9 Copyright © 2011-15. Vandana Publications. All Rights Reserved.
3. Risk Return Analysis:
3.1 Sharpe Ratio: Sharpe Ratio is the measure of risk
premium of portfolio . It shows the risk & return of the portfolio in one measure. It is also known as reward to variability ratio. It means how much an investment would yield for the risk taken. This is the ratio of risk premium to systematic risk. An investment is assumed to be performing well if its sharpe ratio is greater than one.
TABLE- 3: Sharpe Ratio of Top 10 performing sector funds
It is clear from table 3 that all the sector mutual fund scheme have sharpe ratio’s greater than one. Which is a positive indicator of sector funds performance . According to this analysis shown in table 3, SBI FMCG fund provides highest return per unit of risk as it has highest value of sharpe ratio (1.9) and Reliance Pharma Fund provides the lowest return for the risk taken as it has lowest value of sharpe ratio (1.01).
4. Correlation between selected sector Funds’ return and benchmarks’ return.
R-squared: It is a measure of the correlation of the portfolio's returns to the benchmark's returns. It is the coefficient of determination of the relationship between a portfolio and its benchmark. It can be considered as a percentage from 1 to 100. R-squared is not a measure of the performance of a portfolio. A great portfolio can have a very low R-squared.
• 70-100% = good correlation between the
portfolio's returns and the benchmark's returns.
• 40-70% = average correlation between the
portfolio's returns and benchmark's returns.
• 1-40% = low correlation between the portfolio's
returns and the benchmark's returns.
TABLE-4 R-Squared of Top 10 performing sector funds
It is clear from table 4 tha (95) has highest value of r-squared. It means that this sector fund has the strongest correlation between portfolio’s return and benchmark return. Although, (80) & between their portfolio returns and benchmarks’ portfolio returns. Whereas, (61), Life MNC fund (53) have average correlation between funds’ portfolio returns and benchmarks’ portfolio returns.
V.
CONCLUSION
It can be concluded that from the above study that sector funds focus to invest only in equity shares of particular industrial sectors of the economy, except for a very little portion in money market securities. Although exposed to sector specific equity price risk, Sector funds seeks to reduce the stock specific risk by providing diversification within a particular sector. As far as last five year returns are concerned, Pharma (26.68%) and Birla Sun Life MNC Fund (25.01%) are best performing funds. Whereas, Keeping in view the risk associated with these sector funds, (σ = 29.14, β = 1.16 & α = 19.62) is the most risky sector fund a
10 Copyright © 2011-15. Vandana Publications. All Rights Reserved. the least risky fund among the top ten sector funds. By
making a risk return analysis with the help of Sharpe index it can be said that ranked I, UTI MNC Fund ( Sharpe = 1.74) is ranked II, UTI Transportation and Logistics Fund ( Sharpe = 1.55) is ranked III & Reliance Pharma Fund (1.01) is ranked last. As per the sharpe measure, all the top 10 performing sector funds have sharpe ratio greater than one which means that all these sector fund schemes provide higher return for the risk taken. Keeping in view the R-Squared values of selected sector funds it can be stated that sector fund has the strongest correlation between portfolio’s return and benchmark return. Although, (80) & between their portfolio returns and benchmarks’ portfolio returns. Whereas, (61), Life MNC fund (53) have average correlation between funds’ portfolio returns and benchmarks’ portfolio returns.
REFERENCES
Books:
[1] Singh, Preeti, “Study of performance of mutual funds in India”, Galgotia Publications, New Delhi, (2006). [2] Gurusamy, S., “Financial Markets & Institutions”, McGraw Hill Education, Third Edition, New Delhi (2009). [3] Sankaran, Sundaran, “Indian Mutual Funds”, Vision Books, New Delhi (2012).
[4] Kevin, S., “Security Analysis and Portfolio Management”, PHI publication, New Delhi, (2006).
[5] Chandra Prasanna, “Investment Analysis & Portfolio Management”, Tata McGraw Hill Education, fourth Edition, (2012).
Journals:
[6] William F. Sharpe, 1965, “Mutual Fund Performance”, The Journal of Business, Vol. 39(1), Part-II (Jan 1966), pp. 119-138.
[7] Khorana A. & Nelling E 1997, “The Performance, Risk & Diversification of sector funds”, Financial Analysts Journal, May-June, pp.62-74.
[8] O’ Neal, S.E., “Industrial Momentum & Sector mutual funds”, Financial Analysts Journal, Vol.56, (Jul-Aug 2000), pp. 37-49.
[9] Tiwari, A., & A. M. Vijh, “Sector Fund Performance: Analysis of cash flow volatility & Returns”, Working Paper, (2004).
[10] Eakins, G.S. & S.R. Stansell, Do Momentum Strategies Work? “ The Journal of Investing Vol. 13, (2004), pp.65-71.