INTRODUCTION
The typical example of human locomotion, in which alternate support and fl ight phase, is running. The move-ment unit of running is one stride of the lower limb which consists of two steps (Hay & Reid, 1988; Bosch & Klomp, 2004; Sedláček et al., 2004).
Speed of locomotion remains unchanged during sta-bilized running. In this case the total impulse of ground reaction force must compensate the work against the resistance of surrounding environment (Vanderka & Kamp miller, 2011). Even more, athlete should dur-ing support phase exert suffi cient vertical impulse to obtain the time for execution all aerial movements in wide range but in shortest possible time (Auvinet et al., 2002).
The support phase is usually divided into braking and propulsion subphases. Some authors (Bosch & K lomp, 2004; C iacci, Di Michele, & Merni, 2010) con-sider the dividing instant, when center of mass (COM) is located above the support foot or center of pressure. According to the dynamic analysis, also change from
negative to positive values in anterior-posterior compo-nent of horizontal force might be more accurate (No-vacheck, 1998; Herzog & Leonard, 2005; Kyrölainen et al., 2005).
The diff erence of accelerated running is arising from the specifi c movement task – achieve maximum hori-zontal velocity increase in shortest possible time. There-fore many diff erences are observed in the inter-segment dynamic and the time-space specifi c location of those segments (Kugler & Janshen, 2010). Propulsion force impulse should achieve much greater value than brak-ing force impulse (Hunter, Marshall, & McNair, 2005). Čoh, Peharec, Bačič, and Kampmiller (2006) published average values of first two support phase’s du ration 177 ms in the fi rst and 159 ms in the second step per-formed by top sprinter. Another study of Čoh, Tomažin, and Štuhec (2009) of an international class female ath-lete pre sent values of support duration 168 ± 17 ms in the fi rst and 139 ± 22 ms in the second ground contact after leaving the blocks.
Vertical force impulse provides the fluent rise of COM, which enables execution of aerial movements in
COMPARATIVE ANALYSIS OF THE SUPPORT PHASE DURING FIRST TWO STEPS
AFTER LEAVING THE STARTING BLOCKS
Vladimír Hojka, Petr Kubový, Radka Bačáková
Faculty of Physical Education and Sport, Charles University, Prague, Czech Republic
Submitted in January, 2012
BACKGROUND: Biomechanical analysis of accelerated running dynamics provide valuable information about movement execution. The key phase of the movement is the ground contact phase, in which force impulses applied on the human body are generated.
OBJECTIVE: The main goal of the study was to analyze diff erences in the support phase during fi rst and second ground contact off the blocks.
METHODS: 10 male athletes (22.9 ± 4.6 years) took part in laboratory experiment. Force-plate Kistler 9281 EA (Winterthur, Switzerland) was used to determine the contact forces in both steps independently. Matlab Software (The MathWorks, Inc., Natick, USA) was used for calculations of the force impulse, produced velocities and average acceleration during the support phase. Matlab also provided the tool for statistical processing of the results (paired T-test and correlation analysis).
RESULTS: Signifi cant diff erences (α = 0.01) were identifi ed between the fi rst and second step’s support phase in contact duration, produced horizontal velocity and average horizontal acceleration. Produced horizontal velocity achieved value 1.117 ± 0.081 ms–1 during fi rst and 0.835 ± 0074 ms–1 during second ground contact after blocks. Average acceleration showed negative correlation with the height of the athlete during the fi rst ground contact off the blocks (r = –0.42). If braking force was present during fi rst 20–40 ms of ground contact, it led to longer duration of support phase and was coupled with a smaller value of average acceleration.
CONCLUSIONS: Braking phase during fi rst steps after the blocks should be considered always as an imperfection of movement execution. Taller athletes seem to be disadvantaged during fi rst ground contact after leaving the blocks. The fi rst and second step’s ground phases are signifi cantly diff erent.
higher range of motion. On the other hand, too high va lue of vertical impulse may decrease the fi ring rate of support phases and therefore to decrease of number of horizontal propulsions. Finally, it may lead to a decrease of the effi ciency of performance. Lower limb ex tensors exhibit greater muscle excitation during acce leration running than during steady pace running, which is fol-lowed by greater force production, energy consumption and greater mechanical power (Roberts, 2006).
The movement task of acceleration running is repe-titive production of high propulsion force impulse. The goal of each support phase should be braking-force mini mization and propulsion impulse maximization alongside with shortening the contact time. The general solution of this problem is touch-down execution dorsal from COM vertical projection. Coupled with muscle pre-activation both strategies combined should ensure qua litatively superior performance. Modern trends in sprinting (Kobayashi et al., 2009; Slawinski et al., 2010) identify the strategy of longer steps in accelera-tion phase with active ground preparaaccelera-tion phase and activation of muscle elasticity.
The aim of our study was to compare parameters that describe the dynamics of the support phase during fi rst two steps after blocks. From these parameters indi-vidual strategy should be identifi ed, which athlete used for the movement task solution. Diff erences in dynamics of fi rst and second step are expected.
METHODS
10 athletes (decathletes with personal best over 6000 points in competition; 100 m personal best 10.73–11.99 in competition achieved in 2006–2011; height 181.6 ± 5.8 cm; weight 73.7 ± 6.6 kg; age 22.9 ± 4.6 years) took part in laboratory experiment. All participants sign ed the informed consent. The research was agreed by the Ethics committee of the Faculty of Physical Educa-tion and Sport of Charles University in Prague.
Athletes should perform a crouch start from the blocks with fi rst step (resp. second step) foot place-ment on the force-plate. One force-plate (Kistler 9281 EA; Winterthur, Switzerland) operating on sample rate 1000 Hz was used to determine the ground reaction force in three components (anterior-posterior, lateral and vertical). Measured ground reaction force (GRF) data were exported to Matlab R14 (The MathWorks, Inc; Natick, Massachusetts, USA). The instant, when vertical component of ground reaction force overcame the three standard deviations bandwidth of unloaded force plate, it was defi ned as the instant of touch-down (beginning of the support phase). The end of the sup-port phase was defi ned as the instant, when vertical com ponent of ground reaction force fell down to earlier defi ned bandwidth.
The movement criterion was maximization of anteri-or-posterior velocity production during support phase calculated as a ratio of force impulse and athlete’s mass –
m
dt
F
v
od t
t ap
h
³
'
where Fap denotes anterior-posterior component of ground reaction force from the instant of touch-down (td) to the instant of the take-off (to) and m denotes the mass of the subject.
Athletes performed 3 trials with fi rst step on the pla te and 3 trials with second step on the plate. All par ti cipants completed a warm-up and unmeasured free trials to maximize probability of whole foot place-ment on the plate. The best attempt of each subject in fi rst (respectively second) support phase in terms of defi ned optimization criterions were analyzed. Follow-ing charac teristics of the support phase were analyzed: – ground reaction force impulse in three components, – support phase duration,
– anterior-posterior velocity production during the sup-port phase,
– average acceleration during support phase calculated as a ratio of and tsup.
T-test function in Matlab was used to compare cha-rac teristics of the fi rst and second step. Signifi cance level α was set to 0.01. T-test function returned value 1, if the null hypothesis can be rejected on pre-defi ned sig nifi cance level 0.01. Correlation analysis was used to identify relationship between pair of characteristics. Pearson’s correlation coeffi cient was used for descrip-tion of dependence of height of the body and produced average acceleration during fi rst two steps and also to identify the relationship between produced velocity and the duration of the support phase.
RESULTS
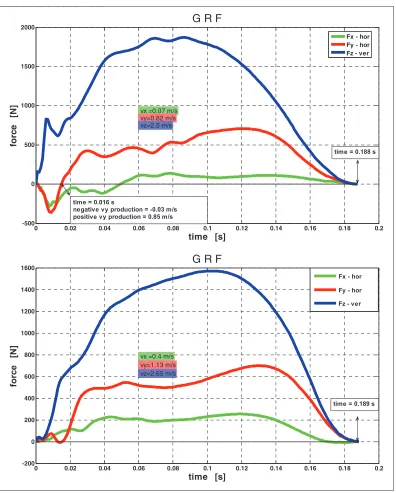
Diff erences in components of ground reaction forces were identifi ed in each individual. Four participants per-formed with braking force during fi rst ground contact after leaving the blocks. The same number of partici-pants exhibited the same imperfection during second support phase, but these individuals were not identical (only two). The examples of well-performed step and the step with braking phase are displayed in Fig. 1.
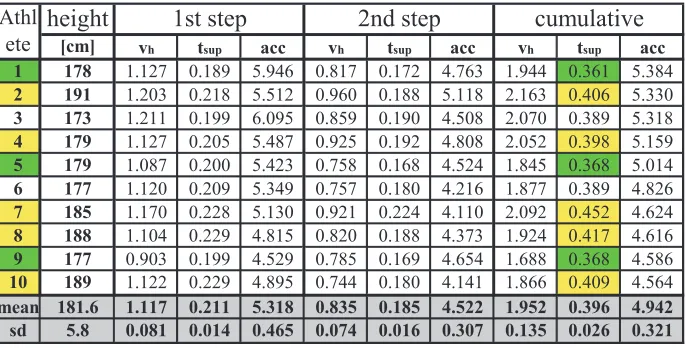
Parameters of the fi rst two steps of each participant are presented in TABLE 1. Athletes are ordered accord-ing to two-steps average acceleration.
h
v
'
h
Fig. 1
Resulting GRF in three components. The support phase with the braking force is displayed on the upper graph. Brak ing force, which was presented for 16 ms, caused velocity loss of 0.03 m/s. This braking phase is also associated with impact force peak of vertical component. Well executed steps’s characteristics are shown on the second fi gure. Although duration of both strides is similar, huge diff erences in horizontal velocity production are observed
duction are observed.
0 0.02 0.04 0.06 0.08 0.1 0.12 0.14 0.16 0.18 0.2 -500
0 500 1000 1500 2000
time [s]
fo
rc
e
[
N
]
G R F
vx =0.07 m/s vy=0.82 m/s vz=2.5 m/s
Fx - hor Fy - hor Fz - ver
time = 0.016 s
negative vy production = -0.03 m/s positive vy production = 0.85 m/s
time = 0.188 s
0 0.02 0.04 0.06 0.08 0.1 0.12 0.14 0.16 0.18 0.2 -200
0 200 400 600 800 1000 1200 1400 1600
time [s]
fo
rc
e
[
N
]
G R F
vx =0.4 m/s vy=1.13 m/s vz=2.65 m/s
Fx - hor
Fy - hor
Fz - ver
time = 0.189 s
Typical trends in the changes of parameters between fi rst and second steps are evident from the table. Pro-duced velocity during first ground contact achieved value 1.117 ± 0.081 ms–1 and 0.835 ± 0.074 ms–1 during
the second ground contact. Therefore average accelera-tion achieved smaller values by approximately 0.8 ms–2
during the second support phase than in fi rst one. Also duration of the second step was by 26 ms shorter in the
average. Produced horizontal velocity, ground contact duration and average acceleration exhibit all statistical-ly signifi cant diff erences between the fi rst and second support phase on signifi cance level 0.01, because T-test values of comparisons were 1 in all three cases.
The infl uence of body height showed negative cor-relation with average two-steps acceleration (r = –0.31) and with the fi rst step average acceleration (r = –0.42), but no correlation with average second step accelera-tion (r = –0.01). These fi ndings lead to idea, that higher body height may be disadvantageous especially during fi rst ground contact.
Two strategies were identifi ed in comparison of ath-letes – green marked athath-letes used the strategy of short-er contact time, while the yellow marked tend to longshort-er contact time and thus relied more on their strength. The dividing range was 370–390 ms in the duration of two support phases, in which no strategy was identifi ed.
DISCUSSION
In comparison with values reported by Čoh et al. (2006) and Čoh et al. (2009) our subjects perform with longer duration of the support phase in both steps. The explanation is better sport performance of their subjects than ours. An interesting fi nding was that the athlete with best personal record on 100 m (10.73 s), was the worst in the acceleration performance criterion.
Braking force impulse in the beginning stage of the support phase (usually in duration of 20–40 ms), always negatively infl uenced the gain of total horizontal mo-mentum. The solution of this problem should be to avoid passive foot placement on the ground during fi rst strides. Two common strategies were identifi ed in accelera-tion stage of running. The fi rst strategy is primarily ba-sed on shortening of the support phase (green marked in TABLE 1). In the second strategy (yellow marked athletes in TABLE 1), a major role is played by the
lengt hening of the support phase in order to maximize the horizontal velocity production. The purpose of our study was not to decide which strategy leads to better results. Although the idea that minimizing ground con-tact and maximizing the effi ciency of force application lead to better results, is evident. The best athlete was typical member of the fi rst group, while from second and fourth belonged to the second group.
Another interesting fi nding was that the length of support is associated with the height of the athletes. Tal ler athletes such as {2, 7, 8, 10} tend to spend more time on the ground, while smaller athletes were usu-ally in short contact with the ground {1, 9}. Previously mentioned taller athletes exhibit the braking force in anterior-posterior direction.
In advance of the further steps shorter contact times and smaller acceleration achievement are expected. Another important parameter that strongly infl uenced the performance was the level of explosive strength of the lower limbs. Its level depends on athlete’s typology, especially on muscle design, and also on the level of sport preparation. Its level may be calculated as the norm of the vector of GRF impulse divided by indi-vidual mass and contact time, but it was not purpose of the study.
The low value of correlation between force produc-tion and support duraproduc-tion during fi rst step may be ex-plained by wide technical variance of movement execu-tion. While during second support phase athletes tend to perform more predictable – higher force impulse is usually compensated by time loss. Thanks to higher ini-tial horizontal velocity value, it is easier to overcome the braking phase due to inertia and quickly begin the propulsion.
TABLE 1
Parameters of support phase during the fi rst and second step in accelerated running
height
[cm] vh tsup acc vh tsup acc vh tsup acc
1 178 1.127 0.189 5.946 0.817 0.172 4.763 1.944 0.361 5.384
2 191 1.203 0.218 5.512 0.960 0.188 5.118 2.163 0.406 5.330
3 173 1.211 0.199 6.095 0.859 0.190 4.508 2.070 0.389 5.318
4 179 1.127 0.205 5.487 0.925 0.192 4.808 2.052 0.398 5.159
5 179 1.087 0.200 5.423 0.758 0.168 4.524 1.845 0.368 5.014
6 177 1.120 0.209 5.349 0.757 0.180 4.216 1.877 0.389 4.826
7 185 1.170 0.228 5.130 0.921 0.224 4.110 2.092 0.452 4.624
8 188 1.104 0.229 4.815 0.820 0.188 4.373 1.924 0.417 4.616
9 177 0.903 0.199 4.529 0.785 0.169 4.654 1.688 0.368 4.586
10 189 1.122 0.229 4.895 0.744 0.180 4.141 1.866 0.409 4.564
mean 181.6 1.117 0.211 5.318 0.835 0.185 4.522 1.952 0.396 4.942 sd 5.8 0.081 0.014 0.465 0.074 0.016 0.307 0.135 0.026 0.321
1st step
2nd step
cumulative
Athl ete
The limitations of our research are the absence of in-formation about fl ight phase parameters, such as length of the stride and duration of fl ight. Stride fi ring rate and the range of motion during the fl ight would determine the increase of velocity alongside with the support phase execution.
CONCLUSION
Duration of the support phase and produced hori-zontal velocity are signifi cantly diff erent during the fi rst and the second ground contact off the blocks. Taller ath-letes tend to spend more time on the ground especially during fi rst step. If braking force occurred during both steps, it negatively infl uenced the duration of ground contact and average acceleration, so athletes should execute the steps to avoid it.
ACKNOWLEDGEMENTS
The research was supported by Grant Agency of Char les University Nr. GAUK 3004/2011. Authors thank to Tarvis Williams for the language and gram-mar corrections.
REFERENCES
Auvinet, B., Berrut, G., Touzard, C., Moutel, L., Collet, N., Chaleil, D., & Barrey, E. (2002). Reference data for normal subjects obtained with an accelerometric device. Gait & Posture, 16(2), 124–134. doi: 10.1016/ s0966–6362(01)00203-x.
Bosch, F., & Klomp, R. (2004). Running: Biomechanics and exercise physiology in practice. New York: Else-vier Churchill Livingstone.
Ciacci, S., Di Michele, R., & Merni, F. (2010). Kine matic analysis of the braking and propulsion pha ses during the support time in sprint running. Gait Posture, 31(2), 209–212. doi: DOI10.1016/j.gaitpost.2009.10.007. Čoh, M., Peharec, S., Bačič, P., & Kampmiller, T.
(2009). Dynamic factors and electromyographic activity in a sprint start. Biology of Sport, 26(2),
137–147.
Čoh, M., Tomažin, K., & Štuhec, S. (2006). The bio-mechanical model of the sprint start and block ac-celeration. Facta Universitatis: Physical Education and Sport, 4(2), 103–114.
Hay, J. G., & Reid, J. G. (1988). Anatomy, mechanics, and human motion (2nd ed.). Englewood Cliff s, N. J.: Prentice Hall.
Herzog, W., & Leonard, T. R. (2005). The role of pas-sive structures in force enhancement of skeletal
mus cles following active stretch. J. Biomech., 38(3), 409–415. doi: 10.1016/j.jbiomech.2004.05.001. Hunter, J. P., Marshall, R. N., & McNair, P. (2005).
Re-lationships between ground reaction force impulse and kinematics of sprint-running acceleration. Jour-nal of Applied Biomechanics, 21(1), 31–43.
Kobayashi, K., Tsuchie, H., Matsuo, A., Fukunaga, T., & Kawakami, Y. (2008). Changes in sprint perform-ance and kinetics during the acceleration phase of running of a world record holder. In K. Young-Hoo, S. Jaeho, S. Jae Kun, & S. In-Sik (Eds.), XXVI In-ternational Conference on Biomechanics in Sports
(pp. 591). Soul: ISBS.
Kugler, F., & Janshen, L. (2010). Body position deter-mines propulsive forces in accelerated running.
Journal of Biomechanics, 43(2), 343–348. doi:
DOI10.1016/j.jbiomech.2009.07.041.
Kyrolainen, H., Avela, J., & Komi, P. V. (2005). Changes in muscle activity with increasing runn-ing speed. J. Sports Sci., 23(10), 1101–1109. doi: 10.1080/02640410400021575.
Novacheck, T. F. (1998). The biomechanics of running.
Gait Posture, 7(1), 77–95.
Roberts, T. J. (2006). Integrated muscle-tendon func-tion during running accelerafunc-tions. Journal of Biome-chanics, 39(Suppl. 1), 360.
Sedláček, J., Koštial, J., Kampmiller, T., & Dremmelová, I. (2004). The use of supra-maximal running speed means in sprinter training. Acta Universitatis Palac-kianae Olomucensis. Gymnica, 34(1), 15–22. Slawinski, J., Bonnefoy, A., Ontanon, G., Leveque,
J. M., Miller, C., Riquet, A., Dumas, R., & Chèze, L. (2010). Segment-interaction in sprint start: Analy-sis of 3D angular velocity and kinetic energy in elite sprinters. Journal of Biomechanics, 43(8), 1494–1502.
doi: DOI10.1016/j.jbiomech.2010.01.044.
Vanderka, M., & Kampmiller, T. (2011). Ontogenetic development of kinematic parameters of the running stride. Sport Science Review, 20(3–4), 5–24.
KOMPARATIVNÍ ANALÝZA OPOROVÉ FÁZE PRVNÍCH DVOU KROKŮ PŘI NÍZKÉM STARTU
(Souhrn anglického textu)
VÝCHODISKA: Biomechanická analýza dynamiky
ak celerovaného běhu poskytuje cennou informaci o pro-vedení pohybu. Klíčovou fází pohybu je fáze kontak tu s podložkou, při které dochází k aplikaci silových impul-sů na lidské tělo.
CÍLE: Cílem práce bylo analyzovat odchylky v dy-namice oporové fáze při prvním a druhém kroku akce-lerovaného běhu po výběhu z bloků.
bě hem oporových fází v obou krocích byla použita dy-namometrická deska (Kistler 9281 EA – Winterthur, Švýcarsko). Výpočty silových impulsů, produkce rych-losti a průměrného zrychlení byly provedeny v programu Matlab (The MathWorks, Inc., Natick, USA). V Mat-labu jsme provedli i následný párový T-test a korelační analýzu.
VÝSLEDKY: Statisticky významné diference (α = 0.01) mezi první a druhou oporou byly nalezeny v délce kontak-tu, produkci horizontální rychlosti a průměrném zrychle-ní. Produkce horizontální rychlosti činila v prvním kroku 1.117 ± 0.081 ms–1 a 0.835 ± 0.074 ms–1 bě hem druhého
kroku. Průměrné zrychlení ukázalo ne gativní korelaci s tě-lesnou výškou atleta (r = –0.42). Pokud se během prvních 20–40 ms oporové fáze objevil brzdný impuls, docházelo k prodloužení trvání oporové fáze a celkovému nižšímu průměrnému zrychlení.
ZÁVĚRY: Výskyt brzdné fáze v prvních krocích po výběhu z bloků je považován za technický nedostatek. Atleti vyššího vzrůstu jsou pro akcelerovaný běh lehce znevýhodněni. Oporové fáze prvního a druhého kroku vykazují významné odlišnosti v dynamických paramet-rech.
Klíčová slova: biomechanika, dynamika, nízký start, akce-lerovaný běh.
Mgr. Vladimír Hojka
Education and previous work experience
Master degree – secondary school teacher education – physical education and mathematics (2001).
Track and fi eld coach – 1st class license (2001). Ph.D. student – study programme – biomechanics. First-line publications
Hojka, V., Bačáková, R., & Kračmar, B. (2011). A case study of the similarity of kick-biking and running in terms of kinesiology. Acta Universitatis Carolinae Kinanthropologica, 47(1), 139–147.
Hojka, V., Vystrčilová, M., & Kračmar, B. (2010). Meto-dika zpracování a vyhodnocení EMG cyk lického pohybu. Česká kinantropologie, 14(1), 19–28. Chrástková, M., Bačáková, R., Kračmar, B., & Hojka, V.
(2011). Kineziologický obsah vybraných forem běhu na lyžích, užívaných širokou veřejností. Rehabilitace a fyzikální lékařství, 18(1), 32–38.
Pařík, O., Hojka, V., & Pavelka, R. (2011). Comparison of the activation of selected muscles during sprint and skipping. Acta Universitatis Carolinae Ki nan thro-pologica, 47(1), 107–118.
Kračmar, B., Bačáková, R., & Hojka, V. (2010). Vliv cyk listického kroku na pohybovou soustavu. Reha-bilitace a fyzikální lékařství, 17(3), 107–112.
Charles University
Faculty of Physical Education and Sport