Effect of impact parameters and moisture content on kernel loss during corn snapping**
Qiankun Fu1,2, Jun Fu1,2,3*, Zhi Chen2,4, Lujia Han3, and Luquan Ren1,21College of Biological and Agricultural Engineering, 2Key Laboratory of Bionics Engineering, Ministry of Education; Jilin University, Changchun 130022, China
3College of Engineering, China Agricultural University, Beijing 100083, China 4Chinese Academy of Agricultural Mechanization Sciences, Beijing 100083, China
Received January 26, 2019; accepted May 22, 2019
*Corresponding author e-mail: [email protected]
**This work was supported by the National Natural Science Foundation of China (51705193) (2018-2020), the Science and Technology Development Project of Jilin Province (20170204016NY) (2017-2019) and the Graduate Innovation Fund of Jilin University (101832018C008) (2018-2019).
A b s t r a c t.This paper seeks to describe the effect of impact parameters and moisture content on kernel detachment, with the physical parameter of dissipated momentum being introduced to the process of analysing the data. Experiments were carried out on a drop-testing bed, using an accelerometer bound to corn ears to determine the impact parameters. As the impact velocity increased from 3.5 to 6.0 m s-1 at a moisture content of 18.5%, peak acceler-ation, the integral of acceleration and rebound velocity increased simultaneously, while impact time showed a declining trend. The mass of the detached kernels increased from 5.13 to 13.70 g per corn ear. When the moisture content of the kernels increased from 11.8 to 30.6% with an impact velocity of 5.0 m s-1, the mass of the detached kernels decreased from 12.61 to 7.56 g per corn ear. The dissipated momentum showed homologous trends with that of the detached kernel mass. Furthermore, a model of the interaction effect of impact velocity and moisture content on the mass of the detached kernel was established through full factorialtests. The methods and data may provide theoretical guidance for the design and optimization of deck plates on the corn heads and decrease the incidence of kernel detachment.
K e y w o r d s : impact, kernels detachment, moisture content, corn ear snapping
INTRODUCTION
The main function of the harvester head is to employ a fracture separation load on the corn ears. The use of a corn
harvester may significantly improve harvesting efficiency, but it also simultaneously induces a significant amount of
kernel loss (Hanna et al., 2002). Impacts between the corn
ears and deck plates are produced during corn ear snapping at the harvester head, which is the primary reason for kernel loss (Paulsen et al., 2013).
Based on the principle of avoiding unnecessary impact or reducing the impact level, many mechanical improve-ments to crop harvesters have been made in order to reduce kernel loss (Špokas et al., 2008; Zareiforoush et al., 2010;
Fu et al., 2018). Many of these improvements were made
to improve the mechanical process of corn ear snapping. Taking biological surface as the object, He (2007) designed
two counter-rotating snapping rolls fitted with bionic struc -tures of humps and holes, which aggressively pulled the corn stalks downward in a controlled motion. Yan (2009) found that a vertical roll-type corn harvester could effec-tively decrease kernel loss by reducing the required pull force on the corn ears. Furthermore, Wang et al. (2016) designed a pair of rib-snapping rollers with variable screw pitch that not only solved the problem of snapping-roller blockage but also reduced grain loss when the corn ear became overripe. In addition, Oxbo’s 3000 series corn heads, John Deere’s 700C series corn heads and Drago GT developed automatic self-adjusting devices to reduce ear impacts on the deck plates (Yang et al., 2016). However, the mechanical structures of these harvester heads were designed empirically, without further research into the mechanism of the impacts affecting kernel detachment.
On the other hand, some techniques were used to explore the relationship between impacts and the resulting dam-age on a variety of agricultural products (Studman, 2001;
Li et al. 2009; Stropek and Gołacki, 2016). The changes,
which occurred in impact force, impact time and accelera-tion, as well as those, which occurred in the mechanical properties of fruit within those parameters, were the main
issues included in the work of some significant research
-ers (Lu et al., 2010; Jiménez-Jiménez et al., 2012; Boydas
et al., 2014; Stropek and Gołacki, 2015). The mechanical
properties of grain crops in particular varied with their moisture content (Srivastava et al., 1976; Shahbazi 2011; Shahbazi et al., 2011), which differed from those of fresh fruits. Burkhardt and Stout (1974) measured the maximum
impact force inflicted on corn ears, and found that the peak
force was dependent on moisture content, ear weight, and impact velocity. Li et al. (2014) dropped impact heads
on fixed corn ears over a range of moisture contents, the
results showed the discrete effect of kernels is reduced with the increase in moisture. Moreover, Singh et al. (1991) tested the elastic modulus and Poisson’s ratio under dif-ferent moisture contents and revealed the stress and strain law of kernel detachment. Kalkan et al. (2011) found that the strength values of popcorn decreased with increasing moisture content by measuring strength properties and the
dynamic coefficient of friction. Ajayi and Clarke (1997) found that moisture content had the most significant effect
on the strength characteristics of the corn kernel by assess-ing the energy of impact loss. Therefore, the moisture content of kernels was an indispensable factor in the analy-sis of corn-snapping impact parameters.
In the process of corn ear snapping, each corn ear was moved vertically downward at a speed equal to the linear velocity of the snapping rolls before colliding with the deck plates. When it made contact with the deck plates, the corn ear was subjected to tensile force T, gravity G and resist-ance F from deck plates as shown in Fig. 1 (Zhao, 2012). At the same time, the velocity of the corn ear abruptly dropped to zero with huge deceleration, which was numerically
proportional to the impact forces involved (Yousefi et al.,
2016). As a result, the kernels on the corn ear were detached from the cob, causing grain loss at the corn harvester head. The pedicel forms the connection between the cob and the kernel. The force diagram of the kernels is illustrated in Fig. 2. The kernels in direct contact with the deck plates (Fig. 2a), were subjected to the following forces: reac-tion force p1 and shear force s1 through the kernel pedicel,
reaction forces n1 from the deck plate and q2 from the next
kernel. A floating coordinate system was established for the
kernel that we studied. Assuming that the direction of the kernel pedicel as the x1 axis and the elevation direction as
the y1axis, reaction forces n1 and q2 may be divided into
their components n1x, q2x in the direction of x1 and n1y, q2y in the direction of y1 (Petrů et al., 2012; Xu et al., 2013; Qian
et al., 2017). As the forces involved were conducted main-ly along the axis direction of the corn cob, the detaching condition for the kernel may be expressed by the following inequality:
Fig. 1. Force diagram of corn ear detachment: T – tensile force to corn ear, G – gravity of corn ear, F – resistance force of the deck plate on the corn ear, Fx – component of F in the horizontal direc-tion, Fy – component of F in the vertical direcdirec-tion, N – reaction force of the snapping roll on the stalk, Nx – component of N in the horizontal direction, Ny – component of N in the vertical direction, f – friction force of the snapping roll on the stalk, fx – component of f in the horizontal direction, fy – component of f in the vertical direction.
Fig. 2. Force diagram of corn kernels: a – force diagram of kernels in contact with the deck plate, p1 – reaction force from the pedicel, s1 – shear force from the pedicel, ox1y1 – floating coordinate sys -tem on the kernel in contact with the deck plate, n1 – reaction force of the deck plate, n1x – component of n1 in the direction of x1, n1y – component of n1 in the direction of y1, q2 – reaction force of the next kernel, q2x – component of q2 in the direction of x1, q2y – component of q2 in the direction of y1 ; b – force diagram of kernel not in contact with the deck plate, tn – tensile force from the pedicel, sn – shear force from the pedicel, oxnyn – floating coordi -nate system on the kernel not in contact with the deck plate, qn-1 – reaction force from the nether kernel, q(n-1)x – component of qn-1 in the direction of xn, q(n-1)y – component of qn-1 in the direction of yn, qn+1 – reaction force from the upper kernel, q(n+1)x – component of qn+1 in the direction of xn, q(n+1)y – component of qn+1 in the direc-tion of yn.
a
1 2 2 L 1 2 L
x x y
y y
n q q P
n q S
µ
− − >
− >
, (1)
where: μ is the coefficient of sliding friction; PL is for
reac-tion force limit in the direcreac-tion of the pedicel, SL is the shear
force limit in the elevation direction of the pedicel. For the kernels which weren’t in contact with the deck plates (Fig. 2b), the forces applied to them were the tensile force tn, the shear force sn through the kernel pedicel, and the
reaction forces of the next kernels qn-1 and qn+1. Similarly,
in the coordinate system oxnyn, the reaction forces qn-1and
qn+1 may be divided into q(n-1)x, q(n+1)x in the direction of xn, and q(n-1)y, q(n+1)y in the directions of yn. The detaching condi-tions of these kernels may be expressed with the following inequality:
( 1) ( 1) ( 1) ( 1) L
( 1) ( 1) L
n x n x n y n y
n y n y
q q q q T
q q S
µ µ
− + − +
− +
+ − − >
− >
, (2)
where: TL represents the tensile force limit in the direction
of the pedicel.
The aim of this research was to determine the rela-tionships between kernel detachment and the impacts parameters of corn ears on simulated deck plates. The impact parameters include impact time, peak acceleration, rebound velocity, and impact impulse. They were affected by impact velocity, as well as the moisture contents of the corn kernels. These parameters may be used to evaluate the effects of dissipated momentum in the impacts, which were closely related to kernel detachment. Furthermore, a model was constructed to relate kernels detachment to the interac-tion of the effects of impact velocity and moisture content. The proposed model may be used to guide the design of corn ear-snapping devices.
MATERIALS AND METHODS
The research was carried out on a corn variety named Zhengdan 958, which is widely planted in Northeast China. The corn ears were picked by hand in October 2018 from the Agricultural Experimental Base of Jilin University in Changchun, Jilin province. The moisture contents of the kernels were measured at 30.6%. The corn ears used in the research had a uniform shape and size, there was no kernel crushing or shedding, no diseases or insect pests. All of the corn ears selected had a mass of 300-320 g, a maximum diameter of 50-54 mm and a length of 200-220 mm. Before the experiments, the husks of the corn ears were removed by hand. The peduncle residues were detached completely
with a knife to eliminate their influence from the forces
applied to the kernels.
A drop-testing bed was designed to test the impact parameters of the corn ears, as shown in Fig. 3a. The drop-testing bed included a motor-driven lifting screw to control the drop height. Two horizontal slide rails, two elec-tric pushing rods, two supporting plates, and holding bars
were used to hold and release the corn ear. An impact plate at the base of the drop-testing bed was used as a substi-tute for the deck plates of the corn head. The corn ear was
fixed precisely to the middle of supporting plates before
being dropped down. A CA-YD-180c type accelerometer was screwed into a thick steel plate bonded to the corn ear with a hoop, as shown in Fig. 3b. The accelerometer had a sensitivity of 0.509 mV(m s-2)-1. The sampling
fre-quency was 0-15 000 Hz, and the measurement range was ±10 000 m s-2. An MDR-81 data recorder and DDP data
analyser were used to record and analyse the acceleration data respectively.
An accelerometer fixed at a distance of 30 mm from the
lower end of the corn ear was used to measure the impact acceleration and impact time. The sampling frequency of the accelerometer was set to 10 240 Hz. In particular, some kernels on the corn ear top were removed to quantify the corn ears at a mass of 240 g under similar conditions. The total mass of the impacting objects was 275 g, this includes the corn ear, accelerometer, steel plate, and the hoop. The operation described above aimed to reduce disturbances to
the impact parameters caused by the mass fluctuation of
the corn ears. The acceleration parameters could be used to determine the impact parameters including the impact time, peak acceleration, impact impulse, and rebound velocity. a
b
Fig. 3. Impact system of the corn ear: a – drop-testing bed of corn
The detachment of the corn ears was accomplished in a short time period due to the high rotation speed of the snapping rolls. Because of the high impact velocities and
flexibility of the colliding bodies, the impact of the corn ear
on the deck plates was more complicated than the impact between the mass point and the plate. The impact process of the corn ear was in accordance with the momentum-impulse conservation law. As irreversible deformation was produced in the form of kernels detachment, the formula of
momentum conservation law could be modified to the fol
-lowing form (Stropek and Gołacki, 2013):
0
0 ( )d I R d
t t
t
M
∫
+∆ a t t = Mv M v+ ′ +P , (3) where: M is the corn ear mass before impact; a is the accel-eration; M’ is the corn ear mass after impact; vI is the impactvelocity; vR is the rebound velocity; Pd is the dissipated momentum of the corn ear; t is time; t0 is the time at which
the corn ear touched the deck plates; Δt is the impact time. Impact time and peak acceleration were two important parameters chosen for the assessment of the mechanical impact strength. The impact time was the exact length of the time period from the rise of acceleration to its decrease
to the level position. After digital filtering, a typical dia -grammatic sketch of acceleration in the corn ear impact process was obtained as shown in Fig. 4. The impact time is Δt in Fig. 4. It lasts from the upturn of acceleration to its decrease to the base value. The acceleration of gravity is so slight compared to the impact acceleration that it may be neglected in this process. The peak value of acceleration aP
indicates the peak force applied to the corn ear. The impact
impulse is the product of the corn ear mass and the definite
integral of acceleration from a0 to a0 + Δt. The definite inte
-gral of acceleration may be calculated using graphing and analysis software ORIGIN 2017 by integrating the curve from t0 to t0 + Δt.
The impact velocity was the linear velocity of the corn ears moving towards the deck plates. It equals the periph-eral velocity of the outer margin of the snapping rolls. The velocity may be calculated using the following equation:
, (4)
where: vS is the linear velocity of the corn ears; n is the
rotating speed of the snapping roll, ranging from 750 to 1 050 rpm; R is the diameter of the snapping roll, which is approximately 100 mm. Hence, the velocities of the corn ears before stripping may be calculated at 3.93 to 5.50 m s-1.
In this experiment, the impact velocity may be determined by changing the drop height. Mathematically, this may be expressed as follows:
I 2
v = gh, (5)
where: vI is the impact velocity, m s-1; g is the acceleration
due to gravity, with a value of 9.8 m s-2; h is the drop height
from the lower end of the corn ear to the impact plate.
The impacts were researched under six different velo- city varieties: 3.5, 4.0, 4.5, 5.0, 5.5 and 6.0 m s-1,
corre-sponding to drop heights of 0.625, 0.813, 1.033, 1.275, 1.543 and 1.837 m.
The corn ear was only subjected to gravity and reaction force during impact. Both of the forces occurred in the ver-tical direction. Accordingly, the rebound movement of the corn ear was in the upward direction vertically. Therefore, the rebound velocity could be calculated from the rebound
time, which was the time difference between the first
impact and the second impact. Figure 5 shows a diagram
of acceleration from the first impact to the second impact.
The rebound velocity may be calculated using the follow-ing equation:
R 2 1
1
= ( )
2
v g t t− , (6)
where, vR is the rebound velocity of the corn ear, t1 is the
moment of the first impact; t2 is the moment of the second
impact.
In this experiment, the main cause of the dissipated momentum was the detachment of the kernel. The impact velocity and the response to the impact, including the impact time, peak acceleration, impact impulse, and rebound velocity were used to estimate the dissipated momentum of the corn ear due to the impact.
In addition, the moisture content was controlled quanti-tatively. Different groups of corn ears were dried naturally in the air. The four moisture content degrees were 11.8, 18.5, 23.4 and 30.6% accordingly. The corn ears were provided with hermetic and cryogenic storage before the impact tests.
Fig. 4. Diagrammatic sketch of corn ear impact acceleration: aP – peak acceleration, t0 – the time when the corn ear touched the deck plates, Δt – the impact time.
Over the course of the tests, measurements were con-ducted on 20 corn ears for each treatment. The masses of the detached kernels, as well as the numerical values of the impact times, peak acceleration, and rebound times were recorded on the spot. The impact impulse, rebound veloc-ity, and dissipated momentum were calculated through the use of software and formulas.
RESULTS AND DISCUSSION
The relationship between peak acceleration and impact velocity is shown in Fig. 6a. Impact acceleration increased
with the impact velocity. Specifically, as the impact veloc
-ity increased from 3.5 to 6.0 m s-1, the peak acceleration
increased from 2 072.2 to 3 725.8 m s-2. In previous
stud-ies, the figures showed an analogous trend. According to
Geyer et al. (2009), peak accelerations were approximately 1 470 m s-2 for an impact velocity of 3.13 m s-1 and
approxi-mately 1 960 m s-2 for a velocity of 4.43 m s-1 as measured
by the acceleration measuring unit (AMU) placed in the
potato tubers. The results were thought to be diminished due to the uncontrolled movement of the AMU inside the tuber. Cerruto et al. (2015) also confirmed that peak accel -eration increased with the impact velocity based on the
finite element method.
The relationship between the impact time and impact velocity is demonstrated in Fig. 6b. Overall, the impact time showed a declining trend with the increase in impact veloc-ity. As the impact velocity increased from 3.5 to 6 m s-1,
the mean impact time dropped from 4.69 to 4.43 ms.
However, compared to the other fluctuations, the changes
in impact times at different impact velocities were so slight, that the numerical values of the impact times in this test did not correspond strictly to the declining trend. For example, the impact time was 4.45 ms in the case of an impact veloc-ity of 5.0 m s-1, but it increased to 4.49 ms in the case of
5.5 m s-1. In a previous work, Stropek and Gołacki (2013)
measured an average impact time decrease from approxi-mately 6.5 ms to approxiapproxi-mately 4.5 ms as the impact velocity increased from 0.125 to 1.66 m s-1. The differences
between the figures were caused by the material properties
and velocity contrast (Lien and Ting, 2014; Cerruto et al. 2015; Lin and Zhang, 2017).
The product of corn ear mass and acceleration integral is used to determine the impact impulse of the corn ear.
Since the mass of the impacting objects was quantified to
275 g in all the tests, the integral of acceleration was used as a quantitative reference indicating the impact impulse. The
best fitting curve for the relationship between the accelera -tion integral and the impact velocity was a straight line, a
b c
d e
as shown in Fig. 6c. The integral of acceleration increased from 4.17 to 8.54 m s-1 as the impact velocity increased
from 3.5 to 6.0 m s-1. Similarly, Lin and Zhang (2017) tested
acceleration by fixing an accelerometer to concrete blocks.
They found that impulses calculated from the integral of acceleration increased almost linearly with increases in impact velocity ranging from 5 to 13 m s-1, which agreed
well with the results of a model based on smooth particle hydrodynamics.
The rebound time between the first impact and the
second impact at different impact velocities is shown in Fig. 6d. The vertical rebound velocity increased dramati-cally when the impact velocities were smaller than 5.0 m s-1. As the impact velocities became higher than 5.0 m s-1,
the increasing level of the rebound velocity slowed down. Typically, the rebound time was 0.135 s when the impact velocity was 3.5 m s-1, and it increased to 0.236 s at an
impact velocity of 5.0 m s-1, yet it reached a value of 0.261
s at an impact velocity of 6.0 m s-1. Based on Eq. (6), the
vertical rebound velocities were calculated, as shown in Fig. 6e. Yang and Schrock (1994) took the ratio of the impact velocity and rebound velocity of the kernel as the index of energy loss. Their test results were much higher than those of the corn ears, as the detached kernels from the corn ears removed a massive proportion of the kinetic energy.
The test of impacts at different kernel moisture con-tents was conducted at an impact velocity of 5.0 m s-1. The
impact parameters of corn ears at different moisture con-tents is shown in Table 1. The peak accelerations ranged from 3 145.4 to 3 007.4 m s-2 with a declining trend. The
elastic modulus was reported to decrease significantly
when the moisture content of the kernels became higher (Singh et al., 1991; Figueroa et al., 2011). Lien and Ting (2014) tested the peak impact forces of guavas at a range of maturity states with a constant drop height of 15 mm. In the same way, the impact force decreased as ripening decreased the elastic modulus.
The impact times showed no significant differences
as the moisture content increased from 11.8 to 23.4%, the impact time remained steady between 4.45 to 4.69 ms, but the value rose sharply to 5.13 ms when the moisture content increased to 30.6%. In their research with guavas, Lien
and Ting (2014) found that the softening of fruit with
matu-rity prolonged the impact time. However, the influences of
moisture content on the impact time of the corn ear require further research and more precise measurement, as the impact time of the corn ear is comprehensively affected by the elastic modulus of the kernels, the connection between the kernels and cob and the interaction of the kernels.
As the result of definite integral calculation, the values
of the acceleration integral were almost constant when the moisture content increased, they were 6.57, 6.60, 6.45 and 6.54 m s-1, respectively. It suggested that the kernel
mois-ture had little influence on the impact impulse when the
impact velocity kept constant.
However, the rebound time showed a phenomenal increase with the moisture content. The mean values of the rebound time were 0.218, 0.236, 0.243 and 0.265 s, corresponding to a moisture content of 11.8, 18.5, 23.4 and 30.6%, respectively. As shown in Fig. 7, the average rebound velocities were calculated to be 1.07, 1.16, 1.19 and 1.30 m s-1 according to Eq. (6). In the research of Lien
and Ting (2014), the rebound velocity of the guavas was reduced as the effects of maturity softened the fruit. The difference in the results was closely related to the kinetic energy that consumed by the detached kernels.
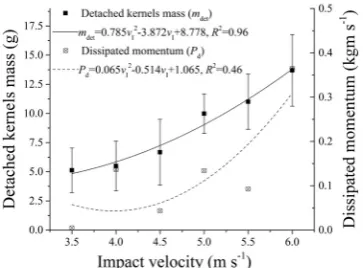
The masses of the detached kernels evidently increased with the impact velocity, as shown in Fig. 8. When the impact velocities were 3.5, 4.0, 4.5, 5.0, 5.5 and 6.0 m s-1,
the statistical averages of the masses of the detached kernels
Table 1. Impact parameters of corn ears at different kernel moisture content
CM (%) aP (m s-2) Δt (ms) Ia (m s-1) tR (s)
11.8 3 145.4±399.9 4.60±0.39 6.57±0.91 0.218±0.034
18.5 3 107.8±419.9 4.45±0.48 6.60±0.83 0.236±0.031
23.4 3 081.8±534.8 4.68±0.45 6.45±0.85 0.243±0.042
30.6 3 007.4±478.2 5.13±0.62 6.54±0.76 0.265±0.042
CM – kernel moisture content, aP – peak acceleration, Δt – impact time, Ia – integral of acceleration, tR – rebound time. Data in the table are means ± SD.
were 5.13, 5.49, 6.68, 9.99, 11.01 and 13.70 g, respectively. As the impact velocity became higher, the increase in the mass of the detached kernels became more noticeable. The
best-fit model for the mass of the detached kernels were
2-th curves. The effect of the impact velocity on kernel detachment was in accordance with that found for Špokas
et al. (2008), Srison et al. (2016) and Fu et al. (2018). According to the aforementioned Eq. (3), the dissipated momentum of the corn ears could be calculated. When the impact velocities were 3.5, 4.0, 4.5, 5.0, 5.5 and 6.0 m s-1,
the dissipated momentum values were 0.005, 0.136, 0.044, 0.134, 0.093 and 0.365 kg m s-1, respectively. In order to
show the trend of dissipated momentum with the impact
velocities, a quadric fitting curve was obtained, as demon
-strated in Fig. 8. The errors of the model were mainly from
measurement errors of the rebound velocities and random errors. However, by dividing the dissipated momentum by the mass of the detached kernels, the quotient could also be used to estimate the mean launch velocities of the detached kernels.
On the other hand, the mass of the detached kernels decreased with the increase in the moisture content, as shown in Fig. 9. When the impact velocity was 5.0 m s-1,
the average masses of the detached kernels were 12.61, 9.99, 8.03 and 7.56 g, which corresponded to moisture con-tents of 11.8, 18.5, 23.4 and 30.6%, respectively. A linear
model fitted well with the function of the moisture content
in the detachment of the kernel. Similarly, the dissipated momentum of the corn ears decreased with the moisture content, as shown in Fig. 9. The values of the dissipated momentum were 0.152, 0.134, 0.082 and 0.077 kg m s-1.
Increasing the moisture content decreased the mass of the detached kernels, as the high moisture content strengthened the internal friction between the kernels and the connec-tion between the kernels and the cobs (Burkhardt and Stout, 1974; Zhao, 2012; Li et al., 2014; Srison et al., 2016).
Figure 10 shows the corn ears after kernel detachment under different impact velocities at a moisture content of 18.5%. It may be seen in the photographs that the detach-ment of the kernels had different features as the impact velocity increased. The detached kernels were well distrib-uted around the lower end of the corn cob when the impact velocity was lower than 4.5 m s-1. As the impact velocity
increased to over 5.0 m s-1, it turns out that the detached
kernels form a ring around the bottom of the corn cob and there is a chain-like distribution on the corn ear midsec-tion. The kernels in contact with the impacting plate in Fig. 2a as well as the ones that were not in contact with the impacting plate in Fig. 2b, were all detached from the corn cob. In addition, the forces applied to the kernels met Inequality (1) for the lower impact velocities. For velocities larger than 5.0 m s-1, Inequality (1) and (2) were satisfied
simultaneously.
Similarly, the detachment of the kernel had different features with the increase in moisture content. Although the peak accelerations and acceleration integrals changed little with moisture content, as shown in Table 1, the masses of the detached kernels decreased notably with the increase in moisture content. Figure 11 shows the kernel detachment of corn ears impacted with a velocity of 5.0 m s-1 at a moisture
content 23.4 and 30.6%. It may be seen that the detached Fig. 8. Detached kernel mass and the dissipated momentum at
different impact velocities. Explanations as in Fig. 6. Error bars indicate standard deviations.
Fig. 9. Detached kernel mass and the dissipated momentum at different moisture content values. Explanations as in Fig. 7. Error bars indicate standard deviations.
kernels turn out to be the only ones out of contact with the impacting plate as a result of an increase in moisture con-tent. In other words, the forces applied to kernels out of contact with the impacting plate met Inequality (2). But for the kernels in contact with the impacting plate, Inequality
(1) was not fulfilled. Logically, this was in accordance with
the previous conclusion that the moisture content had a
sig-nificant effect on the strength of the kernel pedicels.
Hence, the detachment of the kernels in the impact was
influenced by the joint action of the impact velocity and
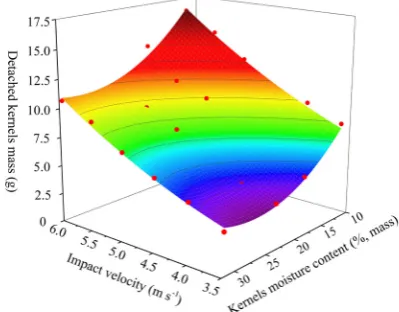
kernel moisture content. In order to establish a model of the interaction of the effect of the impact velocity and moisture content on the detached mass of the kernels, full factorial tests were conducted with the index of the detached kernel mass. The impact velocities were between 3.5 and 6.0 m s-1,
the moisture contents were between 11.8 and 30.6%. The data points in Fig. 12 represent the mass values of the detached kernels. The mass of the detached kernels increased with an increase in the impact velocity and a de- crease in the kernel moisture content. In addition, a poly-nomial 3D surface was obtained through the data points, which was in accordance with the result of Srison et al.
(2016). The fitted surface may be expressed by the follow
-ing equation:
, (7)
where: mdet is the mass of the detached kernel, g; vI is the
impact velocity, m s-1; C
M is the kernel moisture content,
%, mass.
CONCLUSIONS
The detachment of corn kernels was found to be closely related to the dissipated momentum, which may be charac-terized and calculated with the impact parameters including impact velocity, impact time, peak acceleration, impact impulse, and rebound velocity. Also, the moisture content played an important role in the connection strength between the corn kernels and the corn cob.
1. The acceleration integral was directly related to the impact velocity. As the impact time changed slightly with a decreasing trend, the peak acceleration increased
significantly with the increase in the impact velocity. The
rebound time and rebound velocity increased distinctly
with the impact velocity. The best-fit models for effects of
the rebound time and the rebound velocity on the impact velocity were 2-th curves.
2. The value of acceleration integral remained constant as the kernel moisture content changed from 11.8 to 30.6% with the impact velocity of 5.0 m s-1. The rebound
veloc-ity showed significant improvement as the moisture content
increased.
3. The dissipated momentum showed a similar trend with the mass of the detached kernels, which increased with the impact velocity and decreased with moisture content. When the moisture content remained at 18.5%, the dissipated momentum showed an upward trend with a quadratic function as the mass of the detached kernels
shows. Similarly, when the impact velocity was fixed at 5
m s-1, the dissipated momentum showed a declining trend
with the increase in moisture content, same as the line rep-resenting the detached kernels mass.
4. The detachment of the kernels had different features depending on the variation in the impact velocity and mois-ture content. Considering the parameters of the impacts, it may be concluded that the detachment of the kernels was affected by the stress on the kernels as well a s the mechanical properties of the kernels. Thus, a binary
quad-ratic equation and quadric surface were obtained for fitting
the interaction effect of the impact velocity and moisture content on kernel detachment.
Conflict of interest: The Authors do not declare
con-flict of interest.
Fig. 11. Features of kernel detachment under an impact velocity of 5.0 m s-1 at different moisture contents.
REFERENCES
Ajayi O.A. and Clarke B., 1997. High velocity impact of maize kernels. J. Agric. Eng. Res., 67, 97-104.
https://doi.org/10.1006/jaer.1997.0156
Boydas M.G., Ozbek I.Y., and Kara M., 2014. An efficient laser
sensor system for apple impact bruise volume estimation. Postharvest Biol. Tec., 89, 49-55.
https://doi.org/10.1016/j.postharvbio.2013.11.005
Burkhardt T.H. and Stout B.A., 1974. Laboratory Investigations of Corn Shelling. Tran. ASAE, 17, 11-14.
Cerruto E., Aglieco C., Gottschalk K., Surdilovic J., Manetto G., and Geyer M., 2015. FEM Analysis of effects of mechanical impact parameters on fruit characteristics. Agric. Eng. Int. CIGR J., 17(3), 430-440.
Figueroa J.D.C., Hernández Z.J.E., Véles M.J.J., Rayas-Duarte P., Martínez-Flores H.E., and Ponce-García N., 2011. Evaluation of degree of elasticity and other mechanical properties of wheat kernels. Cereal Chem., 88(1), 12-18. https://doi.org/10.1094/cchem-04-10-0065
Fu J., Chen Z., Han L., and Ren L., 2018. Review of grain threshing theory and technology. Int. J. Agric. Biol. Eng., 11(3), 12-20.
Geyer M.O., Praeger U., König C., Graf A., Truppel I., Schlüter O., and Herold B., 2009. Measuring behavior of an accel-eration measuring unit implanted in potatoes. T. ASABE, 52(4), 1267-1274. https://doi.org/10.13031/2013.27770 Hanna H.M., Kohl K.D., and Haden D.A., 2002. Machine
loss-es from conventional versus narrow row corn harvloss-est. Appl. Eng. Agric., 18(4), 405-409. https://doi.org/10.13031/2013.8744 He J., 2007. Biomimetic surface on snapping rolls with lower
damage action and simulation of no-row feed-in mecha-nism of maize harvesters (in Chinese). Ph.D. Thesis, Jilin University, Changchun, China.
Jiménez-Jiménez F., Castro-García S., Blanco-Roldán G.L., Agüera-Vega J., and Gil-Ribes J.A., 2012. Non-destructive determination of impact bruising on table olives using ViseNIR spectroscopy. Biosyst. Eng., 113, 371-378. https://doi.org/10.1016/j.biosystemseng.2012.09.007 Kalkan F., Kara M., Bastaban S., and Turgut N., 2011. Strength
and frictional properties of popcorn kernel as affected by moisture content. Int. J. Food Prop., 14, 1197-1207. https://doi.org/10.1080/10942911003637319
Li X., Du Z., Ma Y., Gao C., and Ma F., 2014. Discrete analysis of maize ear at different impact head. A. M. M., 651-653,
323-327. https://doi.org/10.4028/www.scientific.net/
amm.651-653.323
Li Z., Liu J., Li P., and Yin J., 2009. Study on the collision-mechanical properties of tomatoes gripped by harvesting
robot fingers. Afr. J. Biotechnol., 8(24), 7000-7007. Lien C.C. and Ting C.H., 2014. Assessing guava maturity by
statistical analyses of dropped fruit impact responses. Postharvest Biol. Tec., 95, 20-27.
https://doi.org/10.1016/j.postharvbio.2014.03.013
Lin F. and Zhang Y., 2017. An impulse based model for impact between two concrete blocks. Int. J. Impact Eng., 107, 96-107. https://doi.org/10.1016/j.ijimpeng.2017.04.019 Lu F., Ishikawa Y., Kitazawa H., and Satake T., 2010.
Measurement of impact pressure and bruising of apple fruit
using pressure-sensitive film technique. J. Food Eng., 96,
614-620. https://doi.org/10.1016/j.jfoodeng.2009.09.009
Paulsen M.R., de Assis de Carvalho Pinto F., de Sena Jr D.G., Zandonadi R.S., Ruffato S., Gomide Costa A., Ragagnin V.A., and Danao M.-G.C., 2013. Measurement of Combine Losses for Corn and Soybeans in Brazil. Appl. Eng. Agric., 30(6), 841-855. https://doi.org/10.13031/aim.20131570965 Petrů M., Novák O., Herák D., and Simanjuntak S., 2012. Finite
element method model of the mechanical behaviour of Jatropha curcas L. seed under compression loading. Biosyst. Eng., 111, 412-421.
https://doi.org/10.1016/j.biosystemseng.2012.01.008 Qian Z., Jin C., and Zhang D., 2017. Multiple frictional impact
dynamics of threshing process between flexible tooth and
grain kernel. Comput. Electron. Agr., 141, 276-285. https://doi.org/10.1016/j.compag.2017.07.022
Shahbazi F., 2011. Impact damage to chickpea seeds as affected by moisture content and impact velocity. Appl. Eng. Agric., 27(5), 771-775. https://doi.org/10.13031/2013.39557 Shahbazi F., Saffar A., and Analooei M., 2011. Mechanical
dam-age to navy beans as affected by moisture content, impact velocity and seed orientation. Qual. Assur. Saf. Crop., 3, 205-211. https://doi.org/10.1111/j.1757-837x.2011.00114.x Singh S.S., Finner M.F., Rohatgi P.K., Buelow F.H., and
Schaller M., 1991. Structure and mechanical properties of corn kernels: a hybrid composite material. J. Mat. Sci., 26, 274-284. https://doi.org/10.1007/bf00576063
Srison W., Chuan-Udom S., and Saengprachatanarak K., 2016. Effects of operating factors for an axial-flow corn
shelling unit on losses and power consumption. Agric. Natural Res., 50, 421-425.
https://doi.org/10.1016/j.anres.2016.05.002
Srivastava A.K., Herum F.L., and Stevens K.K., 1976. Impact parameters related to physical damage to corn kernel. tran. ASAE, 19(6), 1147-1151. https://doi.org/10.13031/2013.36191 Stropek Z. and Gołacki K., 2013. The effect of drop height on
bruising of selected apple varieties. Postharvest Biol. Tec., 85, 167-172.
https://doi.org/10.1016/j.postharvbio.2013.06.002
Stropek Z. and Gołacki K., 2015. A new method for measuring impact related bruises in fruits. Postharvest Biol. Tec., 110, 131-139.
https://doi.org/10.1016/j.postharvbio.2015.07.005 Stropek Z. and Gołacki K., 2016. Quantity assessment of plastic
deformation energy under impact loading conditions of selected apple cultivars. Postharvest Biol. Tec., 115, 9-17. https://doi.org/10.1016/j.postharvbio.2015.12.011
Studman C.J., 2001. Computers and electronics in postharvest technology – a review. Comput. Electron. Agr., 30, 109-124.
Špokas L., Steponavičius D., and Petkevičius S., 2008. Impact of technological parameters of threshing apparatus on grain damage. Agronomy Research, 6, 367-376.
Wang G., Jia H., Tang L., Zhuang J., Jiang X., and Guo M., 2016. Design of variable screw pitch rib snapping roller and resi-due cutter for corn harvesters. Int. J. Agric. Biol. Eng., 9(1), 27-34.
Xu L.Z., Li Y.M., Ma Z., Zhao Z., and Wang C.H., 2013. Theoretical analysis and finite element simulation of a rice
kernel obliquely impacted by a threshing tooth. Biosyst. Eng., 114, 146-156.
Yan H., 2009. Working mechanism and experimental research on key components of vertical roll-type corn harvester (in Chinese). Ph.D. Thesis, Jilin University, Changchun, China. Yang L., Cui T., Qu Z., and Zhang D.X., 2016. Development and application of mechanized maize harvesters. Int. J. Agric. Biol. Eng., 9(3), 15-28.
Yang Y. and Schrock M.D., 1994. Analysis of grain kernel rebound motion. Tran. ASAE, 37(1), 27-31.
https://doi.org/10.13031/2013.28049
Yousefi S., Farsi H., and Kheiralipour K., 2016. Drop test of pear
fruit: Experimental measurement and finite element model -ling. Biosyst. Eng., 147, 17-25.
https://doi.org/10.1016/j.biosystemseng.2016.03.004 Zareiforoush H., Komarizadeh M.H., and Alizadeh M.R., 2010.
Effects of crop-machine variables on paddy grain damage during handling with an inclined screw auger. Biosyst. Eng., 106, 234-242. https://doi.org/10.1016/j.biosystemseng.2010.02.008