Usability Study
Mohd Shahmy Mohd Said
a,b, and David Forrest
aa School of Geographical and Earth Sciences, University of Glasgow, United Kingdom, [email protected], School of Geographical and Earth Sciences, University of Glasgow, United Kingdom, [email protected] b Centre of Studies for Surveying Science and Geomatics, MARA University of Technology, Malaysia
Abstract:
This study represents the final stage of an investigation into understanding the variation in bus map design and the impact of map design preferences in public transportation information portrayal, with a particular focus on Malaysia. In many cities, bus services represent an important facet of easing traffic congestion and reducing pollution. However, with the entrenched car culture in many countries, persuading people to change their mode of transport is a major challenge. To promote this modal shift, people need to know what services are available and where (and when) they go. Bus service maps provide an invaluable element of providing suitable public transport information, but are often overlooked by transport planners, and are under-researched by cartographers. There are various approaches to the design of bus maps, but it is always an issue for the authorities to understand which designs are preferred by the public and which perform best in conveying the required information. A total of 100 Malaysians completed six journey-planning tasks using two network bus maps, which were different in designs. The two bus map designs involved in this study are based on previous map analysis research.
The study found that majority of respondents were competent as they successfully completed the journey planning task, with more than 80 percent of the tasks being answered correctly. Additional enquiries proved that the effective design used in a bus map can attract more users to use public transportation, thus provide evidence that map availability can play a part in enhancing public transport ridership.
Keywords: Map design, Public transport mapping, Map usability study
1. Introduction
One of the main goals of providing public transport information is to enhance ridership and bring more revenue to the public transport provider (National Academies of Sciences Engineering and Medicine, 2004). Providing the mass market transit information is a task for transit providers with additional assistance from local councils. This mass market transit information could come in various types of media and delivered in various kind of material. Stakeholders contribute significant time and resources in producing and developing the information material, and subsequently keeping the materials up to date with current situation (Cain, 2007).
However, the public transport stakeholder is quite concern about the effectiveness of these produced material in aiding the user’s journey-planning ability. There are relatively limited previous studies in the field of bus mapping and bus map information provision, thus a literature review does not bring any major knowledge in understanding how the users use the information material
and how effective the current map design is in planning their journey.
This research focuses on the whole network bus system map being delivered as printed material. The first part of this research managed to highlight the important design elements of a bus network map. For more information to the first part of this research, see (Mohd Said & Forrest, 2018). In this second part, the findings from a map usability test are presented, simultaneously answering the question on how effective bus network maps might be in increasing bus ridership.
1.1 The Importance of Public Transport Information
Public transport information is beneficial in guiding passengers on how to successfully use the services. According to Lyons (2006), there are tree influential roles of public transport information:
2. Entrust the individual in making a better, well-informed travel choice.
3. Help the individual in undertake and completing a journey successfully.
When the passenger tries to do a journey, the passengers will compare all the travel options that fulfils their needs. The regular passenger may not need a lot of a travel information. This type of passenger will make an identical journey from the same starting position to the same destination, using the similar services at the same time of day , regularly, often every weekday (Garland, Grubb, & Haynes, 1979). This constant nature of travel has made these passengers aware about travel information needed for their journey. Additional travel information is only needed if there any alteration to the service that they normally use. The regular passenger will need new information if there is a big change to the timetable and/or the route network, or when their routine services is discontinued.
A study completed by Balcombe & Vance (1998), found that 83% of their respondents stated that they did not need any travel information in making a regular journey. The percentage of respondent that said they did not need any information reduced to 67% when asked to plan an occasional journey and only 7% of respondent said they would not require any information when planning a new journey. This study highlighted the needs of travel information across all passenger types, with the amount of information needed in different situations. Passengers demand a public transportation system that is straightforward to use, has clear instruction and a system that makes them feel confident to use and have control of their situation (Lodden, 2002). Good travel information provision is an inexpensive way to enhance the passenger confidence in using public transport, which at the same time will eradicate any negative feelings and improve the passenger trust toward public transport services in general (Derek Halden Consultancy, 2003).
In order to materialise a modal shift in the public transportation usage, Lodden (2002) has further stressed out that the public transportation system must emerge as a complete and effective system. This is regardless of the complexity of the journey, how far the distance travelled, how familiar passengers are with the transport system and how many public transport providers operate at a certain place. Limited availability of services knowledge should not be a major impediment to people using public transport to complete their journey.
1.2 Study Objective
This research aims to investigate one of the potential flaws that contribute to this poor public transport use, which is the lack of effective ‘Whole-Network’ public transportation maps and whether a new design of Whole-Network mapping can eradicate user’s confusion during the journey planning process involved when they plan to travel by bus around their local area (urban transportation). The availability of such information will make it much easier for the users to understand what the whole service
provision is really offering to them, thus enable them in making an informed decision during the journey-planning process.
1.3 Study Design
To investigate the effectiveness of the new design of whole networks bus map, a map usability test was performed. A suitable sample of respondents, bus travellers, and bus passenger was sought through a purposive sampling method. A total of 100 respondents were interviewed in several public location across the research area. The respondents were tested with six of journey planning task to gauge the effectiveness of the newly designed maps. The responses obtained between two different designs of whole networks maps are then compared to identify the most effective map form for that research area. Additional questions related to user’s demographic background, current bus usage, and their feeling towards the tested map, were also asked to help understand the demographic factor effect. They were also asked about the possibility of greater bus use should the maps become available in their area.
2. Study Methodology
A map usability study was conducted during which bus users and potential bus users had to solve several journey planning tasks using two different designs of whole-network bus maps. The main research materials involved in this study are the two newly-designed whole network bus maps and the questionnaire form. The questionnaire form contained the questions related to demographic background and the journey planning task of the map usability testing. The respondent needs to refer to the two bus maps to complete the test and subsequently finish their task. The two different map designs used are the geographically correct bus map design and the semi-schematized bus map design. The distinguishing aspect of these two bus maps is only in their overall map design format. Both maps have the identical bus route and bus information details together with the cartographic representation’s aspect, classification, typography and symbolization. The basis of these two designs is the findings of the first stage of this study, which reviewed the important cartographic design considerations that need to be considered when creating a network bus map.
This test has been conducted in two different environments. The first environment is in the closed room (controlled environment) and the second area is at public transportation hub/station (open environment). These two different areas were chosen to simulate the real conditions when bus user want to plan their journey, either by planning their bus journey trip at their home or by instantaneously plan it while they are at outside.
In the controlled environment (mainly at higher learning institutions across the research area), respondents filled out the questionnaire form that contains questions about their demographic background then completed a series of journey planning task. In this task, respondents refer to the two bus map designs while solving their task. For the testing in the open environment area, as there is a limited time window with respondents at a public transportation hub/station, the respondent will need to complete the journey planning task first before filling up the demographic information section.
The questionnaire framework is focused on the completion of journey-planning tasks. To make things easier for the respondent, the questionnaire is divided into two parts. The first part is a demographic part. In this, questions were asked about the respondent’s background and current travel pattern including their experience in using the bus. The second part contains the journey-planning tasks. In this second part, the questionnaire was further divided into three subparts. The first subpart is about the journey-planning task based on the first map design and the second subpart will need the respondent to complete the journey planning task based on the second map design. Each subpart needs the respondent to complete three transit trip planning tasks. Finally, the last subpart measures the respondent’s feedback, preferences, and comments based on the two journey planning tasks.
3.
Results and AnalysisThe main outcomes of this usability study were analysed statistically, starting with descriptive statistical analysis of all possibly influencing factors of map preferences (independent variable data) like age, gender, travel habits, driving license availability, among others. These data were then cross-analysed with the findings from the map usability test, ranging from the respondent performance based on the correctness of an answer, to their opinions about the maps which includes the ease of use while using the map, the confidence level in using the map and their personal map design preference.
The analysis of the field test will evaluate the potential impact of the ‘Whole-Network’ bus map and the map preference among user in the research area. This analysis is in the form of a detailed statistical analysis of various aspects of the map usability testing, to compare the performance of both maps. The statistical analysis will start with descriptive analysis of data for all independent and dependent variables. This analysis will give direct findings on the following independent variables:
1. Demographic variables: such as age and gender of respondents.
2. Travel behaviour variables: such as availability of driving licenses, access to a car, and frequency of bus use.
The Likert scale feedback gathered from the questionnaire will not be assumed to be continuous therefore non-parametric test will be used if suitable (Allen & Seamen, 2007). A Kruskal-Wallis one-way analysis (non-parametric test) were performed to gauge the respondent’s
confidence level. The non-parametric statistical analysis will give finding for these variables:
1. Ease of map use;
2. Confidence level in using the bus map; 3. Increasing future bus use through maps.
3.1 Statistical Techniques Used
The map usability test gathered several results, ranging from the respondent performance based on the correctness of an answer to their opinions about the maps (ease of use of the map, the confidence level in using the map and their map preference). For the nominal data, the analysis was done in a direct way (descriptive statistic). For the categorical data, the analyses were done using non-parametric statistical analysis. The statistical analysis was completed using non-parametric procedures as the data collected for this study come from independent observations, random in sampling and deemed not to be continuous (Pallant, 2016). Likert scales have been used to gather the information for some of dependent variables in this study. As mentioned early, the most suitable way to analyse the Likert scale data are by using non-parametric procedures such as chi-square test, Mann-Whitney U Test, and Kruskal- Wallis Test. (Allen & Seamen 2007).
3.2 Effectiveness of Whole-Network Bus Maps
The effectiveness of the two bus map forms will be measure on three criteria. The first criteria is the journey-planning task’s correctness; the second is by the respondent’s rating on the ease of map use; and the final criteria is the respondent’s confidence level while using the map.
3.2.1 Degree of Answer Correctness
To examine the answers given by the respondents, all the valid answers were allocated to one of four possible categories of correctness. This category was derived from the technique used by Morrison and Forrest (1995).
1. Correct Service and Optimum Answer 2. Correct Service, but Non-Optimum Answer 3. Wrong Service
4. No response
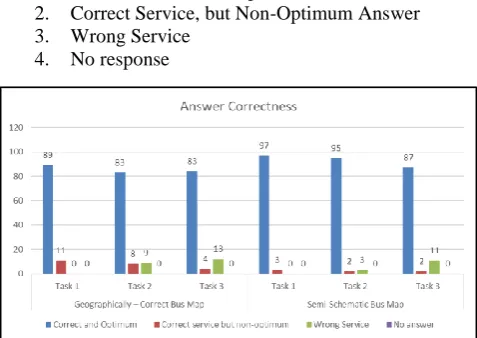
Figure 1.1: Degree of Answer Correctness
High number of respondents were able to give a correct and an optimum answer for all the tasks undertaken. Overall, 534 tasks (89%) were done in a correct and optimum way, with only 30 tasks completed correctly but not in an optimum way. Task 1 saw all the respondents give the correct answer. The wrong answers can be seen in Task 2 and Task 3, with Task 2 being performed better that Task 3.
These results indicate that respondents were slightly more successful in using the whole-network bus map in semi-schematic form rather than in the geographically-approach bus map form. However, the extremely high percentage of correct and optimum answers given by the respondents proves that either type of network map could help travellers in planning their bus journey.
3.2.2 Ease of Map Use Rating
The respondents were then asked about how easy they found it to plan their journey and how confident they felt when planning their journey in each map format. The usage of the Likert scale to gauge the respondent’s opinion in this matter can help to get a more defined answer and provide consistency.
For the ease of use, each respondent needed to rate how easy they found using each bus map form to complete the journey-planning task. The rating score is in the scale of 1 to 5, where: 1 = Very Difficult, 2 = Slightly Difficult, 3 = neither Easy nor Difficult, 4 = Slightly Easy, 5 = Very Easy.
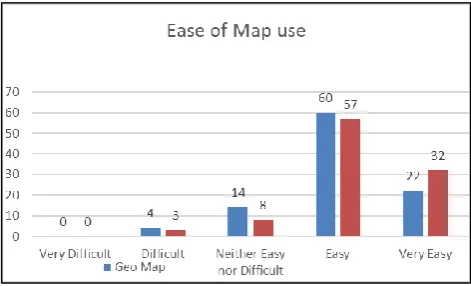
The result of the ease of use rating for each form of the map is shown in figure 1.2
Figure 1.2: Ease of Map Use Rating
Overall, 89% of the respondents stated that they found it ‘very easy or easy’ to use the semi-schematic map when planning their journey planning task, compared to 81% for the geographical-approach bus map. At the other end of the scale, 3% of the respondent said that the Semi-schematic map was ‘difficult or very difficult’ to use, compared to 4% for the geographical-approach bus map.
A Wilcoxon Signed Rank test revealed a statistically significant relationship in terms of Ease of map use between the two map forms, z = -2.116, p = 0.034, with effect size (r = .21). The result above are similar to what we have found under a different quantitative measure (aggregate questionnaire analysis).
3.2.3 Confidence Level in using the Bus Map
It is also important to find the confidence level of respondents to know which form of the map that they feel more comfortable using. They are more likely to use the bus if they feel confident about their journey and surely, this will put more faith in bus transportation systems in the future. The right form of map can instil the belief that the bus system is efficient and easy to use, and they know they can complete the correct journey with confidence. Respondents were asked to rate how confident they were in the answer they made in each journey-planning task. The rate is once again on the scale of 1 to 5, where: 1 = Not at All, 2 = Not Confident, 3 = Neither Confident or not, 4 = Fairly Confident, 5 = Very Confident
The result of the confidence level rating for each form of map is shown in figure 1.3.
Figure 1.3: Confident Level Rating
In general, 90% of respondents felt confident when using the semi-schematic bus map, compared to 83% when using the geographical-approach bus map. Zero respondents felt completely not confident to use either of these network maps, leaving only 10% of them that were unsure of their confidence in using Semi-schematic map and 17% for the geographical-approach bus map.
A Wilcoxon Signed Rank test revealed a statistically significant relationship in terms of confidence level in using these the two map forms, z = -2.229, p = 0.02, with effect size (r = .23). The result above are similar to what we have found under a different quantitative measure (aggregate questionnaire analysis).
3.2.4 Map Preferences
Figure 1.4: Map Preference
3.2.5 Potential Future Bus Use
Previously the analysis and results have shown how the respondents react to usage and their preferences for both maps. With the help from the maps, the respondents not only managed to correctly answer the journey planning task, but they also appear to have greater confidence and do not have any major difficulty while performing the task on either map.
There is one question left to answer: will the maps help to increase bus usage in the future? The answer to this question might attract the bus provider’s and local authority’s interest if maps can increase the number of bus users, which will not only bring more revenue to the bus provider, but also helps the local authority in promoting a modal shift to public transport usage.
Respondents were asked to rate how likely they would be to use the bus in the future should the suitable maps become widely available in their area, in a scale from 1 = Very Unlikely, to 5 = Very Likely. Similar to the previous map preference approach, the inputs given by the respondent need to be treated with extra caution to avoid bias. In this question, the respondent may compare their experience in using the new bus map form with their previous experience in using the bus.
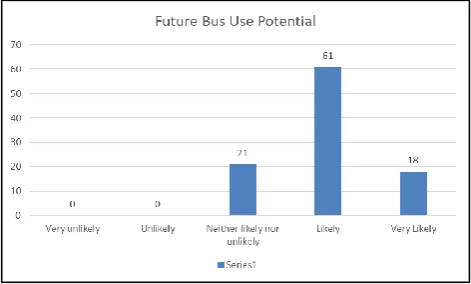
Figure 1.5: Future Bus Use Potential
The bar graph presents the breakdown of respondent’s responses regarding their potential to use the bus in the future. Generally, the respondents felt that the network bus map, should it become available, could indeed influence them to use the bus in the future. As shown in the graph above a total of 79% of respondents rated that they are likely or very likely to increase their future bus usage. This
is a clear indication that a new network map, should it become available, can help to increase future bus usage. The median score through the whole sample is 4, suggesting that more widespread availability of network bus maps could have a strong impact on the future of bus use. Only 21% of the respondent were unsure whether these maps could persuade them to use the bus more frequently in the future. Some respondent stated that there are no bus services that directly connected to their home and there were several further comments about bus services being too impractical for their daily life routine. Given this situation, there is little possibility that they will increase their future bus use without improving other aspects of bus services.
A Mann-Whitney U test revealed no significant difference in for the future bus use of Geo Bus Map (Md = 4, n = 33), and Semi-Schematic Bus Map (Md = 4, N = 67), U = 1186.5, Z = .0.682, p = .495. This means that the user acknowledges a network map will bring improvement to the current bus transportation system, regardless the map design.
4. Conclusion
In general, the results show the respondents prefer to use the semi-schematized bus map design rather than the geographical-approach bus map design. Their map preference’s selection is well explained by their performance in the journey-planning tasks and subsequent answers to the questionnaire. The semi-schematized design had more task correctness than when the task is done using the geographically true design. This degree of correctness that favours semi-schematized design shows the same pattern across all genders, ages, and travel habits, and is decisively supported by the confidence level ratings and ease of map use ratings. This means that the map preference selection has no bias towards any influence factors.
As a conclusion, this study has brought much needed insight into the public transport information provision, especially for the Malaysia’s public transport system. There has notably lack of research in this field in Malaysia. The findings from this study have highlighted the benefit of using the right cartography technique to enhance public transport information provision and improve the use of the public transport system. In addition, respondents across all age groups say they would be willing to make greater use of public transport if there were more of these kinds of maps available. Although this is only predictive statement of a future behaviour, this have showed the importance of encouraging stakeholders to provide useful, well designed, map information to meet the needs of users and potential users of public transport
Apart from the continuous improvement in physical aspect of public transport system, a well-designed public transport map that balances the correct cartographic technique with local cultural preferences certainly can help authorities and public transport providers in encourage the modal shift from the regular use of private cars to more frequent use of public transport system.
33
67
0 20 40 60 80
Geo bus map Semi-schematic bus map
Map Preference
5. References
Allen, I. E., & Seamen, C. A. (2007). Likert Scale and Data Analyses. Quality Progress, 40(7), 64–65. Balcombe, R. J., & Vance, C. E. (1998). Information for
bus passengers: a study of needs and priorities. Berkshire, UK.
Cain, A. (2007). Are Printed Transit Information Materials a Significant Barrier to Transit Use ?
Journal of Public Transportation, 10(2), 33–52. Derek Halden Consultancy. (2003). Barriers To Modal
Shift. In Scottish Executive Social Research Report. Retrieved from
https://www.gov.scot/Resource/Doc/47176/002688 7.pdf
Garland, H. C., Grubb, G. C., & Haynes, J. J. (1979). Transit Map Color Coding and Street Detail: Effects on Trip Planning Performance. Environment and Behavior,11(2),162–184.
https://doi.org/10.1177/0013916579112002 Lodden, U. B. (2002). Simplifying Public Transport.
Nordic Road and Transport Research, (1), 23–25.
Mohd Said, M. S., & Forrest, D. (2018). Classifying the Diversity of Bus Mapping Systems. Proceedings of the ICA. https://doi.org/10.5194/ica-proc-1-78-2018 National Academies of Sciences Engineering and
Medicine. (2004). Traveler Response to
Transportation System Changes Handbook, Third Edition: Chapter 11, Transit Information and Promotion. In The National Academies Press
(Third Edit). https://doi.org/10.17226/23386 Pallant, J. (2016). SPSS Survival Manual 6th Edition