Levels of Development and Development Potential: An
Approach in Integrated Rural Area Development Plan,
South 24 Parganas District, West Bengal, India
*Sakti Mandal
1, Pratima Rohatgi
21Assistant Professor, Department of Geography, Sripat Singh College, Jiaganj, India 2Associate Professor, Department of Geography, University of Calcutta, Kolkata, India
Disparity in levels of development is prime concern for all those who seek a balanced socio-economic development of a country as a whole. Inter-regional and intra-regional comparisons become necessary, so that the exercise in planning may be directed towards the elimination of imbalances in development also. Geographer, sociologists, economists and planners have often tried to measure the actual levels of development and the development potentials of various regions within a country and, in particular, have suggested ways and means for the development of backward areas. Kedekoli and Singh (1975), using the Pattern Recognition Techniques for identifying back-ward regions, have concluded that the riverine island region of the district South 24 Parganas is least development part of the State of west Bengal. Pal (1975), who selected 17 variables from four specific groups and computed, at block level, the regional disparities in development, found South 24 Parganas as one of least developed district of the country. Consequently, special efforts have to be made for removing the backwardness of the district. In this article, an attempt has been made to measure, block wise, the existing levels of socio-economic development as well as the development potentials so that an integrated area development plan can be formulated for the district.
Keywords: Development Potential, Regional Disparities, Integrated area development.
INTRODUCTION
Development is a multidimensional phenomenon, which not only brings out qualitative changes, but also quantitative growth of society. It has been appropriately conceptualized as a process, which improves the quality of life of people (Siddiqui et.al. 2010). For accelerating the growth of a society in a sustainable manner, it is necessary to ensure balanced regional development process. Due to uneven distribution of physical as well as human resources and socio-economic diversities, an immense inter and intra-regional disparities is found across the regions which is the matter of great concern for both developed and developing countries of the world. Time to time Government. planning keeps an objective to wipe out the disparity persisting among different region by adopting the regional interest as well as available resource potentials.
India being characterized with diversified physical as well as socio-economic characteristics shows wide regional disparity in terms of levels of development. In post-independence period, major emphasis was given in achieving balanced regional development by introducing various forms of regional planning in the country. Removal of regional imbalances in development has remained the declared goal of planning in India (Mohan2005) but varied socio-political situations of the country laid the achievement of developmental planning far away from satisfactory level.
*Corresponding author: Sakti Mandal, Assistant Professor, Department of Geography, Sripat Singh College, Jiaganj, India. E-mail: [email protected]
Journal of Agricultural Economics and Rural Development
Vol. 4(1), pp. 372-380, March, 2018. © www.premierpublishers.org, ISSN: 2167-0477
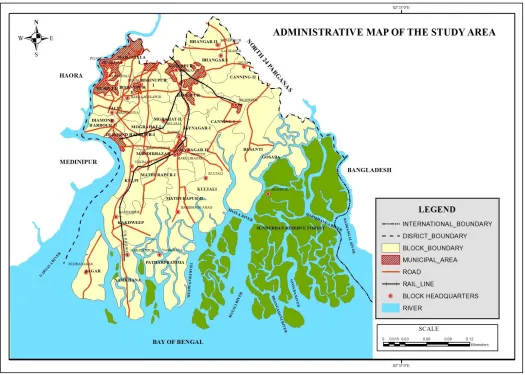
Figure 1: The Study Area
Since the disparity spread not only in macro and meso region but also in micro scale, planners gave much importance upon decentralized planning process based upon intensive study of micro level region. At such circumstances, micro level study based upon the availability of information (either Panchayat level or at least block level) significantly contributes in assessing the gap of planning strategy and promote balanced regional development even for micro region.
STUDY AREA
South 24 Parganas is, indeed, a complex district, stretching from the metropolitan Kolkata to the remote riverine villages’ up to the mouth of Bay of Bengal. The district is located between 22°33′ 45″ and 21° 29′ 00″ North and 89° 04′ 50″ and 88° 03′ 45″ East longitudes. The district covers an area of 9,960 Sq. km and total population comes to about 8,153,176 persons as per 2011 census. The agriculture area of the district is 368.197 Sq. km. and rice production area is 313.402 Sq. km. (85.11 %) in 2010-2011. Only 33.02 percentage of irrigated area are out of the total cultivated area and above 45 % people is engaged in agriculture and allied activities of total main working population in the district (District Statistical
Handbook 2015). 74.39% of the population lives in the rural areas, where development is taken care of by the Panchayat bodies.
The present district of South 24 Parganas came into existence on 1st of March, 1986. The Sunderbans, the largest mangrove forests on earth, are spread over thirteen of the twenty-nine development blocks in the district. Due to its peculiar geographical location and the dictates of geography, the means of transport and communication in this region are not well developed, with all the attendant consequences. Lack of irrigation has meant mono-cropped agriculture. Breaches in earthen embankments and cyclonic storms mean loss of life and destruction of crops and property on a regular basis. Any development strategy in this ecologically fragile environment must be carefully designed and implemented.
Objectives
2. Examine the socio-economically backward areas and categorize them into various levels of development and to identify various factors behind the emergence and growth of disparities in the district.
3. Finally, to measure the extent of overall inter-regional disparities with the indicators of development in South 24 Parganas district and finally find out the relationships among different factors which lead to the development.
DATABASE AND METHODOLOGY
Level of development of a region is concerned with the inequality in the existing developmental phenomenon prevailing among its component areal units. In the present analysis blocks have been taken as the component areal unit of the study area. Development is a multi-dimensional phenomenon and each of these dimensions is measured by different units. For the identification of the level of the development and its relation, I have been selected 34 indicators under seven major categories i.e. education, health, communication and transportation, market, electricity and drinking water, agriculture, finance and recreation.
The study is based upon secondary source of data. The data mostly being concerned with levels of development have been procured from Primary Census Abstract (2011) of South 24 Parganas. Some basic statistics have also been collected from District Statistical Handbook of South 24 Parganas (2012), published by Bureau of Applied Economics and Statistics, Government of West Bengal. Levels of development in South 24 Parganas district has been measured using the following 34 indicators chosen purposively from different sectors of society.
Measurement of Development
The levels of development can be measured by a number of indicators, including Gross Nation/Regional product or Gross Domestic product. But GNP may be increase, while the per capita income within a small region may decline. Principal component originally developed by psychologist Hetelling (1933) and later adopted by Hagood (1943) and Berry (1968), helps to obtain a composite index of measuring development. Barnett (1951) constructed a non-monetary index of development to focus attention on international disparities. Dasgupta (1971) and Mitra (1961 and 67) in India, have used discriminate analysis for classifying the development levels on ranking basis. Pathak, Aziz and Chattopadhyaya (1970) have developed an equal correlation method for identification of planning Areas development in parts of Bihar, Orissa and west Bengal. Rao (1973) has used multivariate factor analysis for measuring economic development among the different States of the country. Several other writers have also used different methods to compare the levels of development.
Srivastava (1982), following Polish mathematicians and UNESCO recommendations, suggested the use of taxonomic method (WROCLO Taxonomy), which provides indices for ranking the development levels of different regions of sub regions. This method has been used, in the present paper, to measure the levels of socio-economic development and development potential of 29 blocks of South 24 Parganas district.
Taxonomic Method
The taxonomic method is based on the concept of average values and can be computed as follows: Let a set of ‘n’ points represents regions 1,2,3,………n for a group of indicators 1,2,3,……m which can rep[resented by a matrix below:
X1.1, X1.2 ………X1m
X2m X22 ………...X2m
Xn1 Xn2 ………Xnm
The absolute value of indicators for a set of given regions cannot be computed as such. Hence, the values of indicators have been converted into standard values by the following known formula so that comparable indices may be derived:
Zij = 𝑿𝒊𝒋−𝑿⎺𝒋
𝑺𝒋
i =1,2,3,………n j = 1,2,3,…………..m
Where, Zij = Standard value of ‘j’th indicator for ‘i’th region.
X⎺j = ∑𝑋𝑖𝑗
𝑛 Si = √∑
(𝑋𝑖𝑗−𝑋⎺𝑗)2 𝑛
Where, Xij = the value ‘j’th indicator for ‘i’th region. The standard values are then input in another matrix as follows:
Z11, Z12, Z13………Z1m
Z21, Z22, Z23……….Z2m
Z31, Z32, Z33. ………...Z3m
Taking the highest or best standardized values of indicators of development, a simulated ideal region (c) is created and the distances between each standardized value of selected indicators are calculated. These are again put in another matrix, from which the pattern of development is calculated by the following formula:
Cio =
√∑
𝒎𝒌=𝟏(𝒁𝒊𝒌 − 𝒁𝒐𝒌)𝟐
Where, Cio = Pattern of development of ‘i’th region. Zik = Standardized value of ‘j’th indicator for ‘i’th region. Zok = Highest or best standardized value of ‘j’th indicator.
Di =𝑪𝒊𝒐
𝑪𝒐
Where,
Di = Development index Cio = Pattern of development
Co = Mean +3sd of Cio
Thus, the development index is a function of pattern of development and the critical distance from the simulated ideal region. It ranges from 0 to1. Nearness of the development index to 0 indicates greater development, whereas its nearness to 1 indicates poor development.
RESULT AND DISCUSSION
Analysis of Socio-Economic Development
The following 29 indicators (data for 2010-11) have been used for measuring the levels of socio-economic development in 29 blocks of South 24 Parganas district:
1. Density of Population per sq. km. 2. Percentage of Decadal Growth Rate, 3. Percentage of Worker to Total Population, 4. Urban population as per cent of total population, 5. Percentage of Agricultural Labour to Total Worker, 6. Percentage of Workers in Household Industries, 7. Sex Ratio,
8. Percentage of Literate to Total Population,
9. Percentage of area covered to total geographical area, 10. Percentage of Net Cultivated Area to Total
Geographical Area,
11. Percentage of Gross Cropped Area to Total Geographical Area,
12. Percentage of Gross Irrigated Area to Gross Cropped Area,
13. Fertilizer consumption per hectare of cropped area, 14. Gross value of agricultural produce per agricultural
workers,
15. Gross value of agricultural produce per hector of net sown area,
16. Cropping Intensity,
17. Length of surfaced roads per 100 km of all roads, 18. Number of Primary Schools Per Lakh of Populations, 19. Number of Upper Primary Schools Per Lakh of
Populations,
20. Number of Regulated market per 10,000 Population, 21. Number of Settlements with electric facility for
domestic purpose to total settlements,
22. Number of Settlements Having Tap Water Facility to Total Inhabited Settlements,
23. Number of Commercial Bank per 100,000 of populations.
24. Number of Co-operative society per 100,000 of populations,
25. Number of fair price shop per 100,000 of populations,
26. Number of hospitals, dispensaries and health centers per 10,000 of populations,
27. Number of hospital beds per 10,000 of populations, 28. Number of doctors per 10,000 of populations.
It is noted that the indicators relate to developments in agriculture, secondary and tertiary activities, urbanization, infrastructural facilities and socio-cultural attitudes. The standard values of the indicators have been obtained blockwise so that the pattern of development and development index can be computed.
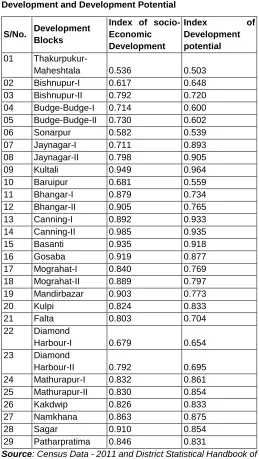
Table 1 gives the development indices for each block. These have been grouped into three socio-economic development levels, namely High, Medium, Low, by the standard deviation grouping techniques. (Table 2).
Table 1: Block-wise Indices of Socio-Economic Development and Development Potential
S/No. Development Blocks
Index of socio-Economic Development
Index of Development potential
01
Thakurpukur-Maheshtala 0.536 0.503
02 Bishnupur-I 0.617 0.648
03 Bishnupur-II 0.792 0.720
04 Budge-Budge-I 0.714 0.600
05 Budge-Budge-II 0.730 0.602
06 Sonarpur 0.582 0.539
07 Jaynagar-I 0.711 0.893
08 Jaynagar-II 0.798 0.905
09 Kultali 0.949 0.964
10 Baruipur 0.681 0.559
11 Bhangar-I 0.879 0.734
12 Bhangar-II 0.905 0.765
13 Canning-I 0.892 0.933
14 Canning-II 0.985 0.935
15 Basanti 0.935 0.918
16 Gosaba 0.919 0.877
17 Mograhat-I 0.840 0.769
18 Mograhat-II 0.889 0.797
19 Mandirbazar 0.903 0.773
20 Kulpi 0.824 0.833
21 Falta 0.803 0.704
22 Diamond
Harbour-I 0.679 0.654
23 Diamond
Harbour-II 0.792 0.695
24 Mathurapur-I 0.832 0.861
25 Mathurapur-II 0.830 0.854
26 Kakdwip 0.826 0.833
27 Namkhana 0.863 0.875
28 Sagar 0.910 0.854
29 Patharpratima 0.846 0.831
Source: Census Data - 2011 and District Statistical Handbook of
The analysis shows that the blocks of Thakurpukur-Maheshtala, Bishnupur I, Sonarpur, Baruipur and Diamond Harbour I are high level ofdevelopment, while Namkhana, Sagar, Kultali, Bhangar II, Basanti, Gosaba, Mandirbazar, Mathurapur II, shows the low development level. The development of Budge-Budge I and II, Bishnupur II, Diamond Harbour II, Jaynagar I and II blocks are average level. However, as the index of the level of development of even the highly developed block is 0.536 and 0.582, i.e. far from zero, the overall development of the district works out to be very low.
Development potential
Development potential depends upon the interaction of demographic potential, resource potential and infra-structural potential (singh and routray 1980). The resource potential which is the most important among these can be specifically measured in terms of forest resource, mineral resource, land resource and water resource. For assessing the development potential of different blocks of south 24 parganas district, the indicators taken as under: 1. Density of Population per sq. km,
2. Percentage of Working population to Total Population, 3. Percentage of Agricultural Labour to Total Worker, 4. Percentage of Workers in Household Industries, 5. Percentage of Literate to Total Population
6. Percentage of Gross Irrigated Area to Gross Cropped Area
7. Length of surfaced roads per 100 km of all roads, 8. Number of Primary Schools per 100 sq. km
9. Number of Secondary and Higher secondary schools per 100 sq km,
10. Number of Commercial Bank per 10,000 populations. The taxonomic method used to find out the indices of socio-economic development has been applied to identify the levels of development potential of 29 blocks of the district; these have been grouped in three classes namely, high, Medium, Low (Table 2).
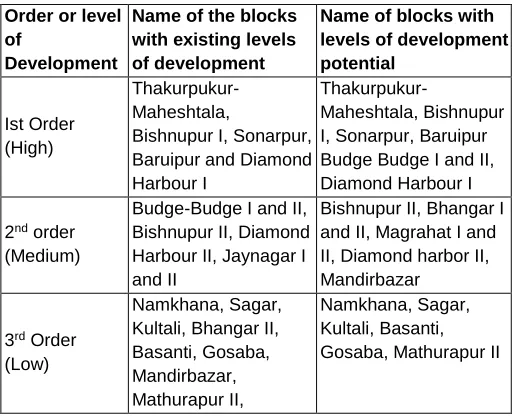
Table 2: Categorization of Blocks according to socio-economic Development and Development levels
Order or level of
Development
Name of the blocks with existing levels of development
Name of blocks with levels of development potential
Ist Order (High)
Thakurpukur-Maheshtala,
Bishnupur I, Sonarpur, Baruipur and Diamond Harbour I
Thakurpukur-Maheshtala, Bishnupur I, Sonarpur, Baruipur Budge Budge I and II, Diamond Harbour I
2nd order
(Medium)
Budge-Budge I and II, Bishnupur II, Diamond Harbour II, Jaynagar I and II
Bishnupur II, Bhangar I and II, Magrahat I and II, Diamond harbor II, Mandirbazar
3rd Order
(Low)
Namkhana, Sagar, Kultali, Bhangar II, Basanti, Gosaba, Mandirbazar, Mathurapur II,
Namkhana, Sagar, Kultali, Basanti, Gosaba, Mathurapur II
It is noted that Thakurpukur-Maheshtala, Bishnupur I, Sonarpur, Baruipur Budge Budge I and II, Diamond Harbour I blocks have high development potentials, while Namkhana, Sagar, Kultali, Basanti, Gosaba, Mathurapur II have low development potentials. The development blocks of Bishnupur II, Bhangar I and II, Magrahat I and II, Diamond harbor II, Mandirbazar have medium development potentials. Thus, it is noted that the present level of socio-economic development in various blocks of the district shows insignificant correlation (r = 0.07) with their respective development potentials. For example, the blocks of Budge budge I and II, Mandirbazar, Magrahat I and II are less developed than what their development potentials warrant.
It is observed that the existing level of development in the district has been due to its strategic location and nearer to the state capital Kolkata. However, the levels of development of different blocks of the district are not commensurate with their natural resources. In some blocks, the development is higher than justified by their resource potential, while in case of others, it is much lower. In view of varying levels of development and development potentials of different blocks, the question arise as to what should be the appropriate strategy for an accelerated development of the relatively less developed blocks. This, however, involve the exclusion of more developed blocks from the developmental process; in fact, the infrastructural facilities in these blocks also need be further strengthened. To reduce the imbalance in development of various blocks as also for all-round development of the district, the following measures are suggested:
RECOMMENDATION
Proposal for Integrated Area Development Plan for the District
Soil conservation and Water Management
• To restrict soil Salinization
• Prepare well drainage network system
• To find out the basin (lower) area of the district and to manage this area by proper utilization. (such as Hydrophytes Planting)
Agriculture to be supplemented by horticulture, sericulture and cottage industries
farmers; it partly satisfies even their consumptions needs. Inhospitable climatic and salinization conditions, low productivity and high cost of land development and maintenance make agriculture a high-risk activity; it, therefore, needs be supplemented by horticulture and sericulture for which a detailed soil and land use survey coupled with watershed management has to be undertaken. Areas suitable for fruit-tree plantation and floriculture have to be identified for fostering such activities.
Horticulture Development
The Agro climatic conditions of the district is ideally suited for development and growth of Horticulture and floriculture sectors and has a vast potential for economic development of small and marginal farmers. The crop raised plays a significant role in the local economy. Most of them are perennial in nature and less labour oriented. They can be easily grown in fallow lands. Besides production per unit area is more than that of other agronomical crops and comparatively very cost effective. To tap this vast potential and development, various schemes are undertaken like training of stakeholders pertaining to improved practices; ensure availability of quality seeds and planting materials, systematic pre and post sowing techniques. Initially programme for cultivation of vegetables like Elephant Foot Yam, Makhna, spices like ginger, fruits like Pineapple and Banana, flowers like Marigold, Rose, Tube rose, Gladiolus and Gerbera are undertaken, besides assistance for the development of small nurseries.
Among horticulture crops, fruits and vegetables are an important food supplement to the human diet as they provide the essential vitamins and minerals fibers required for maintaining health. South 24 Parganas district is ideally suited with wide variety of soil condition for growing a large variety of fruit and vegetable production in the district. Pineapple is the major crop in the district.
Most of the fruit and vegetable are seasonal crops and are perishable in nature. In a good season there is good market for chilly, ginger and different fruits and other seasonal vegetables. The surplus cannot be stored for the sale in the off season because the two cold storages in the district are insufficient for the storage. Thus, the cultivator does not get the good price for their produce and have to sell their produce on the available rate which they get from the local middle man in the district. The sale is further hampered because the marketing channel is not proper. At times there is complete loss to the farmers growing fruit and vegetables.
The “Horti-Floriculture” profession has been developed as an important source of livelihood of the people of four Blocks in South 24-parganas. It has been a remarkable increase in total production of horticultural planting materials especially ornamental foliage plants to cope up
the domestic & export requirement. There is a tremendous scope of upliftment in this Horti-Floriculture Planting material production Industry in this region.
The main four Blocks where horticulture and floriculture are taking place in the district are(1) Bishnupur – II, (2) Budge Budge – II, (3) Bihnupur – I, & (4) Falta. Among them the intensive areas are 1) Srikrishnapur 2) Boharanpur 3) Sukdevpur, 4) Umedpur 5) Patharberia6) Ramchandrapur 7) Chandanadah 8) Gobindapur 9) Joychandipur 10) Muchisha 11) Biowali 12) Sahebanbagicha etc.
Sericulture
The district has a very good potential of sericulture growth but still is in nascent stage. The motivation to farmers is being given and it needs to be carried on in future too. The best result can be achieved by bringing the sericulture under the cooperative sector so that more people are involved. The insurance scheme in this sector needs to be further strengthened. This sector has initial problems and for its growth the farmers needs to be given good incentive to adopt it.
Animal husbandry and Dairying
The District has a recognized Goat breed named as ‘Bengal’ commonly known as Black Bengal goat mostly available at islands. This breed is famous for its quality of meat and skin. Fecundity of the breed is another rare feature of this breed. Conservation of the breed and selective breeding at rural are utmost essential at the present. The district also has another good quality recognized sheep breed known as ‘Garole’. This is also world famous for its fecundity. Conservation of this breed and the selective breeding at the rural areas is utmost essential at the present. This district is in a leading position on the poultry population in the State, though major poultry population is poor productive country breed reared under backyard system. A small unit of commercial boilers farming is also common in some selected areas. Due to land topography, climate as well as economical background of the rural poor sector, there is ample scope to introduce good quality poultry birds like RIR and KC Ducks under backyard farming system. Farmers of the remotest area are wholeheartedly accepting this programme since its inception from the year 2005-06.
Fishery Development
The district is bestowed with large number of water bodies which are utilized for Pisciculture activities. Some of the water bodies have been restored and renovated to make them useful for irrigation purposes also. These water bodies can be more effectively utilized for pisciculture activities which can really supplement the income of the rural poor to a considerable level. There are large water bodies in the district which can be exploited for inland fisheries and can also be used as source of irrigation water. Aquaculture plays a great role in human nutrition and upliftment of rural poor people and considering immense production possibilities and export potential.
Scientific Joint forest management
The South 24 Parganas district has the one of the largest mangrove forest known as Sunderbans. This forest is the largest eco-system of the world and is home the rare Royal Bengal tiger apart from various other species which is there in the forest. It contains valuable woods, honey, herbal vegetation, fish, crab etc. The forest department is mainly managing the large forest area and so the department is not concentrating on the social forestry scheme as the area is full of forest and managing it is a tough task. Almost entire benefit goes to outside contractors and industrialist, and local people suffer the ecological consequences. Scientific management of forest together with establishment of forest-based industries, including furniture making, handicrafts, manufacturing of drugs and food processing, preparing of food in fishery, will go a long way to provide employment and bring prosperity to the local people. Non-availability of local skilled labour and poor transport facilities accounts for lack of large scale industries in the district. Establishments of small-scale industries, based on forest and agriculture products, horticulture, sericulture and wood can be undertaken in suitable parts of the district.
Development of Tourism industry
Tourism has brought alternative source of employment and income to the people of certain part of the district. It has also been helpful in eroding the new value system and life-style among the rural people. A number of settlements which are consist in the different blocks namely Gosaba, Basanti, Sagar, Patharpratima, Diamond Harbour, Falta, etc. particularly nearer to the sunderbans as great interest of the traveler in the district. These settlements are heavily depending upon tourism for their sustenance. Hence, a well-organized integrated plan for the development of tourist places with infrastructural facilities should be formulated. The tourists’ place has to be provided with accommodation facilities, including hotels, tourist bungalows’ and restaurants, along with electricity, running water, health services and tourist guides. These areas also need to be inter-connected by an efficient transport and communication system for which the State Government and the tourist Department have to take immediate steps.
Development of ecologically and Socially Accepted models of Resource use
The over growing population pressure, combined with a limited resource base, increasing construction activity, unscientific cultivation, growing tourism and irrational deforestation have created a degradation of environment and growing pauperization of population resulting of huge emigration. Hence, there is an urgent need for the development of ecologically accepted models of resource use adapted to this mostly riverine environment in the district of South 24 Parganas.
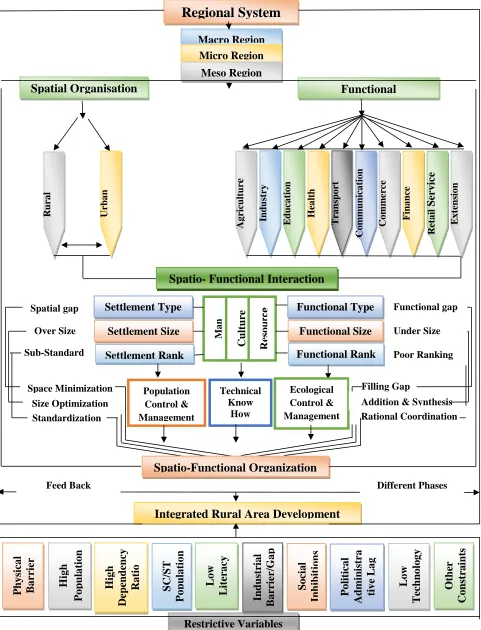
An integrated rural area development model
The basic issues of our national planning have been clearly stated as economic growth, social justice, equity and welfare and improvement of environmental quality. However, no attention has been paid to environmental quality control and management. Our resources have slowly depleted the natural bio-mass in certain areas which has created problems in maintaining ecological balance. The integrated rural area development proposes appropriate location of socio-economic activities over a physical space for the optimum utilization and development of physical and human resources available in the region for their balance development. It provides a most suitable matrix for decentralization of basic and necessary socio-economic activities by locating them at viable places. Actually, an integrated rural area development combines three types of integration, i.e. functional, spatial, and temporal and these are again interrelated in various complex forms (figure no. 2). Functional integration includes all the essential socio-economic activities like agriculture, industry, education, health, transport, communication, and extension and retailing services. These all are interrelated and called positive variables.
CONCLUSION
Figure 2: An Integrated Rural Area Development Model
Regional System
Macro Region
Micro Region
Spatial Organisation
Functional
Meso Region
Rura l E x tens io n S erv ice Ret a ilServ
ice
F ina nce Co mm er ce Co mm un ica tio n T ra ns po rt H ea lt h E du ca tio n Ind u st ry Ag ricult ure
Urba nSpatio- Functional Interaction
Spatial gap Functional gap
M a n
C
ult
ure
R
es
o
u
rc
e
Functional Type
Settlement Type
Over Size Under Size
Functional Rank
Functional Size
Settlement Size
Settlement Rank
Sub-Standard Poor Ranking
Ecological Control & Management Population Control & Management Technical Know How
Space Minimization Filling Gap
Standardization
Size Optimization Addition & Synthesis
Rational Coordination
Spatio-Functional Organization
Restrictive Variables
O
the
r
C
on
st
ra
int
s
L
ow
T
ec
hn
ol
o
gy
P
oli
ti
cal
A
dmi
n
ist
ra
ti
ve
L
ag
Soci
a
l
Inhi
bi
ti
ons
Indust
ri
a
l
B
arr
ie
r/
G
ap
L
ow
L
it
er
acy
SC
/ST
Pop
ulat
ion
H
igh
D
ependency
R
at
io
H
igh
Po
p
ulat
ion
Ph
ysi
cal
B
arr
ie
r
Feed Back Different Phases
J. Agric. Econ. Rural Devel. 380
REFERENCE
Albert, O Hischerman (1977): A Generalized Linkage approach to Development, with special reference to Staples. Eassys on Economic Development and Cultural Change, Volume 25 1977.
Arun Kumar, A. V. and C. Upendranadh (1993): Infrastructure Development in India: an Alternative Approach to Measurement. Productivity, Vol. 34, No. 3 1993.
Aziz, A. (1984): Approaches to Integrated Rural Development: Some Reflections in T.K. Lakshman and B.K. Narayan (eds.), Rural Development in India, Himalaya Publishing House, Bombay.
Bhat, L.S et al. (1976): Micro-level Planning: A case Study of karnal Area. K.B. Publication, New Delhi 1976. Dasgupta, (1971), Socio-economic Classification of
Districts: A Statistical Approach, Economic and Political Weekly, aug 2014.
Dubhasi, P.R (1984): Problems of Rural Development in developing countries and Administrative Planning for Rural Development, in T.K. Lakshman and B.K. Narayan (eds.), Rural Development in India. Himalaya Publishing House, Bombay, pp. 58 1984.
Ghosh, B. and P. De (1998): Role of Infrastructure in Regional Development - A Study over the Plan Period. Economic and Political Weekly, 33 (47) 38- 42, 1998. Hischeman, A.D. (1969): The Strategy of Rural
development, New Delhi.
Jain, N.G. (1980): Integrated Rural Development: A Geographical Approach, in Recent Trends and Concept in geography (eds.) Mandal, R.B. et al. vol. 3, Concept Publishing Company, New Delhi, Pp. 214 1969. Kadekodi, G. and Singh, V.S (1975): Regional Disparities
and Areas with Special Problems in Uttar Pradesh. Indian Journal of Regional Science, 7, 1975.
Majumder, R (2003): Infrastructural Facilities in India: District Level Availability Index. Indian Journal of Regional Science, Vol. 35(2) 2003.
Mathur, Ashok (1983): Regional Development and Income Disparities in India: A Sectoral Analysis. Economic Development and Cultural Change,31, April, 1983.
Mohan, K. (2005): Addressing Regional Backwardness: An Analysis of Area Development Programmes in India. Manak Publication, New Delhi 2005.
Pal, M.N(1975): Regional Disparities in the Levels of Development in India, Indian Journal of Regional Science, 7, 1975.
Pathak, C.R. Aziz, A. and Chattopadhyay, R.N (1970): Identification of Planning Areas in Three State Regions- Bihar, Orissa and West Bengal, with Respect to their Levels of Development and Planning Problems. Indian Journal of Regional Science, 2, 1970.
Siddiqui, F.A. and Hussain, N (2010): Analysis of Micro Level Socio-Economic Disparities in Malda District, West Bengal.Asia-Pacific Journal of Social Sciences, 2 (1).39-61, 2010.
Singh, J. P.(1995):Levels of Development in Madhya Pradesh. The Deccan Geographer, 33(1) 55-68, 1995.
Accepted 25 February 2018
Citation: Mandal S, Rohatgi P (2018). Levels of Development and Development Potential: An Approach in Integrated Rural Area Development Plan, South 24 Parganas District, West Bengal, India. Journal of Agricultural Economics and Rural Development, 4(1): 372-380.