International Journal of Advances in Engineering Research http://www.ijaer.com (IJAER) 2016, Vol. No. 11, Issue No. III, March e-ISSN: 2231-5152/ p-ISSN: 2454-1796
OPTIMAL ALLOCATION OF DISTRIBUTED
GENERATIONS FOR DISTRIBUTION SYSTEM
SECURITY AND RELIABILITY
*R. Ramamohan Rao, **G. Naresh
*P.G. Student, Department of Electrical and Electronics Engineering, Pragati Engineering College, Near Kakinada, Andhra Pradesh, India ** Associate Professor, Department of Electrical and Electronics Engineering
Pragati Engineering College, Near Kakinada, Andhra Pradesh, India
ABSTRACT
Integration of renewable energy based distributed generation (DG) units in power distribution systems has drawn the attention of power engineers in the recent past. In this paper, a methodology has been proposed based on Artificial Bee Colony (ABC) algorithm for optimal allocation of wind-based DG units in the distribution system so as to minimize the power loss and voltage profile improvement. The uncertainties in wind-power based generation are taken into account by employing a probabilistic approach for optimal allocation and sizing of DG units. The problem of determining the optimal location and size for distributed generators (DG) to improve the voltage profile and to minimize total system real power loss is converted into an optimization problem and ABC algorithm is used to solve it. The effectiveness of the proposed method is evaluated on standard IEEE-30 bus and 118-bus radial distribution systems under different operating conditions.
Keywords: Distributed Generation Artificial Bee Colony Algorithm, Power loss minimization, Voltage profile improvement
INTRODUCTION
Introduction of renewable and non-renewable distributed generation (DG) into the distribution systems has become inevitable due to the increase in demand for electrical energy. Power loss reduction, environmental friendliness, voltage profile improvement, postponement system upgrading and improved reliability are some of the reasons for employing DG-units. However, practical application of the DG-unit proves difficult as improper placement lead to increase in system losses.
DG-International Journal of Advances in Engineering Research http://www.ijaer.com (IJAER) 2016, Vol. No. 11, Issue No. III, March e-ISSN: 2231-5152/ p-ISSN: 2454-1796
units operating in parallel with the system, especially in radial feeders, is as negative active and reactive power injections, independent of the system voltage at the terminal bus. When using multiple DG-units as PV units, it is unrealistic to manage these DG-units as available for dispatching because they may not be controlled by the main utility.
Maximizing the voltage support in radial distribution feeders using DG-unit was discussed in [2]. The method used voltage sensitivity index to determine the optimal location of DG-unit. Then, active and reactive powers of DG-unit were adjusted to obtain maximum voltage support. The weakest bus was identified using Thevenin‟s theorem.
The optimal size and location of DG-unit based on a predetermined power loss reduction level up to 25% were proposed in [3]. The objective of this method is to reach that level with minimum net DG-unit cost i.e., DG-unit cost subtracted from saving. The solution was achieved using sequential quadratic programming. The number and size of the DG-units are found to be two and 40% of peak loads respectively.
Minimizing power loss by determining the optimal size, location and operation point of DG-unit was suggested in [4]. Sensitivity analysis relating the power loss with respect to DG unit current injection was used to identify the DG-unit size and operation point. The proposed method tested for constant impedance and a constant current model. One of the test systems assumed that loads were uniformly distributed, which is rare in practical feeder systems. The location of the DG-unit was based on the assumption of downstream load buses, which may not be appropriate for different feeder configurations.
Optimal sizing and allocation of DG units based on an analytical expression comprising of exact loss formula has been in [5]. In this paper, this technique was tested on 30, 33 and 69 bus distribution test systems with and without reactive power injection.
The optimum DG allocation can be treated as optimum active power compensation, like capacitor allocation for reactive power compensation. DG allocation studies are relatively new, unlike capacitor allocation. In [6,7], power flow algorithm is presented to find the optimum DG size at each load bus assuming every load bus can have DG source. Such methods are, however, inefficient due to a large number of load flow computations. The genetic algorithm (GA) based method to determine size and location is used in [8–10]. GA is suitable for multi-objective problems like DG allocation and can give near optimal results, but they are being computationally demanding and slow in convergence. In [11], an analytical method to place DG in radial as well as meshed systems to minimize power loss of the system is presented. In this method separate expressions for radial and network system are derived and a complex procedure based on phasor current is proposed to solve the location problem. However, this method only optimizes location and considers size of DG as fixed.
International Journal of Advances in Engineering Research http://www.ijaer.com (IJAER) 2016, Vol. No. 11, Issue No. III, March e-ISSN: 2231-5152/ p-ISSN: 2454-1796
outage of generators, intermittent power injection by DG units to the system...etc. And also for a distribution system with „N‟ nodes and with „k‟ different load values at each node, kN load flows are required. Therefore, the deterministic approach is not sufficient to analyze the modern power system and the results obtained will give an unrealistic assessment of the system performance. For operational planning problems like the assessment of reliability of the system configuration or design of new networks, it is necessary to assess the line flows from the range of loads.
In this paper, an effective methodology based on probabilistic load flow (PLF) approach is used to solve randomness problem of the distribution network with DG. This type of analysis gives much more general and complete picture of voltage effects than the deterministic load flow approach. In most of the practical situations, it gives satisfactory results when applied to the evaluation of voltage profiles in distribution networks and can be used for assessing the level of DG that might be accepted on a distribution network. This methodology is computationally less demanding and is based on single instantaneous demand at peak, where the losses are maximum. The proposed methodology is suitable for allocation of single, double and triple DGs in a given distribution network.
The rest of the paper is organized as follows: Section 2 presents the problem formulation for allocating the distributed generation in the electric distribution system. Proposed methodology using ABC algorithm for determining the optimum size and location of DG units in the distribution network described in Section 3. Simulation results along with some observations and discussions are presented in Section 4. Conclusions of the paper are summarized in Section 5.
II. PROBLEM FORMULATION
A. Wind Speed Modeling:
The expression used to model the behavior of wind speed is the Rayleigh probability density function (pdf) [12]. Rayleigh pdf is a special case of Weibull pdf is given by
k k c v c v c k v
f( ) exp
1
, where „c‟ is called the scale index and „k‟ is the shape index.
If the mean value of the wind speed for a site is known, then the scaling index „c‟ and shape index
„k‟ can be calculated from the equation dv c v c v c kv dv v f v v k k
m . ( ) . .exp 1 0 0
. In orderInternational Journal of Advances in Engineering Research http://www.ijaer.com (IJAER) 2016, Vol. No. 11, Issue No. III, March e-ISSN: 2231-5152/ p-ISSN: 2454-1796
The probability of each state P(Gw) is calculated using P G f v dv
w w w v v ) ( ) ( 2 1
, where vw1 and vw2 are
the speed limits of state „w‟. The output power of the wind turbine corresponding to each state is
calculated using the wind turbine power curve parameters. For the sake of simplicity, the average value of each state (vaw) is utilized to calculate the output power of the that state (e.g. if a state has
limits of 1 and 2 m/s, the average value for this state is(vaw) = 1.5 m/s.
, 0 , , 0 , 0 ) ( / aw co co aw r rated r aw ci ci r ci aw rated ci aw v v v v v P v v v v v v v P v v v
PO pw , where vci Cut-in speed of the wind turbine,
r
v isRated speed of the wind turbine and vcois Cut-off speed of the wind turbine
For a 100 kW wind turbine, vci,vr and vcoare 3 m/s, 10 m/s and 30 m/s respectively.
) (
/ w
w
ave P P G
P
O pwrated ave
P P
CF
B. Combined generation–load model:
The modeling of the wind-based DG output power and the load is utilized to generate the combined wind–load model. In this paper, the wind speed states and the load states are assumed to be independent (uncorrelated). This assumption will not affect the results if a weak correlation exists between the wind speed and the load. However, if a strong correlation exists between both of them, the accuracy of the results will be affected based on the nature of the correlation (either it is positive or negative). The rationale behind this is that the main reason of the constraints violation is the reverse power flow, which occurs if the output power of the DG units is higher than the load. If there is a positive correlation between the wind speed and the load, it is expected that the amount of the reverse power flow will decrease; hence, the optimal penetration of the DG units is expected to be higher than the value calculated based on the aforementioned assumption. On the other hand, if a negative correlation exists, the optimal penetration of the DG units is expected to be lower than the value calculated based on the same assumption.
Based on this assumption, the probability of any combination of load and wind-based DG output
) (Cg
P can be obtained by convolving the two probabilities as given in the following equation
) ( ) ( )
(C P G P L
International Journal of Advances in Engineering Research http://www.ijaer.com (IJAER) 2016, Vol. No. 11, Issue No. III, March e-ISSN: 2231-5152/ p-ISSN: 2454-1796
C. Objective function:
The objective of the planning formulation is to minimize the annual energy losses in the distribution system under all possible operating conditions
8760
l g
N Plossg P(Cg) Losses
Minimize
Where
lossg
P is the total power loss in the system during state „g‟.
D. Probabilistic Approach for DG Allocation:
This section presents the proposed probabilistic formulation for a LDC‟s planning problem with respect to the system under study. The rationale behind the proposed technique is to accommodate the probabilistic generation–load model into the deterministic optimal power flow (OPF) equations. In other words, the number of active/reactive power flow equations, (3.9) and (3.10), is equal to the total number of states. For each state, the penetration of the wind DG units is changed based on the generation–load model, while the power loss is calculated and then weighted according to the probability of occurrence of this state during the entire year, in order to calculate the energy losses. The optimal locations of the DG units are then determined so that, for all operating conditions, the total energy losses are minimized without violating the system constraints.
To formulate an accurate planning strategy that determines the optimal fuel mix of renewable DG units, the following assumptions are made:
More than one type of DG can be connected to the same bus.
All the DG units are working at same power factor.
The location has no significant impact on the output power of wind and solar DG, as the distribution systems typically involve relatively short distances between DG units. Consequently, in this work, it is also assumed that the output power of renewable DG is insensitive to the bus location.
III.
OPTIMAL
LOCATION
AND
SIZING
OF
DG
UNITS
USING
ARTIFICIAL
BEE
COLONY
ALGORITHM
International Journal of Advances in Engineering Research http://www.ijaer.com (IJAER) 2016, Vol. No. 11, Issue No. III, March e-ISSN: 2231-5152/ p-ISSN: 2454-1796
When a food source has been abandoned by bees, the abandon employed bee would become a scout. In the first place, the ABC algorithm would generate a randomly distributed initial population P(C=0) of SN food source positions, where SN is the size of food sources. Every solution xi (i=1, 2, 3...SN) is a D dimensional vector where D denotes the number of
optimization parameters. After the initialization, the population of solutions is subject to repeated cycles C=1,2,3 ...,MCN of the search courses of employed bees, onlookers and scouts. An employed bee could produce a modification on the solution in its memory on local information and test its fitness value of the new source. If the fitness value of the new one is better than that of the previous one, the employed bee would memorize the new position and forget the previous one. Otherwise it keeps the position of the previous one in its memory. When all employed bees complete the search process, they will share the information about nectar amounts and positions of food sources with onlookers. An onlooker evaluates the nectar information which is owned by all employed bees and then chooses a food source with a probability which is related to the nectar amount. As in the case of the employed bee, the onlooker can produce a modification on the position in its memory and check the nectar amount of the candidate source. If the nectar amount is more than that of the previous one, the bee would memorize the new position and forgets the previous one.
An onlooker chooses a food source completely depending on the probability value associated with the food source pi, which is calculated by the following form
N S
n n
fit i fit i P
1
, where fiti denotes
the fitness value of the ith solution which is proportional to the nectar amount of the food source in the ith position. For the sake of producing a new food position from previous one, the ABC could adopt the following modification form ij.
) ( ij kj ij
ij
ij x x x
v , where k ∈ {1, 2. . . SN} and j ∈ {1, 2. ., D} are random generating indexes, but k must be different from i. ijis a random number between [−1, 1]. It can control to produce a
new food source around xij and represent the comparison of two food positions visually by a bee.
As can be seen from Eq. 4.7, as the difference between the parameter xij and xkj decreases, the
perturbation on the position xij is also decreased. Thus, when the search approaches to the
optimum solution in the search space, the step size is adaptively reduced. If a parameter value produced by the operation exceeds its predetermined limit, it is set to its limit value.
The food source which is abandoned by the bees would be replaced with a new food source found by scouts. In ABC algorithm, the foraging behavior is simulated by randomly producing a position and replacing the abandoned one with a new one. If a position cannot be improved further through a predetermined number of cycles, the food source should be abandoned. The predetermined number of cycles is an important control parameter in ABC algorithm, which is called “limit” for abandonment. Suppose that the abandoned source is xi and j ∈ {1,2, D}, then the scout finds new food source to be replaced with .This operation can be defined as xijj xijjrand(0,1)*(xmaxj xminj ). After each new source position Vij produced, it can be evaluated by the artificial bee, and its fitness
International Journal of Advances in Engineering Research http://www.ijaer.com (IJAER) 2016, Vol. No. 11, Issue No. III, March e-ISSN: 2231-5152/ p-ISSN: 2454-1796
one, it would be replaced with the previous one in its memory. Otherwise, the old one is retained in its memory.
The three important control parameters in the ABC algorithm: the number of food sources (SN), the value of „limit‟ and the maximum cycle number (MCN).
1)Initialize the population of solutions xij, i = 1, 2, ...., SN, j = 1, 2,.., D
2)Evaluate the fitness of the population 3)Initialize Cycle to 1
4) Produce new solutions xij for the employed bees and evaluate the fitness
5) Apply the greedy selection process for the employed bees 6) Calculate the probability values Pij for the solutions Vij
7) Produce the new solutions xij for the onlookers from the solutions xi selected
depending on Pi and evaluate the fitness
8) Apply the greedy selection process for the onlooker bees
9) Determine the solution to be abandoned for the scout, if exists, and replace it with a new randomly produced solution xij
10) Memorize the best solution so far 11) Cycle = Cycle+1
12) Repeat steps (4) to (11) until Cycle = MCN Display the optimal solution.
IV.
RESULTS
AND
DISCUSSION:
To evaluate the effectiveness of the proposed technique, it has been tested on two test systems i.e., IEEE-33 and IEEE-118 bus distribution systems [15]. ABC algorithm has been used to determine the optimal location and sizes of DG units under different operating conditions. The proposed technique is implemented using MATLAB 7.14 software and the simulations were executed on a 3.10 GHz, 4GB RAM, INTEL Core i3 PC.
The test conditions considered for single, double and triple DG units placement in both the systems are given in table 1.
Table I. Test Conditions
Case Condition
Case 1 DG units are controlled to supply active power only, i.e., at unity power factor
Case 2 DG units is controlled to supply both active and reactive power, at a power factor of 0.8
A. TEST SYSTEM 1: IEEE 33 BUS RADIAL DISTRIBUTION SYSTEM
International Journal of Advances in Engineering Research http://www.ijaer.com (IJAER) 2016, Vol. No. 11, Issue No. III, March e-ISSN: 2231-5152/ p-ISSN: 2454-1796
loss, % of loss reduction and minimum voltage at any bus in p.u. for single, two and three DGs placement is reported in tables 2, 3 and 4.
Single DG placement:
Table II. Results for Single DG Placement in IEEE 33-bus Radial Distribution System
Without DG
With DG
Case 1 Case 2
Optimal location for DG at bus --- 6 6
Optimal Rating of DG (MVA) --- 1.9 2.3
Total active power loss without DG (KW) 669.51 --- ---
Total active power loss with DG (KW) --- 447.19 347.59
Loss Reduction (%) --- 33.21 48.09
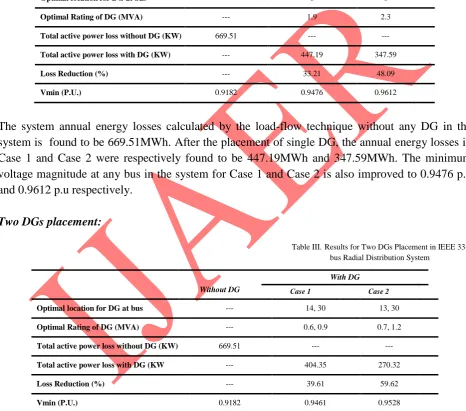
Vmin (P.U.) 0.9182 0.9476 0.9612
The system annual energy losses calculated by the load-flow technique without any DG in the system is found to be 669.51MWh. After the placement of single DG, the annual energy losses in Case 1 and Case 2 were respectively found to be 447.19MWh and 347.59MWh. The minimum voltage magnitude at any bus in the system for Case 1 and Case 2 is also improved to 0.9476 p.u and 0.9612 p.u respectively.
Two DGs placement:
Table III. Results for Two DGs Placement in IEEE 33-bus Radial Distribution System
Without DG
With DG
Case 1 Case 2
Optimal location for DG at bus --- 14, 30 13, 30
Optimal Rating of DG (MVA) --- 0.6, 0.9 0.7, 1.2
Total active power loss without DG (KW) 669.51 --- ---
Total active power loss with DG (KW --- 404.35 270.32
Loss Reduction (%) --- 39.61 59.62
Vmin (P.U.) 0.9182 0.9461 0.9528
International Journal of Advances in Engineering Research http://www.ijaer.com (IJAER) 2016, Vol. No. 11, Issue No. III, March e-ISSN: 2231-5152/ p-ISSN: 2454-1796
Three DGs placement:
Table IV. Results for Three DGs Placement in IEEE 33-bus Radial Distribution System
Without DG
With DG
Case 1 Case 2
Optimal location for DG at bus --- 14, 24, 30 14, 24, 30
Optimal Rating of DG (MVA) --- 0.6, 0.8, 0.8 0.6, 0.9, 1.1
Total active power loss without DG (KW) 669.51 --- ---
Total active power loss with DG (KW --- 370.34 231.59
Loss Reduction (%) --- 44.68 65.41
Vmin (P.U.) 0.9182 0.9663 0.9836
The system annual energy losses calculated by the load-flow technique without any DG in the system is found to be 669.51 MWh. After the placement of three DGs, the annual energy losses in Case 1 and Case 2 were respectively found to be 370.34 MWh and 231.59 MWh. The minimum voltage magnitude at any bus in the system for Case 1 and Case 2 is also improved to 0.9663 p.u and 0.9836 p.u respectively.
B. TEST SYSTEM 2: IEEE 118 BUS RADIAL DISTRIBUTION SYSTEM
The standard IEEE 118-bus system is considered as second example for testing the efficiency of proposed method. The single line diagram, line and load data of this test system is given in Appendix B. The total real and reactive power loads on the system are 22.71GW and 17.04GVAr. Detailed results consisting if location, size of DGs, power loss, % of loss reduction and minimum voltage at any bus in p.u. for single, two and three DGs placement is reported in tables 5, 6 and 7.
Single DG placement:
Table V. Results for Single DG Placement in IEEE 118-bus Radial Distribution System
Without DG
With DG
Case 1 Case 2
Optimal location for DG at bus --- 71 72
Optimal Rating of DG (MVA) --- 2.3 2.7
Total active power loss without DG (KW) 4247.43 --- ---
Total active power loss with DG (KW --- 3631.99 3403.99
Loss Reduction (%) --- 14.49 19.86
International Journal of Advances in Engineering Research http://www.ijaer.com (IJAER) 2016, Vol. No. 11, Issue No. III, March e-ISSN: 2231-5152/ p-ISSN: 2454-1796
The system annual energy losses calculated by the load-flow technique were found to be 4247.43 MWh. After the placement of single DG, the annual energy losses in Case 1 and Case 2 were respectively found to be 3631.99MWh and 3403.99MWh. The minimum voltage magnitude at any bus in the system for Case 1 and Case 2 is also improved to 0.9112 p.u and 0.9115 p.u respectively.
Two DGs placement:
Table VI. Results for Two DGs Placement in IEEE 118-bus Radial Distribution System
Without DG
With DG
Case 1 Case 2
Optimal location for DG at bus --- 71, 110 71,110
Optimal Rating of DG (MVA) --- 2.3, 2.2 2.7, 2.8
Total active power loss without DG (KW) 4247.43 --- ---
Total active power loss with DG (KW --- 3159.53 2635.68
Loss Reduction (%) --- 25.61 37.95
Vmin (P.U.) 0.8915 0.9106 0.9121
The system annual energy losses calculated by the load-flow technique were found to be 4247.43 MWh. After the placement of two DGs, the annual energy losses in Case 1 and Case 2 were respectively found to be 3159.53 MWh and 2635.68 MWh. The minimum voltage magnitude at any bus in the system for Case 1 and Case 2 is also improved to 0.9106 p.u and 0.9121 p.u respectively.
Three DGs placement:
Table VII. Results for Three DGs Placement in IEEE 118-bus Radial Distribution System
Without DG
With DG
Case 1 Case 2
Optimal location for DG at bus --- 50, 71, 110 50, 71, 110
Optimal Rating of DG (MVA) --- 2.2, 2.2, 2.3 2.9, 2.7, 2.8
Total active power loss without DG (KW) 4247.43 --- ---
Total active power loss with DG (KW --- 2847.41 2083.80
Loss Reduction (%) --- 32.96 50.94
Vmin (P.U.) 0.8915 0.9408 0.9662
International Journal of Advances in Engineering Research http://www.ijaer.com (IJAER) 2016, Vol. No. 11, Issue No. III, March e-ISSN: 2231-5152/ p-ISSN: 2454-1796
at any bus in the system for Case 1 and Case 2 is also improved to 0.9408 p.u and 0.9662 p.u respectively
V.CONCLUSIONS
In this paper, a probabilistic approach for the optimal placement and sizing of multiple distributed generations based on artificial bee colony algorithm has been proposed. For the validation of results, the standard IEEE-33 bus and IEEE-118 bus radial distribution test systems were considered. Two test cases were considered for analysis, first one is only real power injection and another is both real and reactive power injection. In both the cases, it is observed that the total real power loss of the system reduces with the addition of DGs. The loss reduction is observed to be more when the three DGs are injecting both real and reactive power.
The minimum voltage at any bus of the system is also observed and it is found to be highest when the three DGs are injecting both real and reactive power.
REFERENCES
[1] C. L. T. Borges, D. M. Falcao, “Impact of distributed generation allocation and sizing on
reliability, losses and voltage profile” IEEE Power Tech Conference Proceedings, vol. 2, 2003.
[2] A. D. T le, M. A. Kashem, M. Negnevitsky, G. Ledwich, “Maximizing Voltage Support in
Distribution Systems by Distributed Generation”, IEEE TENCON Conf., pp. 1-6, 2005.
[3] An D. T. Le, M. A. Kashem, M. Negnevitsky, G. Ledwich, “Optimal Distributed
Generation Parameters for Reducing Losses with Economic Consideration,” IEEE Power Engineering Society General Meeting, pp. 1-8, June 2007.
[4] M. A. Kashem, A. D. T. Le, M. Negnevitsky, G. Ledwich, “Distributed Generation for
Minimization of Power Losses in Distribution Systems”, IEEE Power Engineering Society General Meeting, pp. 1-8, 2006.
[5] Naresh Acharya, Pukar Mahat, N. Mithulananthan, “An analytical approach for DG
allocation in primary distribution network”, Electrical Power and Energy Systems 28 (2006) 669–678
[6] Row NS, Wan Y-H. Optimum location of resources in distributed planning. IEEE Trans
PWRS 1994;9(4):2014–20.
[7] Kim JO, Nam SW, Park SK, Singh C. Dispersed generation planning using improved
Hereford ranch algorithm. Electric Power Syst Res 1998; 47(1):47–55.
[8] Kim K-H, Lee Y-J, Rhee S-B, Lee S-K, You S-K. Dispersed generator placement using
fuzzy-GA in distribution systems. In: Proceedings of 2002 IEEE power engineering society summer meeting, Chicago, IL, July 2002;3:1148–53.
[9] Silvestri A, Berizzi A, Buonanno S. Distributed generation planning using genetic
International Journal of Advances in Engineering Research http://www.ijaer.com (IJAER) 2016, Vol. No. 11, Issue No. III, March e-ISSN: 2231-5152/ p-ISSN: 2454-1796
[10] Carpinelli G, Celli G, Russo A. Distributed generation siting and sizing under uncertainty.
In: Proceedings IEEE Porto power technology, 2001.
[11] Wang C, Nehrir MH. Analytical approaches for optimal placement of distributed
generation sources in power systems. IEEE Trans PWRS 2004;19(4):2068–76.
[12] A. Silvestri, A. Berizzi, and S. Buonanno “Distributed generation planning using genetic
algorithms,” Electric Power Engineering, Power Tech Budapest, Inter. Conference, pp.257,1999
[13] Chang, G.W.; Chu, S.Y.; Wang, H.L. “An Improved Backward/Forward Sweep Load Flow
Algorithm for Radial Distribution Systems” IEEE Trans Power Sys. vol. 22, no. 2, pp. 882-884, 2007.
[14] D. Karaboga, B. Basturk, On the performance of Artificial Bee Colony (ABC) Algorithm,
Journal of Applied Soft Computing, Volume 8, Issue 1, January 2008, pp. 687-697.
[15] Sneha Sultana, Provas Kumar Roy, “Krill herd algorithm for optimal location of
distributed generator in radial distribution system”, Journal of Applied Soft Computing, Volume 40, Issue C, March 2016, pp. 391-404.
Biographies:
R. Ramamohan Rao graduated from JNTUK, Kakinada in 2012. He is currently pursuing M.Tech in Pragati Engineering College, Surampalem. His research interests include Power Systems and Power Electronics.