R E S E A R C H
Open Access
Assessment of airflow and microclimate for the
running wear jacket with slits using CFD simulation
Jihye Lim
1, Hyunyoung Choi
2, Eui Kyung Roh
3, Hwasook Yoo
4and Eunae Kim
2** Correspondence:[email protected] 2
Department of Clothing and Textiles, Yonsei University, Seoul 120-749, Korea
Full list of author information is available at the end of the article
Abstract
This study was performed to estimate the exchange of air (ventilation) and temperature distribution in the cylinder that simulated human body. Simulation simplified the human body wearing the running wear jacket with slits. Slits were positioned at the shoulder, mid-back and lower-back. For the running wear jacket, non-air permeable material was assumed to eliminate the effect of porosity of the fabrics. Airflow and microclimate temperature were analyzed using computational fluid dynamics (CFD). The results showed that the air tended to rise and drift towards the slits. Air flown out through the slits was in the order of the lower-back slit > mid-back slit > shoulder slit. Discrepancy in the air flow rate at each slit was caused by the generation of ascending air currents according to slit positions. The direction of the air current depended on the microclimate temperature inside the jacket. These results indicate that the lower-back slit gives better air exchange effect which was in agreement with the clothing microclimate observed by human wear tests.
Keywords:Running wear jacket; Slit position; Computational fluid dynamics (CFD); Air flow; Ventilation
Introduction
Managements of sweat and heat generated by sports activity are critical criteria for the sportswear to be competitive in the market. During hot summer, the sportswear is mostly open design but still the material property is very important. To maximize the sweat evaporation, air permeable or quick drying fabric is widely used. At cold weather, as the thermal insulation is important, openness is limited and wind proof material and/or padding material are often used. As a result, material is not sufficient to remove the sweat and body heat. If there is limited air permeability or no open space in the garment, the sweat by the sports activity will be accumulated and brings about the dis-comfort such as chilly feeling. In extreme case, at subzero temperature and prolonged exposure, severe damage such as frostbite and hypothermia can be resulted. When the wind proof and/or padding material are used, an effective way to remove body heat and sweat is to incorporate the slits in the garment. Recently, outdoor sports wears are designed to have the slits in the jackets and trousers but their slit locations, length etc. are rather design oriented and not much function oriented.
In order to construct functional sportswear such as F/W mountain climbing wear, which requires adaptability at different temperature and humidity from top to the foot of the mountain, thermodynamic analysis for the ventilation effect is necessary. The
effective slit design is also important for running wear to remove body heat and sweat as the wearers are exposed to various environment conditions. As Shivers et al. (1977) showed that the slit location, openings and closures in the clothing have a significant effect on the rate of air exchange and circulation through ventilation. Lim et al. (2009) also pointed out that the slit position has a significant influence on the microclimate temperature and humidity of the areas localized around the slits. This is due to emis-sion of heat and moisture through the exchange of air at the areas closest to the slits. Assessment of the movement of heat and moisture between the human body and its envir-onment has been carried out through wear tests. However, a lack of reproducibility and its time-consuming and expensive costs are problems and hamper the scientific analysis of the ventilation effects. The earlier studies mainly showed the effects of ventilation on air ex-change rates by using trace gas technique. Crockford et al. (1972) developed a method to measure air exchange rates in the clothing microclimate using a trace gas technique. Birn-baun and Crockford (1978) used trace gas to measure the air exchange rate and proposed a ventilation index to describe the performance of protective clothing assemblies. Since then, other devices and theoretical models have been used to evaluate the effects of ventila-tion under various condiventila-tions. Havenith et al. (1990) derived the values of the permeability index from change due to posture, movement and wind using the trace gas diffusion method. Chu and Nakajima (1997) investigated the effects of environmental temperature and the position of the opening on the clothing on ventilation of a thermal manikin by the trace gas method. Satsumoto et al. (2000) examined the effect of bellows action on heat transfer in the clothing system by using a device that consisted of a simulated skin and a clothing material plate. Satsumoto and Havenith (2010) developed a device to evaluate the distribution of ventilation in diapers and investigated the effect of the design and material factors of diapers on heat and water vapor transfer through ventilation.
CFD has been mostly applied in areas such as mechanical, chemical and architectural engineering. Recently, in modelling intelligent garment (Barry et al. 2003), sports textile (Chowdhury et al. 2010) and protective clothing (Barry and Hill 2003; Jiang et al. 2010; Talukdar et al. 2010; Ambesi et al. 2013; Zhu and Zhou 2013; Ambesi et al. 2014; Elgafy and Mishra 2014) CFD is adopted and the interaction of liquids and gases with surfaces defined by boundary conditions was simulated (Noca et al. 1999; Tanabe et al. 2002; Defraeye et al. 2011; Cimilli et al. 2012).
Lim et al. (2009) figured out the impact of the different slit positions on the air ex-change and circulation. However, this study did not show how much of air has venti-lated through the slits. To construct scientific product, we need various simulations to apply the most optimum position, shape, and size (length etc.). So far no such trial for the detailed analysis in garment system is found. If the conditions are properly set up, it is possible to predict the air flow without the wear test. However, the human being wearing garment and release heat and sweat is very complicated system and not easy to include all the factors in the CFD. In this study the simplified model for the torso of the running wear jacket is set up to investigate the effect of the slit for the pathway of the air coming in from the hemline of the jacket. The results will be compared to previ-ous study of the human subject test.
Methods
Cylindering process of human body
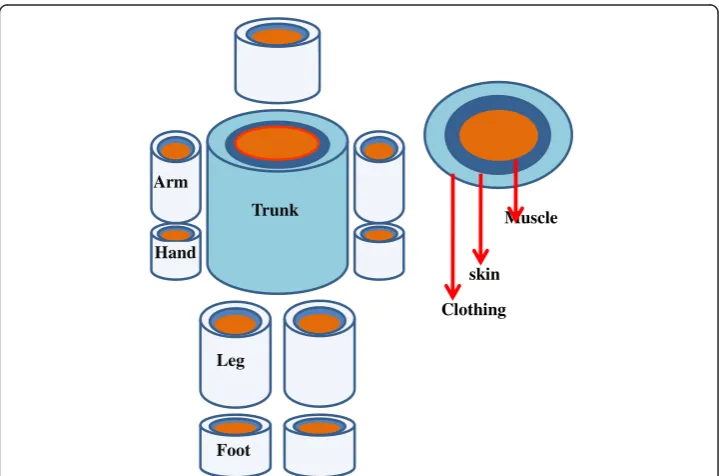
For the numerical analysis of the simulation of a running-wear jacket, the human body was simplified as a cylinder following Stolwijk and Hardy (1977), in which body was constructed by 6 cylinders of head, trunk, arms, hands, legs and feet. For this study, three-layer model was constructed, which was muscle-skin-clothing in each part of the cylinder (Figure 1).
Muscle
skin
Clothing Hand
Arm
Leg
Foot Trunk
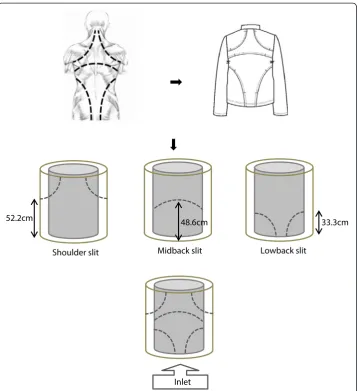
For the graphic process of the cylinder, the mean value of the bust and hem line of the running wear jacket was used for the very outside circumference of the clothing layer and as a result, radius (R = 17.83) was obtained (Figure 2).
Slit design in the cylinder based on the body movements
Havenith et al. (2008) found that sweat rate was higher on the back than on the chest as a whole. Therefore, as the first trial, slits were located at the back of the jacket to observe the effects of the slit positions on the ventilation. The slit positions in the cylinder were determined based on our previous study (Lim et al. 2009). In this pre-vious study, considering the commercially available running wear jacket and the suggestions in the previous studies, three slits were applied: a. a shoulder slit that cov-ered the trigger point and deltoid muscle, b. a mid-back slit that crossed the back muscle and erector spinae, and c. a lower-back slit that linked latissimus dorsi and the gluteus maximus. They made the slits on a curved line taking dynamic motion into consideration. Based on these studies, three slits were incorporated in the cylin-der in the curved lines and at the same relative locations (Figure 3). The inlet and outlet of the air was assumed as shown in Figure 3 as the chimney effect expected to be observed.
This modelling seems unrealistic, as in real life the air comes in from every direction and the material is air permeable. However, when there are slits in the water proof gar-ments, the effect of the slit is much bigger than the material itself. As a first step to in-vestigate the direction of air flow that comes in from the hem line, it could be more useful to simplify the model as much as possible.
Graphic process of trunk cylinder
ANSYS 15 (ANSYS Academic Research CFD, Frontis) was used to start the graphic process of the cylinder. In the program, after the lines for the cylinder were drawn, air layer was formed by filling the space between body and fabric with the mesh. The posi-tions of the slits are as shown in Figure 3. Widths of all the slits are 1 cm. The slits
are in symmetry. Area of the mid back slit is the sum of the each shoulder or low back slits.
The area of the body, cloth, inlet and the slits were calculated by the ANSYS 15.0 Design Modeler (Table 1).
Figure 3Determination of three positions of slits and their distances from inlet.
Table 1 Area of body, cloth, inlet and slits
Part Area (cm2)
Body 6555.20
Cloth 8066.19
Inlet 339.14
Shoulder_back_L 22.06
Shoulder_back_R 22.07
Midback 44.13
Lower_back_L 22.07
Lower_back_R 22.06
Numerical analysis
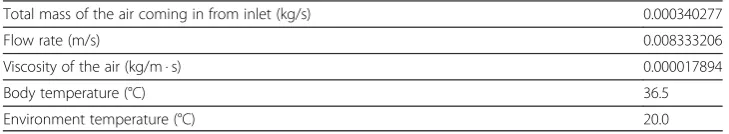
The rates of air flow through each slit to the outside were evaluated using the CFD mathematical model. The commercial numerical analysis program, Ansys15.0 Fluid Flow (Fluent) CFD-Post was used as the tool for finding expected air flow rate within the clothing. A standard k-ε turbulence model was used. The air that flowed in, in this model, was assumed to behave like an incompressible fluid, with uniform velocity and in a normal state. Air flow path was supposed to be that air from outside flowed through the lower end of body cylinder to the inside, then flowed through three slits back to the outside. Mass flow rate in the air layer within the clothing was assumed 0.99 m3/hr (Shivers et al. 1977); when converted into a unit of the FLUENT program, this became 0.000340277 kg/s. The temperature of the body cylinder was assumed to be 36.5°C, the mean temperature of the human and the outside temperature was as-sumed to be 20°C (Table 2).
Air flow patterns were generated according to the opening and closing of slits. The pattern was designed to flow through the lower end of the body cylinder to the inside, then flow through the slits to the outside. Non-air-permeable fabric was assumed to control the other effects caused by the fabric, such as porosity, and thus to evaluate only ventilation according to slit position
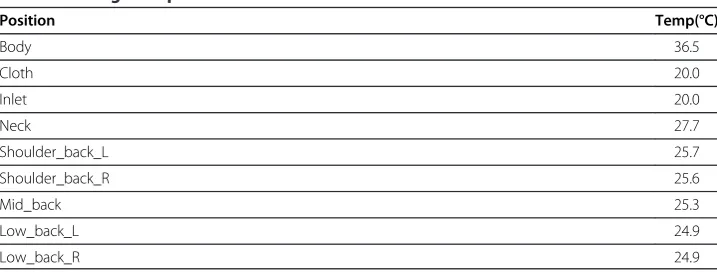
Temperature of the slits and surrounding area were calculated at the 10 spots (Figure 4) and averaged by using ANSYS 15.0 Design Modeler.
Statistical analysis
One way ANOVA was performed using SPSS statistics 21 to confirm the difference in the microclimate temperature.
Results and discussion
Effect of slits on the air flow
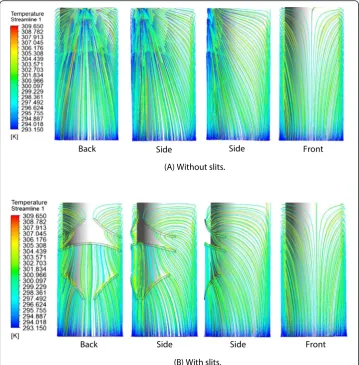
Air flow path and temperature distribution of the air layer in the cylinder with or with-out slit were analyzed (Figure 5).
When there was no slit, air goes up through the body cylinder and goes out directly through the openness of the cylinder that supposed to be neck. The streamline is rela-tively simple. Only chimney effect is observed.
When there are slits, the slits change the path of air flow and mass flow rate, and change the temperature of microclimate. The air in the back side of the cylinder flowed through lower-back slit to the outside, followed by, the mid-back and shoulder slits. Most of the air in the back side flowed to the lower-back slit; the other air that didn’t flow to the lower-back slit moved to the mid-back slit. To compare each slit, the flow rate was in the order of lower-back slits (39.17%) > mid back slit (30.90%) > shoulder slits (29.93%) (Table 3). Even though the low back slits have the same size to the
Table 2 Variables applied in the program
Total mass of the air coming in from inlet (kg/s) 0.000340277
Flow rate (m/s) 0.008333206
Viscosity of the air (kg/m · s) 0.000017894
Body temperature (°C) 36.5
shoulder slit, the air flow was about 10% higher. This explains that the air flow is higher when the openness is near to the inlet. Yoo and Kim (1996) and Chu (2000) showed that ventilation rate was affected by the distance from the opening; the shorter the dis-tance from the opening, the more robust the ventilation effect. Shoulder slits were al-most same to the mid-back slit even though the slits are away from the inlet. This is
Figure 4Spots between the slits where the average microclimate temperatures were calculated.
due to the air that comes from the front; the heated air that goes up to the neck and part of the air flows to the slit at the back.
At the front side of the cylinder, the air that flowed inside of the back rose upward and then the air flowed toward the lower-back, the mid-back, and the shoulder slits with streamlining. Because there were no slits in the front, the air that did not go out at the lower part, moved upward and gathered in the upper part of the back, where a shoulder slits are located. The air that flowed from the front side discharged through the shoulder and mid-back slits to the outside.
Temperature of the slits
By using ANSYS 15.0 Fluent, distribution of the temperature determined by the air flow was analyzed. As the cold air (20°C) comes in through the inlet, the temperatures at the slits are relatively low and do not exceed 30°C mostly, even though the cylinder temperature is 36.5°C (Table 4). This is due to the speed of air; in this study, the air speed was so fast that the air was not warmed by the cylinder temperature which as-sumes body temperature. This result suggests that we need to carefully set the wind speed and flow rate for further studies. For example, depending on the wind speed, the flow rate that goes into the garment will be different and as a result, the microclimate will be changed. The mean temperature of the slit was in the order of lower-back < mid-back < shoulder and the temperature was increased in the range of 0.3 ~ 0.4°C.
Temperature at the air gap of the cylinder
The temperature distribution in the 1 cm air gap between cylinder and cloth also shows the gradient which is by the air flow and the temperature gradient between the envir-onment temperature and the body temperature. Temperature in the simulated air layer within clothing is shown in Figure 6. The red part indicates a high temperature and the
Table 4 Average temperature of the slits
Position Temp(°C)
Body 36.5
Cloth 20.0
Inlet 20.0
Neck 27.7
Shoulder_back_L 25.7
Shoulder_back_R 25.6
Mid_back 25.3
Low_back_L 24.9
Low_back_R 24.9
Table 3 Air flow through three slits in the cylinder model
Part Mass flow rate (e-03 kg/s) (%)
Shoulder_L 0.0506 14.88
Shoulder_R 0.0512 15.05
Mid_back 0.1052 30.90
Lower_back_L 0.0666 19.58
Low_back_R 0.0667 19.59
blue part indicates a low temperature. The blue part is wide in the lower end of body cylinder and the yellowish part increases more on the top. Thus, the temperature in the upper part of body cylinder was higher than in the lower part. These results show that the air flow that did not discharge through lower-back or mid-back slits moved upward with a rising current. In other words, unless the air is well ventilated through the lower back slit, the chimney effect will bring the high temperature upward and will increase the microclimate temperature. This is in line with Lee and Ahn (1991) which showed that thermal resistance in the chest and the back part increased more due to a rising current generated in practice. This simulation explains our previous study (Lim et al. 2009), where we have reported the microclimate temperature of the back and front after the exercise wearing the non-permeable running wear jacket to see the effect of the slits at the same three positions. The temperature difference between the control and with various slits showed that the lower-back showed the highest difference and mid back then shoulder. This agrees with the results that the microclimate temperature was in the order of shoulder > mid-back > lower-back.
The two cross sections of the air layers, one from bottom and one from top are shown in Figure 7. Temperature gradient also can be read in the air gap. The top of the air layer shows higher temperature than the bottom. If we have different air velocity, the slope of the gradient will be different. In our modelling, as mentioned above, we did not use the thermal conductivity of the fabric material and we considered only the temperature differ-ence. Table 5 shows that the heat-transfer through the cloth and slits.
Figure 6Temperature distribution in the air layer according to the air flow.
Considering that the heat transfer by convection is determined by the equation (1), the heat is mostly (78.6%) lost to the environment due to the temperature difference and by the cold air from the inlet (19.8%). The heat transfer at the slit was in the order of shoulder > mid-back > lower-back. In this case heat conductivity of the cloth is not considered. If the conductivity of the material is considered and becomes low, the relative effect of the slit will be increased.
Q¼hA Tcylinder‐Tair
V1=2 ð1Þ
Where Q; convective heat transfer h; coefficient for convective heat transfer A; surface area of the cylinder
T; temperature V1/2; wind velocity
In our future study, if we have materials of different conductivity, we will be able to find the temperature difference from top to bottom and the distribution of the temperature at the various level of the cross section. In this way we can predict the air flow path and rate and can apply to the design of the slits to get the maximum effect of the ventilation.
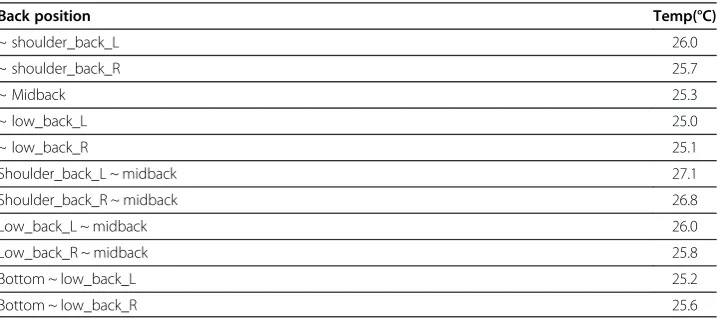
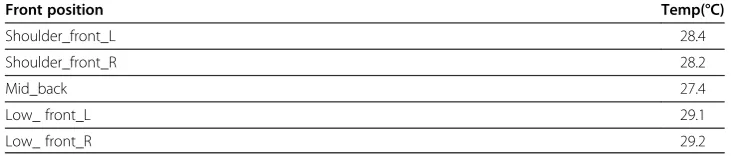
Temperatures around slit and between slits
Table 6 shows the microclimate temperature around and between each slit. Air temperature that came out of the slit was significantly lower than that slit or around the slits (Table 7). This was due to the environmental temperature that was set at 20°C. To verify the effect of the slits, the mean temperature of the front at the same spot was cal-culated (Table 8). The temperature was 2.1 ~ 4.3°C higher than the part where there were Table 5 Heat transfer rate according to the position in the cylinder model
Position (%)
Cloth 78.60
Inlet 19.80
Shoulder_L 0.40
Shoulder_R 0.40
Midback 0.45
Lowback_L 0.17
Lowback_R 0.18
Total (body) 100.00
Table 6 Temperatures around each slit and between each slit
Back position Temp(°C)
~ shoulder_back_L 26.0
~ shoulder_back_R 25.7
~ Midback 25.3
~ low_back_L 25.0
~ low_back_R 25.1
Shoulder_back_L ~ midback 27.1
Shoulder_back_R ~ midback 26.8
Low_back_L ~ midback 26.0
Low_back_R ~ midback 25.8
Bottom ~ low_back_L 25.2
no slits. This result indicates that the slits can decrease the microclimate temperature around this range. This requires further study that how this temperature difference will be observed in the actual garment system at various wind speed and how it will affect to the thermal comfort sensation of the human body.
Conclusions
The ventilation effects for different slit positions induced by air flow and temperature distribution were predicted with CFD. In simulated modeling with left and right slits in the shoulder and lower back and one mid back slit, air flow rates increased in the order of shoulder slits < mid-back slit < lower-back slit. The greater part of the air in the front side flowed upward and emitted through the shoulder slits. Front part showed higher temperature than the back part.
This study was performed to find out the usefulness of CFD for the prediction of the microclimate temperature and humidity changes in the human body model wearing garments. As the first attempt, effects of the slits were investigated. The use of CFD that accounts for the effect of ventilation through air flow and temperature distribution has been shown to provide relatively good predictions. Though simulated modeling is able to account for air flow and temperature distribution as well as the importance of slit position, some points still remain to be considered, such as the shape of the cloth-ing and changes in slits due to the swcloth-ingcloth-ing motion of the active body. In our future study, effect of layering of clothing, phase changing materials that change the microcli-mate temperature and humidity according to the changes of environmental changes, thermal conductivity of fabrics, porosity or air permeability of materials will be applied and as variables and investigate the heat and moisture flow within the clothing layers. These series of studies will allow us to look into the mechanisms how the microclimate changes with the time in the dynamic changes of environmental conditions. In addition, this study will provide the in-depth understanding of heat and moisture trans-port through garments at the extreme conditions.
In this way, we will be able to accumulate the data to maximize thermal comfort or physiological safety properties of products and this will contribute finally to the evolu-tion of fashion technology.
Table 8 Mean temperature of the front part corresponding to the parts where the slits are in the back
Front position Temp(°C)
Shoulder_front_L 28.4
Shoulder_front_R 28.2
Mid_back 27.4
Low_ front_L 29.1
Low_ front_R 29.2
Table 7 One way ANOVA for temperatures between the slits
Source SS df MS F ratio P-value
Treatment 308.763 10 30.876 3.793 .000
Error 2596.577 319 8.140
Competing interests
The authors declare that they have no competing interests.
Authors’contributions
JL, EKR, HY and EK contributed to conception and design of the study. JL and HC carried out CFD analyses. EK and EKR drafted manuscript. All authors read and approved final manuscript.
Funding
This work was partially supported by the National Research Foundation of Korea (NRF) grant funded by the Korea government (MEST) (No. NRF-2012R1A2A2A03047265).
Author details
1Department of Textile and Apparel, Technology and Management, North Carolina State University, 27695 Raleigh, USA.2Department of Clothing and Textiles, Yonsei University, Seoul 120-749, Korea.3Department of Clothing & Textiles, Chonbuk National University, Jeonju-si 561-756, Korea.4Department of Clothing & Textiles, University of Ulsan, Ulsan 680-749, Korea.
Received: 4 March 2014 Accepted: 1 December 2014
References
Shivers, JL, Yeh, K, Fourt, L, Spivak, & Norman, SM. (1977). The effects of design and degree of closure on microclimate air exchange in lightweight cloth coats. In NRS Hollies & RF Goldman (Eds.),Clothing Comfort: Interaction of Thermal, Ventilation, Construction and Assessment Factors (pp.167-168 ). Ann Arbor Science: Michigan: Ann Arbor. Lim, JH, Roh, EK, Yoo, HS, & Kim, EA. (2009). Ventilation and comfort sensation by slit positions of running wear jackets.
Journal of the Korean Society of Clothing and Textiles, 33(11), 1794–1805. doi:10.5850/JKSCT.2009.33.11.1794. Birnbaun, RR, & Crockford, GW. (1978). Measurement of the clothing ventilation index.Appl. Ergon., 9(4), 194–200. Crockford, GW, Crowder, M, & Prestidge, SP. (1972). A trace gas technique for measuring clothing microclimate air
exchange rates.British Journal of Industrial Medicine, 29(4), 378–386.
Havenith, G, Heus, R, & Lotens, WA. (1990). Clothing ventilation, vapour resistance and permeability index: changes due to posture, movement and wind.Ergonomics, 33(8), 989–1005. doi:10.1080/00140139008925308.
Chu, MS, & Nakajima, T. (1997). Assessment of clothing ventilation by a trace gas method.Journal of the Korean Society of Clothing and Textiles, 21(8), 1387–1395.
Satsumoto, Y, Wang, H, Hasebe, Y, Ishikawa, K, & Takeuchi, M. (2000). The effect of bellows action on heat transfer in clothing system. Part 1. The effect of size of air space and air permeability of clothing.Fiber, 56(11), 524–536. Satsumoto, Y, & Havenith, G. (2010). Evaluation of overall and local ventilation in diapers.Textile Research Journal 80(17),
1857–1871. doi:10.1177/0040517510369402.
Ghali, K, Ghaddar, N, & Jones, B. (2002). Modeling of heat and moisture transport by periodic ventilation of thin cotton fibrous media.International journal Heat of Mass Transfer, 45, 3703–3714. doi:10.1016/S0017-9310(02)00088-1. Ghaddar, N, Ghali, K, & Jreije, B. (2008). Ventilation of wind-permeable clothed cylinder subject to periodic swinging
motion: Modeling and experimentation.Journal of Heat Transfer, 130(9), 091702-1~11. doi:10.1115/1.2944245. Barry, J, Hill, R, Brasser, P, Sobera, M, Kleijn, C, & Gibson, P. (2003). Computational fluid dynamics modeling of fabric
systems for intelligent garment design.MRS bulletin 28(08), 568–573.
Chowdhury, H, Alam, F, & Subic, A. (2010). Aerodynamic performance evaluation of sports textile.Procedia Engineering, 2(2), 2517–2522.
Barry, JJ, & Hill, RW. (2003). Computational modeling of protective clothing.International Nonwovens Journal, 12, 25–34. Jiang, Y, Yanai, E, Nishimura, K, Zhang, H, Abe, N, Shinohara, M, & Wakatsuki, K. (2010). An integrated numerical simulator for
thermal performance assessments of firefighters’protective clothing.Fire Safety Journal, 45(5), 314–326.
Talukdar, P, Torvi, DA, Simonson, CJ, & Sawcyn, CM. (2010). Coupled CFD and radiation simulation of air gaps in bench top protective fabric tests.International Journal of Heat and Mass Transfer, 53(1), 526–539.
Ambesi, D, Bouma, R, den Hartog, E, & Kleijn, CR. (2013). Predicting the chemical protection factor of CBRN protective garments.Journal of occupational and environmental hygiene, 10(5), 270–276.
Zhu, FL, & Zhou, Y. (2013). Modelling heat-moisture transport through firefighters’protective fabrics from an impinging flame jet by simulating the drying process.Fibers & Textiles in Eastern Europe, 21(5), 85–90.
Ambesi, D, Kleijn, CR, Hartog, EA, Bouma, RH, & Brasser, P. (2014). Forced convection mass deposition and heat transfer onto a cylinder sheathed by protective garments.AIChE Journal, 60(1), 353–361. doi:10.1002/aic.14246.
Elgafy, A, & Mishra, S. (2014). A heat transfer model for incorporating carbon foam fabrics in firefighter’s garment.Heat Mass Transf., 1–13. doi:10.1007/s00231-013-1259-z.
Noca, F, Shiels, D, & Jeon, D. (1999). A comparison of methods for evaluating time-dependent fluid dynamic forces on bodies, using only velocity fields and their derivatives.Journal of Fluids and Structures, 13(5), 551–578.
Defraeye, T, Blocken, B, Koninckx, E, Hespel, P, & Carmeliet, J. (2011). Computational fluid dynamics analysis of drag and convective heat transfer of individual body segments for different cyclist positions.J. Biomech., 44(9), 1695–1701. Tanabe, SI, Kobayashi, K, Nakano, J, Ozeki, Y, & Konishi, M. (2002). Evaluation of thermal comfort using combined
multi-node thermoregulation (65MN) and radiation models and computational fluid dynamics (CFD).Energy and Buildings, 34(6), 637–646.
Cimilli, SD, Deniz, E, Candan, C, & Nergis, BU. (2012). Determination of natural convective heat transfer coefficient for plain knitted fabric via CFD modeling.Fibres& Textiles in Eastern Europe, 20(1), 90.
Havenith, G, Pogarty, A, Bartlett, R, Smith, CJ, & Ventenat, V. (2008). Male and female upper body sweat distribution during running measured with technical absorbents.European Journal of Applied Physiology, 104(2), 245–255. doi:10.1007/ s00421-007-0636-z.
Yoo, HS, & Kim, EA. (1996). Comparison of the effect of clothing materials and the openness of garment on the microclimate of the skin simulating system.Journal of the Korean Society of Clothing and Textiles, 20(6), 1084–1095. Chu, MS. (2000). Assessment of clothing ventilation through openings.The Research Journal of the Costume Culture,
8(5), 660–667.
Lee, YS, & Ahn, TW (1991). Sportswear physiological Optimization; Effect of clothing ease, local heating and materials.
Journal of the Korean Society of Clothing and Textiles, 15(2), 127–138.
Submit your manuscript to a
journal and benefi t from:
7 Convenient online submission
7 Rigorous peer review
7 Immediate publication on acceptance
7 Open access: articles freely available online
7 High visibility within the fi eld
7 Retaining the copyright to your article