Validity & reliability of the Persian version of Grasha-Richmann student
learning styles scale
ALI REZA BANESHI, NOROUZ ALI KARAMDOUST, REZVAN HAKIMZADEH
University of Tehran, Tehran, Iran
Introduction: The present study aimed to investigate the psychometric properties of Grasha-Riechmann Student Learning Styles Scale.
Method: The participants included 1039 students (421 students in human and 618 students in technical sciences), selected through the stratified sampling method from Tehran University. They answered the Grasha-Riechmann student learning style scale and the data was analyzed with exploratory and confirmatory factor analyses.
Results: The findings acquired from exploratory factor analysis (n=561), using principal components analysis with varimax rotation showed that Grasha-Riechmann Student Learning Styles Scale includes six factors: Avoidant, Collaborative, Participative, Dependent, Competitive, and Independent. The factors acquired from confirmatory factor analysis (n=478), as model fit indices indicated, was confirmed by indices in exploratory factor analysis. The internal consistency of each subscale, ranging from 0.58 to 0.80, was at an acceptable level.
Conclusion: According to the findings, it seems that Participative Styles Scale to be an instrument qualifying validity and reliability for measuring learning interactive styles.
Validity, Reliability, Grasha-Richmann scale, Learning styles
Keywords:
Corresponding author: Ali Reza Baneshi Address: Department of Psychology and Education, University of Tehran, Tehran, Iran
Email:[email protected]
Please cite this paper as: Baneshi AR, Karamdoust NA, Hakimzadeh R. Studying validity & reliability of the Persian version of Grasha-Richmann student learning styles scale. J. Adv Med&Prof. 2013;1(4):119-124.
Received : 16 April 2013 Accepted: 29 August 2013
Introduction
N
o doubt studying the issue of learning, its theories, its nature and the factors affecting it are extremely important for education. As a result, many researchers have explored to identify factors affecting learning and explain the learners’ differences in academic performance. According to Ackerman, Sternberg, and Glaser (1989), the review of literature suggests that two specific categories of predictor variables have been found to explain learning (1). Sarter and Jones state that the first category includes cognitive measures and ability tests (1). The second category of measures which is used to predict differences among students is non-cognitive measures. Such measures include thinking styles (2, 3) and learning styles (4). In new psychological approaches, non-cognitive factors as well as learning process are more emphasized than the learning product and individuals’ abilities. In order to better understand the learning process and the factorsinfluencing it, psychology researchers have shifted their orientation from individuals’ fixed abilities and characteristics (intelligence) to cognitive and non-cognitive factors. So there has been more attention to non-cognitive factors of learning in current studies. In many cases, the individuals’ preferred learning style which is known as learning style can be the cause of differences among learners.
performance and others made attempts to develop a framework for the study of learning and teaching styles on the base of empirical observations (3).
Like any other constructs in the area of psychology, it is difficult to find a precise definition for learning styles accepted by all. In the theoretical and research literature, learning style is sometimes referred to as cognitive style or learning preference. Festco & Mcclure (2005) argue that though cognitive style refers to the individual preference, it cannot be considered as learning style (6). Learning style is defined as the way which helps the learner to process information. Learning styles are not limited to cognitive aspects (perception, processing, and cognitive interpretation). In order to define learning styles, some focus on information processing, some on learners’ behavior and some others focus on social interaction. With an emphasis on the preferred aspect of learning style, Woolfolk (2004) defines learning style as “the individual’s preferred way of learning and studying, such as using pictures instead of books, working with others rather than working individually, learning in structured versus unstructured situations and so on” (6). Form this definition, it is understood that the style is preference, not ability. So we can equate the term ‘learning styles’ with learning preferences. Given (1996) considers learning style as an emotional, social, cognitive, and physiological method which an individual prefers to apply for receiving, processing, manipulating and using information (7). Kolb (1974) sees learning style as a way to emphasize some learning abilities rather than other ones (7).
Accordingly, experts like Keefe (1979), Corey (1983), Sternberg and Grigorenko (1997) developed categorizations for learning styles, on the basis of the underlying theory (5). Other than what the focus of each of these categorizations is and which aspect of class activities is considered, there is always the question that “What factors influence learning style which is a very important factor in determining the performance levels?”. In other words, what are the factors affecting learning style? This issue has not been greatly attended by researchers and the number of studies conducted to investigate the factors influencing the preferred style of learning is very small (8).
Heinstrom (2000) believes that, in most cases, the antecedent variables of learning styles, as well as learning approaches and strategies are influenced by individual characteristics (9). Also, Hawk (1993) suggests students’ basic characteristics such as communicative styles, and attitudes toward learning should be considered to better understand individual differences in academic achievement and in using
learning strategies (9). Heinstrom (2000) suggests that men and women are different in communicative and interactive styles and in their attitudes toward learning (9).
Grasha and Riechmann (1996) are among the few researchers who didn’t limit themselves to cognitive aspects of learning styles and in the definition they provide for learning styles, they consider learning styles as social interactions and define them as different roles students have in interaction with classmates, teachers and course content (10). Accordingly, they present a model on the basis of students’ responses to classroom activities. From their point of view, learning styles can be identified by social and emotional dimensions like attitudes toward learning, interaction with teachers and classmates. In this definition of learning styles, communicative and interactive aspects of styles in the classroom are emphasized.
Research on learning styles which have been conducted in Iran (11-15) have focused on cognitive and personal aspects, but so far no research has been carried on students’ interactive learning styles (participation). As mentioned, Grasha and Riechmann style (1996) examines the interaction between people. The tool for measuring this type of learning style (learning participation) which is developed by Grasha and Riechmann consists of six styles. These six styles are avoidant, participative, collaborative, dependent, independent, and competitive styles.
students believe that they have to compete with other students in the classroom to get reward.
Although there are various uses for Grasha and Riechmann questionnaire in educational environments, reliability and validity of this questionnaire have not been examined yet. Given the importance of contextual issues such as culturalization in using tools and questionnaires, this study aimed to examine and report validity and reliability of Grasha and Riechmann learning styles questionnaire.
Method
The statistical method used in this study was correlation since we used covariance matrix in order to lessen a set of data and to come to latent variables (constructs).
The population of the study consisted of the undergraduate and graduate students of Tehran University in 2011 and 2012. In order to get the study sample, stratified sampling was used. Therefore, at first the faculties were classified to technical sciences and humanities (psychology, social sciences, management, …) and then, 33 individuals were selected from each group. The following formula was used to calculate the sample size.
=760
ε=Error
Z= Confidence interval= 1.96 N=Population
The minimum sample size was 760 so 416 individuals were selected from technical sciences faculty and 344 were selected from humanities faculty. Since exploratory and confirmatory factor analyses need large sample size, in this study 1200 were selected and after we omited questionnaires which weren’t
answered correctly, 1039 (421 humanities and 618 technical sciences) students remained.
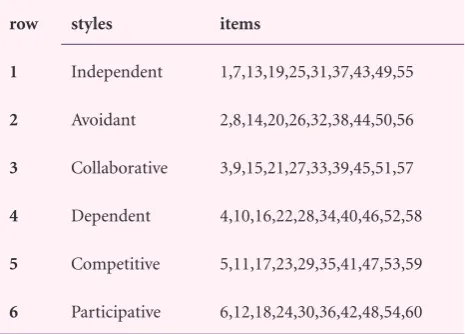
Grasha-Riechmann Learning Styles Scale has 60 items with options in a 5 degree likert scale from strongly agree to strongly disagree. This scale consists of six subscales: independent (10 items), dependent (10 items), avoidant (10 items), participative (10 items), competitive (10 items), and collaborative (10 items) (Table 1).
About the process of preparing the questionnaire, it seems necessary to note that the questionnaire was first translated into Persian and then, two English experts were asked to translate it into English. The differences between the English and Persian versions were investigated, and these differences were reduced to minimum and on this basis, the equivalence of Persian and English versions were carefully examined. Then, several faculty members confirmed content validity and cultural adaptation of the questionnaire.
Next, for scale clarification, a pilot study was done on college students (30 boys and girls) with the aim of statements understandability to find ambiguities. After clarification, in the second step, the scale of participation styles in learning was administered in groups of female students (n=22) and male ones (n=25)
row styles items
1 Independent 1,7,13,19,25,31,37,43,49,55
2 Avoidant 2,8,14,20,26,32,38,44,50,56
3 Collaborative 3,9,15,21,27,33,39,45,51,57
4 Dependent 4,10,16,22,28,34,40,46,52,58
5 Competitive 5,11,17,23,29,35,41,47,53,59
6 Participative 6,12,18,24,30,36,42,48,54,60
Table 1. Grasha-Riechmann Learning Styles Scale’s subscales and items
Table 2. Eigenvalue, explained variance, the matrix of correlation, and Cronbach alpha coefficients (matrix’s diagonal)
styles Eigenvalues % of Variance Cumulative % 1 2 3 4 5 6
1- Avoidant 8.11 7.78 7.78 0.75
2- Collaborative 3.39 6.95 14.72 0.28-** 0.74
3- Participative 3.10 6.88 21.60 -0.69** 0.43** 0.80
4- Dependent 2.40 6.76 28.36 -0.09** 0.22** 0.38** 0.71
5- Competitive 1.92 6.68 35.04 -0.29** 0.30** 0.51** 0.38** 0.77
6- Independent 1.65 5.29 40.33 0.02 -0.17** 0.00 -0.03 0.07** 0.58
in technical and humanities faculties to determine the effectiveness of the item corrections, and to confirm understandability of the whole scale. After ensuring the clarity of the questions, we administered the questionnaire.
Results
Exploratory and confirmatory factor analyses were used to examine the validity of participative style. The total sample was divided into two parts for both exploratory and confirmatory analyses. Before exploratory factor analysis, 561 individuals were selected randomly from the total sample by SPSS software and in order to examine the assumption of multicollinearity, correlation (less than 0.80) between the factors was studied. Based on the correlation coefficients (Table 2), it can be understood that there is no multicollinearity between factors.
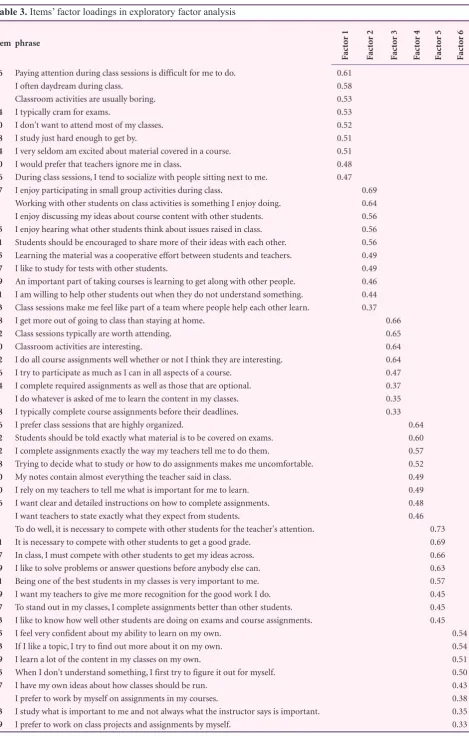
Exploratory factor analysis was performed using principal components and varimax rotation and the questions with factor loadings less than 0.30 were excluded from the analysis (23, 7, 35, 60, 31.24, 34, 32, and 58). The resulted factor structure presented six factors respectively as avoidant, collaborative, participative, dependent, competitive and independent, the first of which with 8.11 eigenvalue and the last with 1.65 (Table 2) and all of the six factors explained %40.33of the variance. Item factor loadings for each item are reported in Table 3.
Confirmatory factor analysis was performed on the remaining 478 participants to confirm the exploratory analysis and the index of sampling adequacy (KMO=0.85) was obtained. Lawrence S. Meyers et al. (2007) consider the index more than 0.75 suitable (16). Model goodness of fit indices in exploratory factor analysis, ratio of chi-square to degrees of freedom (χ2/df=1.98), Goodness of Fit Index (GFI=0.94),
Adjusted Goodness of Fit Index (AGFI=0.91) and Root Mean Square Error of Approximation (RMSEA=0.046) were desirable. On the basis of these indices, it can be concluded that the assumed model has a goodness of fit to the data (16). After confirmatory factor analysis, Cronbach alpha coefficients were between 0.58 and 0.80 and the total coefficient of the test was 0.75. The results are reported on the diagonal of correlation matrix in Table 3.
Discussion
Grasha and Riechmann are among few researchers who don’t limit learning styles to cognitive aspects. They consider learning styles as social interactions and define these styles as different roles that students have when interacting with classmates, teachers and content. This study examined the psychometric
properties of the Persian version of Grasha-Riechmann participation styles in learning. On this basis, we examined their model based on students’ responses to classroom activities and also through the social and emotional aspects, such as attitude to learning, and also through interaction with teachers or classmates. Evidence gained from principal components analysis showed that factor structure of this version of participation styles in learning was in accordance with the original version of the questionnaire based on Grasha-Riechmann’s learning styles theory (10).
The Grasha-Riechmann learning styles questionnaire was tested by the use of confirmatory factor analysis and the obtained indices showed that the model has goodness of fit (17). Correlation coefficients for the questionnaire’s factors indicated that though there was a relative relationship between the factors, each factor had items which are separate from other factors and there wasn’t collinearity between factors.
Conclusion
The obtained factor structure of the Persian version had a considerable relevance with the factor structure of factor analysis of the original one. Results from exploratory and confirmatory factor analysis verified the construct validity of participation styles in learning that is consistent with what other researchers have found. This well-known tool which has been used in many countries and cultures (18, 19, 20, 21) was a valid and reliable scale to measure learning styles. The internal consistency coefficients of these factors and the whole questionnaire showed that the questionnaire had acceptable reliability.
Reflecting on Grasha-Riechmann’s learning styles, we can understand that: a) styles don’t have two categories. b) Each student can use different styles in different situations. c) Students with avoidant style don’t often participate in classroom learning activities and they may have difficulty in achieving goals, so this learning style is not appropriate. But other styles aren’t good or bad per se and using a style can vary due to the person, the task he is doing, and the situation in which the task is performed.
Limitation and assumption
Table 3. Items’ factor loadings in exploratory factor analysis
Item phrase
Fact
or 1
Fact
or 2
Fact
or 3
Fact
or 4
Fact
or 5
Fact
or 6
26 Paying attention during class sessions is difficult for me to do. 0.61
2 I often daydream during class. 0.58
8 Classroom activities are usually boring. 0.53
44 I typically cram for exams. 0.53
20 I don't want to attend most of my classes. 0.52
38 I study just hard enough to get by. 0.51
14 I very seldom am excited about material covered in a course. 0.51
50 I would prefer that teachers ignore me in class. 0.48
56 During class sessions, I tend to socialize with people sitting next to me. 0.47
57 I enjoy participating in small group activities during class. 0.69
3 Working with other students on class activities is something I enjoy doing. 0.64
9 I enjoy discussing my ideas about course content with other students. 0.56
15 I enjoy hearing what other students think about issues raised in class. 0.56
21 Students should be encouraged to share more of their ideas with each other. 0.56
45 Learning the material was a cooperative effort between students and teachers. 0.49
27 I like to study for tests with other students. 0.49
39 An important part of taking courses is learning to get along with other people. 0.46
51 I am willing to help other students out when they do not understand something. 0.44
33 Class sessions make me feel like part of a team where people help each other learn. 0.37
18 I get more out of going to class than staying at home. 0.66
12 Class sessions typically are worth attending. 0.65
30 Classroom activities are interesting. 0.64
42 I do all course assignments well whether or not I think they are interesting. 0.64
36 I try to participate as much as I can in all aspects of a course. 0.47
54 I complete required assignments as well as those that are optional. 0.37
6 I do whatever is asked of me to learn the content in my classes. 0.35
48 I typically complete course assignments before their deadlines. 0.33
46 I prefer class sessions that are highly organized. 0.64
52 Students should be told exactly what material is to be covered on exams. 0.60
22 I complete assignments exactly the way my teachers tell me to do them. 0.57
28 Trying to decide what to study or how to do assignments makes me uncomfortable. 0.52
40 My notes contain almost everything the teacher said in class. 0.49
10 I rely on my teachers to tell me what is important for me to learn. 0.49
16 I want clear and detailed instructions on how to complete assignments. 0.48
4 I want teachers to state exactly what they expect from students. 0.46
5 To do well, it is necessary to compete with other students for the teacher's attention. 0.73
11 It is necessary to compete with other students to get a good grade. 0.69
17 In class, I must compete with other students to get my ideas across. 0.66
29 I like to solve problems or answer questions before anybody else can. 0.63
41 Being one of the best students in my classes is very important to me. 0.57
59 I want my teachers to give me more recognition for the good work I do. 0.45
47 To stand out in my classes, I complete assignments better than other students. 0.45
53 I like to know how well other students are doing on exams and course assignments. 0.45
25 I feel very confident about my ability to learn on my own. 0.54
43 If I like a topic, I try to find out more about it on my own. 0.54
19 I learn a lot of the content in my classes on my own. 0.51
55 When I don't understand something, I first try to figure it out for myself. 0.50
37 I have my own ideas about how classes should be run. 0.43
1 I prefer to work by myself on assignments in my courses. 0.38
13 I study what is important to me and not always what the instructor says is important. 0.35
References
1. Zhang LF, Sternberg RJ. Thinking styles, abilities, and academic achievement among Hong Kong university student. Hong Kong educational research association. 1998;13:41-62.
2. Sternberg RJ, Grigorenko E.L. Are cognitive styles still in style? American psychologist. 1997;52(7):700-12. 3. Zhang LF. Thinking styles: Their relationships with
modes of thinking and academic performance. Educational Psychology. 2002; 22:331–48. doi: 10.1080/0144341022013855.
4. Grasha AF, Riechmann S.W. A rational to developing and assessing the construct validity of a student learning styles scale instrument. Journal of Psychology. 1974; 87: 213-23.
5. Imamipour S, Shams Esfandabad, H. Learning and cognitive styles. Tehran: Samt; 2011. Persian.
6. Seyf AA. Modern Educational Psychology. Tehran: Nashre Doran; 2011. Persian.
7. Montgomery SM. Student learning styles and their implications for teaching. University of Michigan Ann Arbor, MI 1998.
8. Seidel LE, England EM. Gregorc’s cognitive styles: college
students’ preferences for teaching methods and testing techniques. Percept Motor Skills. 1999;88(3):859-75. 9. Entwistle NJ, Ramsden P. Understanding Student
Learning. London: Croom Helm; 2007.
10. Grasha AF. Teaching with style: A practical guide to enhancing learning by understanding teaching and learning style. Pittsburgh: Alliance publishers; 1996. 11. Ahmadi S, Khezri H. The relationship between math
anxiety and students’ learning styles. New thought in education of Roudehen Azad University. 2006;1(4). Persian.
12. Arizi HR, Abedi A. Taji M. The relationship between
learning styles profile of guidance school students in Isfehan and their academic performance in math and science. Educational Innovations Quarterly. 2010;34. Persian.
13. Elahi T. The relationship between field-Dependent and field-independent learning styles and achievement in English: Tarbiat Modarres University; 2002. Persian. 14. Hoseininasab D, Valinejad Y. Examination of
field-Dependent and field-independent cognitive styles and self-regulated learning with math performance of third grade students in guidance school. Journal of Psychology & education. 2003;3(3/4): 65-78. Persian. 15. Kadivar P, Homayouni A.R, Abdollahi M.H. The
Relationship between cognitive learning styles and course choosing among male students in high school 2006. Persian.
16. Meyers LS, Gamst G.C, Guarino A.J. Applied multivariate research. Tehran: Roshd; 2011. Persian. 17. 17. Hooman HA. Structural Equation Modeling by
LISRELL software. Tehran: Samt; 2009. Persian. 18. Aijaz AG, Rabia T. Assessing learning styles of student
teachers at federal college of education. Procedia Social and Behavioral Sciences. 2011; 30: 267 – 71. Persian. 19. Amir R, Jelas Z.M. Teaching and learning styles in
higher education institutions: Do they match. Procedia Social and Behavioral Sciences.7(C):680–4. Persian. 20. Baykul Y, Gürsel M, Sulak H, Ertekin E, Yazıcı E,
Dülger O. et al. Validity and reliability study of Grasha-Riechmann student learning style scale. International Journal of Human and Social Sciences. 2010;5(3): 177-84.