ISSN 2319-8133 (Online (An International Research Journal), www.physics-journal.org
A Study on Interaction of a Tunable Laser Beam with
High-resolution Lines of Ozone in 4642 – 4644 cm
-1Surajit Bhuyan
Department of Physics,
Lakhimpur Girls' College, Assam, INDIA. e-mail: [email protected]
(Received on: May 13, 2015)
ABSTRACT
Interaction of a tunable narrow linewidth-laser beam with the infrared absorption lines of ozone in the region of 4642 -4644 cm-1 is studied using the quasi-random model of molecular band absorption. Values of transmittance, computed at intervals of 0.1 cm−1, are obtained for three different absorber thicknesses. The generated absorptance values, which simulate the intensities of the high-resolution absorption lines of ozone, are compared with those generated by the line-by-line (LBL) method.
Keywords: Line by line method, ozone, quasi–random model, transmittance,
tunable laser beam.
1. INTRODUCTION
Ozone is a gas that is naturally present in our atmosphere. It usually forms when some type of radiation or electrical discharge separates the two atoms in an oxygen molecule (O2), which can then individually recombine with other oxygen molecules to form ozone
(O3). The ozone layer is a layer in earth's atmosphere which contains relatively high
concentrations of ozone (O3), although it is still very small with regard to ordinary oxygen,
is imperative for accurate measurements involving the interaction a laser beam through the atmosphere. Infrared spectra of O3 have been recorded in the 4642 cm
-1
region with a Fourier Transform Spectrometer at 0.008 cm-1 resolution using white type cell and this spectral region corresponds to the
3 3 2
1 ν ν
ν + + and
3 4
2 ν
ν + band.
A computer program was developed by Dryson in 1966 to determine the atmospheric transmittance by direct integration (line-by-line) method across the absorption band, using theoretically calculated line position and strength3. The LBL algorithm has been used to evaluate the absorption co-efficient to high numerical accuracy4. The most accurate theoretical procedure to calculate the absorptance of a vibrational rotational band is probably the line-by-line method or direct integration method5. The line-by-line approach provides a mean of direct consideration of the detailed spectral structure of the gases from the microwave to the infrared6. The quasi-random model of molecular band absorption is a variant of one of the methods described by Goody and Yung7. Infrared transmittances, based on the quasi-random model, have been calculated for H2O and CO2 and the results fitted with
experimental measurements8, 9. In this work we consider a tunable laser having line width very narrow in the vicinity of 4642 cm-1. Interaction of this laser beam with nearby absorption lines of ozone is studied with the help of both quasi random model and LBL model.
2. METHODS OF COMPUTATION
2.1 Quasi-random model
A detail description of the quasi-random model can be found elsewhere10. The quasi-random model characterizes the wing effects accurately, i.e. it takes into account the absorption of spectral lines in as many neighboring intervals as necessary. Each interval Ω, over which the average transmittance is required, is further divided into smaller intervalsδ. Each line may be said to be localized within an error defined by the interval size δ. These elementary intervals are chosen small enough to ensure an accurate description of the important band characteristics, yet large enough to simplify the calculations. All the lines falling within a given order of magnitude are subsequently averaged, and each line in each intensity sector is then associated with the appropriate average value. Since the top five intensity sectors in each frequency interval are found to be sufficient to describe the absorptive properties associated with the lines therein. The quasi-random model localizes each line within an error defined by the interval size δ. The transmittance at a frequency ν, as affected by np lines within the interval δp is computed from the expression
( )
(
)
(
)
i p n i iiu d
S ν T + − −
=
Π
∫
= ν ν α ν
π α δ
δ 2 2
5 1 i / exp /
1 (1)
where ni represents the number of lines within the intensity range i, which itself is
absorber thickness, and νi refers to the centre of the line. The gases of the atmosphere are
usually measured by the unit atmosphere centimetre (atm-cm). This measurement unit is used to define an atmospheric gas distributed along a path reduced to a layer at STP, provided the other gases are excluded. The resulting thickness is then expressed in atm-cm, given by u = cLP, where c is the fractional concentration of the absorber, L is the path length in cm and P is the pressure in atmosphere.
2.2 Line–by–line model
This method consists of calculating the absorption co-efficient, and then the transmittance, at a large numbers of frequency locations within the spectral range of interest. Since absorption co-efficient is a fast varying function of frequency, it has to be evaluated at very closely spaced locations. The total absorption co-efficient at any frequency location is made up of contributions from a large number of lines in the vicinity of that frequency.
The monochromatic volume absorption coefficient k at a frequency n can be computed as
1
(
,
)
n
i i
i
k
S b
ν ν
=
=
∑
(2)Where b (ν, νi ) is the Lorentz shape factor defined by
2 2
) (
/ )
, (
α ν
ν
π α ν
ν
+ −
=
i i
b (3)
The absorptance values are obtained from the expression
1 1 ku
A = − = −T e− (4)
LBL computation though accurate, have the disadvantage that they require large computation times because a number of function Si b(ν,νi) in sum may reach tens of thousands.
3. COMPUTATION OF ABSORPTANCE
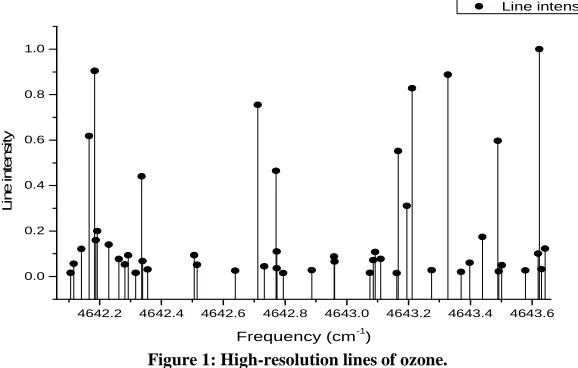
The calculation of the transmittance requires knowledge of the frequency and intensity of each and every spectral line which contributes significantly to the absorption in the frequency range of interest. The manuscript Line position and intensities of the
3 3 2
1 ν ν
ν + + ,ν 2 + 4ν 3 and 3ν1 + 2ν 2 bands of ozone, Journal of Molecular
and right adjacent intervals are also included. The transmittance at the center of an interval is finally obtained as9
∏
≠= j i
i j T
T T
(5)
Next, transmittance values are obtained for another set of frequency intervals whose centers are shifted by half the interval size (0.05 cm-1) from the original positions of the centers of the intervals. This is done in order to minimize the error associated with the occurrence of lines at frequencies near the edges of a given interval. The results for the shifted and un-shifted intervals are averaged, and thus we obtain the average transmittance over a 0.1 cm-1 interval.
4. RESULTS AND DISCUSSION
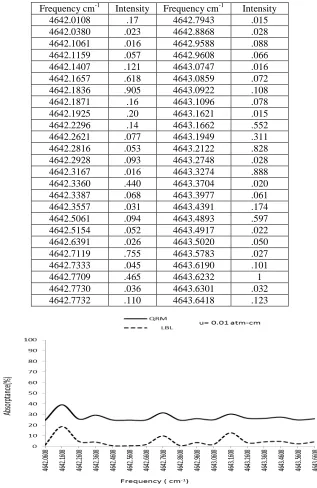
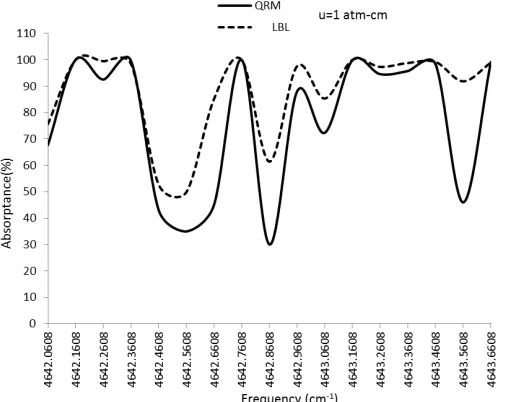
Results of the study on the propagation of a 4642 cm-1 free electron laser beam through three different path lengths (0.01, 0.1 and 1 atm-cm) of the absorber (atmospheric ozone) are given in Table 2 and displayed in the Figure 2, 3 and 4 for quasi-random-model and line-by-line model. The basic shapes of the absorptance versus frequency curves in the two models have come out to be similar. Because of the consideration of bands instead of lines, variations in quasi-random model values are generally observed to be not as sharp as those in the line-by-line values. The quasi-random curves are relatively smoother as compared to the LBL ones. The prominent absorptance peaks are observed due to the presence of very strong lines near those regions. Thus we see that the experimental data taken for this work agree well with the results. This concludes that the quasi-random model for simulating the intensity distribution by grouping the lines in a given frequency interval works reasonably well – a fact established in recent times for important atmospheric species like nitrogen11, 12, sulphur dioxide13 and methane14.
4642.2 4642.4 4642.6 4642.8 4643.0 4643.2 4643.4 4643.6 0.0
0.2 0.4 0.6 0.8 1.0
Line intensity
L
in
e
i
n
te
n
s
it
y
Frequency (cm-1)
Table 1: Ozone lines affecting the propagation of 2.2 µµµµm tunable laser beam.
Frequency cm-1 Intensity Frequency cm-1 Intensity
4642.0108 .17 4642.7943 .015
4642.0380 .023 4642.8868 .028
4642.1061 .016 4642.9588 .088
4642.1159 .057 4642.9608 .066
4642.1407 .121 4643.0747 .016
4642.1657 .618 4643.0859 .072
4642.1836 .905 4643.0922 .108
4642.1871 .16 4643.1096 .078
4642.1925 .20 4643.1621 .015
4642.2296 .14 4643.1662 .552
4642.2621 .077 4643.1949 .311
4642.2816 .053 4643.2122 .828
4642.2928 .093 4643.2748 .028
4642.3167 .016 4643.3274 .888
4642.3360 .440 4643.3704 .020
4642.3387 .068 4643.3977 .061
4642.3557 .031 4643.4391 .174
4642.5061 .094 4643.4893 .597
4642.5154 .052 4643.4917 .022
4642.6391 .026 4643.5020 .050
4642.7119 .755 4643.5783 .027
4642.7333 .045 4643.6190 .101
4642.7709 .465 4643.6232 1
4642.7730 .036 4643.6301 .032
4642.7732 .110 4643.6418 .123
Table 2: Absorptance of a 2.2 µm laser beam by atmospheric ozone for three different amounts of absorber thickness.
Frequency cm-1 u = 0.1 atm-cm in u = 0.5 atm-cm in u = 1 atm-cm in
QRM LBL QRM LBL QRM LBL
4642.0608 24.58 1.40 29.99 13.17 67.69 75.64
4642.1608 39.17 18.72 91.10 87.41 100.00 100.00
4642.2608 25.76 4.74 36.03 38.45 92.54 99.50
4642.3608 29.42 4.11 61.29 34.27 99.64 98.50
4642.4608 24.87 0.75 25.80 7.22 43.08 52.72
4642.5608 24.77 0.69 24.78 6.66 34.96 49.81
4642.6608 24.90 1.89 26.08 17.37 45.02 85.16
4642.7608 31.57 9.95 72.72 64.92 99.98 100.00
4642.8608 24.71 0.95 24.22 9.09 30.05 61.45
4642.9608 26.14 3.66 33.17 31.13 88.02 97.60
4643.0608 25.06 1.90 31.04 17.48 72.36 85.35
4643.1608 30.41 12.86 65.94 74.74 99.83 100.00
4643.2608 26.49 3.56 42.99 30.44 94.60 97.35
4643.3608 26.35 4.33 44.52 35.80 95.77 98.81
4643.4608 27.53 4.74 50.46 38.50 98.41 99.23
4643.5608 24.91 2.48 26.22 22.20 45.98 91.87
4643.6608 26.02 4.44 54.02 36.50 99.18 98.93
Figure 4: Transmission of a 2.2 µµµµm laser beam through 1 atm-cm thickness of ozone
5. CONCLUSION
After comparing the results of the quasi-random-model with line-by-line method and experimental results, S. N. Tiwari and N. Mirakhur recommended the use of the quasi-random model for evaluation of the atmospheric radiation15. As concluded by Goody and Yung in their monograph7, in some circumstances the random models might be sufficient, and required less computer time. From the figure it is evident that values obtained from the quasi-random model show reasonably good agreement with those generated from consideration of each line. Hence quasi-random model could be conveniently used in the case involving a large number of lines, for both accuracy and time saving. The frequency dependent absorptive power of molecule is an important topic in atmospheric optics and astrophysics and hence the application prospect of the quasi-random model in atmospheric optics is quite bright. In this work, the broadening of the lines is assumed to be homogeneous, as the rotational lines are observed to be sufficiently fine. Therefore, there is a scope to generalize the model for inhomogeneous broadening as well. Till now, a large number of high resolution absorption spectra of other diatomic and polyatomic molecules have been reported; the present work could easily be extended to these spectra. Temperature and pressure dependence of the linewidth, and consequently of the absorptance, is the aspect that calls for further research.
ACKNOWLEDGMENT
REFERENCES
1. http://en.wikipedia.org/wiki/Ozone_layer (accessed on 4th December, 2013).
2. S. Mikhailenko, A. Barbe, V I G. Tyuterev, L. Regalia & J. J. Plateaux, Line position and intensities of the
3 3 2
1 ν ν
ν + + ,
3 4
2 ν
ν + and
2 2 1
3ν + ν band of ozone,
Journal of Molecular Spectroscopy 180, 227-235, (1996).
3. V. G. Kunde, Theoretical computations of the outgoing infrared radiance from a
planetary atmosphere, NASA TN-D- 4045, 1967.
4. L. Sparks, Efficient line-by-line calculation of absorption coefficients to high numerical accuracy, Journal of Quantitative Spectroscopy & Radiative Transfer, 57, 631–650, (1997).
5. S. N. Tiwari & S. K. Gupta, Accurate spectral modeling for infrared radiation, NASA CR-152948, (1977).
6. B. A. Fomin, Effective interpolation technique for line- by-line calculations of radiation absorption in gases, Journal of Quantitative Spectroscopy & Radiative Transfer, 53, 663–669, (1995).
7. R. M. Goody, Atmospheric radiation: theoretical basis (Ox- ford University Press, New York), (2002).
8. V. R. Stull, P. J. Wyatt & G. N. Plass, The infrared transmittance of water vapor, Applied
Optics, 3, 229–241, (1964).
9. V. R. Stull, P. J. Wyatt & G. N. Plass, The infrared transmittance of carbon dioxide,
Applied Optics, 3, 243–254, (1964).
10. V. R. Stull, P. J. Wyatt, G N Plass, Quasi-random model of band absorption, Journal of
Optical Society of America, 52, 1209, (1962).
11. A. Gohain Barua, S. S. Jois & S. Bhuyan, Interaction of a laser beam with the rotational lines of nitrogen in the wavelength region of 5700 Å, Applied Optics, 46, 5738-5741, (2007).
12. A. Gohain Barua, A. K. Bora & S. S. Jois, Propagation of a 575-nm dye laser beam through nitrogen, Journal of Atmospheric & Solar Terrestrial Physics, 68, 1330–1333, (2006).
13. A. Gohain Barua & S. Bhuyan, Interaction of 4 µm laser beam with absorption lines of sulphur dioxide, Indian Journal of Pure & Applied Physics, 46, 617–620, (2008).
14. A. Gohain Barua & P. Goswami, Interaction of a tunable laser beam with high resolution lines of methane in 9190-9199 cm-1, Journal of Optics, 42, 37-41, (2013).
15. S. N. Tiwari & N. Mirakhur, Feasibility of quasi-random band model in evaluating