Comparative Analysis of Rock Mass Rating Prediction
Using Different Inductive Modeling Techniques
Sajjad Hussain1,*, Noor Mohammad1, Mujahid Khan2, Zahid Ur Rehman1, Mohammad Tahir1
1Department of Mining Engineering, University of Engineering and Technology, Peshawar, Pakistan 2Department of Civil Engineering, University of Engineering and Technology, Peshawar, Pakistan
Abstract
The rock mass rating (RMR) classification system is the integral part in the engineering design and accomplishment of underground structures especially tunnels and caverns within the rock mass. Therefore, it is very necessary to evaluate/predict the quality of rock mass and in turn the RMR value with more precision. This paper presents the estimation of RMR value using three different techniques including conventional method, Multiple Linear Regression (MLR) and Artificial Neural Networks (ANN) using the real time geological and technical data obtained along the tunnel axis at Golen Gol Hydropower Project Chitral, Pakistan. The RMR values were estimated using ANN-based and MLR models, the results were compared and analyzed. On the basis of comparison, it was observed that ANN-based models results in more realistic values of average RMR than other models for all three bore holes. In comparison with ANN-based models, the MLR model overestimates the RMR value which is not appropriate according to stability point of view. The improved RMR value predicted using ANN-based models can be used for the recommendation of the reliable support system for tunnel.Keywords
Rock Mass Rating (RMR), Multiple Linear Regression (MLR), Artificial Neural Network (ANN)1. Introduction
The Rock mass classification systems are also known as empirical methods for rock mass classification and considered as an integral part of the designing of underground structure, support systems, stability analysis and in determination of input parameters for numerical modeling within the rock mass environment. The empirical methods classify the rock masses into different categories having less or more similar geological and geotechnical properties on the basis of results obtained from rock mass characterization. Numerous numbers of rock mass classification systems developed based on experiences and case histories related to the field of civil and mining engineering by different researchers [1-4]. The rock mass classification systems are considered very beneficial to use during the initial stages of the project when limited information about rock mass behavior, stresses and hydrological characteristics are available [5, 6].
Many rock mass classification systems are developed by different researchers. Among that rock mass classification systems the RMR classification system is more famous and used widely nowadays in designing of tunnels, mines support systems, and stability analysis. Hoek E and Brown
* Corresponding author:
[email protected] (Sajjad Hussain) Published online at http://journal.sapub.org/mining
Copyright © 2016 Scientific & Academic Publishing. All Rights Reserved
ET, (1997) [7]suggested that rock mass classification is the nonlinear process. The rating of rock mass by using RMR is quite complicated due to nonlinear relations between the parameters of RMR and anisotropic nature of rock mass. The artificial intelligence such as ANN-based models and the Multiple Linear Regression used to deal with such nonlinear relations problems of engineering and it can also be used to confirm and improve the design solutions in any engineering projects [8, 9]. According to the Biniawski (1989) suggested support table for underground structure within the rock mass environment is entirely based on the predicted RMR value, therefore, due to stability point of view it is necessary to calculate the RMR value correctly as possible.
In this research, the RMR classification system was applied on the borehole data obtained along the tunnel at Golen Gol Hydropower Project and strength properties of representative rock samples, determined in the laboratory. Further the MLR andANN-based models techniques were applied on the rating of RMR parameters for the prediction of RMR value. The results obtained from MLR and ANNs are compared and analyzed to obtain optimum values of RMR that can be used for recommendation of reliable support system for the tunnel.
2. Geology
on river Golen Gol Chitral, Pakistan. The major components of water conveying system of the scheme are comprised of a 3800 meter long headrace tunnel with internal diameter of 3.7 meter as well as 400 meter high pressure shaft with 2.5 meter internal diameter followed by 570 meter long pressure tunnel having 2.5 meter internal diameter. Three bore holes i.e. GGT-3, GGT-4 and GGPH-7 were drilled at suitable locations along the tunnel in order to know about the subsurface geology. The surface geology and subsurface geology are same and extend with the same dip angle as on surface. The rock units recorded at surface and subsurface are the same, and due to presence of Ayun Fault in the area, several numbers of discontinuities are noticed.
The greater part of headrace tunnel (2775m approximately) will be passing through Granite of igneous nature and the remaining (825m and 200m) will be passing through metamorphosed rock types which are Quartz Mica Schist, Marble and Calcareous Quartzite, respectively. The major part of pressure tunnel and vertical shaft and will be in Marble rock, however the minimum length of pressure tunnel will continue into calcareous quartzite rock type as shown in Figure 1.
3. Rock Mass Rating (RMR)
Classification System
This rock mass classification system was developed by Biniawski, (1976), and also called geo-mechanics classification system. It was developed based on the different case histories in the field of civil and mining engineering. This classification system was modified in 1974, 1976, 1979 and 1989, due to considering of more case studies related to tunnels, mines, chambers, slopes, foundations and hydropower projects. The RMR system has wide applications especially in the field of civil and mining engineering. In the present research the recent version of
RMR was used to obtain of RMR values.
This system used the following six parameters for the classification of rock masses:
i. Uniaxial compressive strength ii. Rock quality designation (RQD) iii. Spacing of discontinuities iv. Condition of discontinuities v. Ground water condition vi. Orientation of discontinuities
The RMR system classifies the rock masses on the basis of quality into different structure regions and each region is separately classified. The behavior and geological features of rock masses in each classified region is more uniform.
The rating of five parameters as mentioned above in sequential order when added it gives the basic RMR value it is the first step for calculation of RMR. The second step is to incorporate the last parameter i.e. Orientation of discontinuities by adjusting of basic RMR which is very difficult job. This parameter depend on the types of the applications such as mines, tunnels, foundations and slopes, therefore it should be treated at last in RMR calculation. This parameter gives qualitative information rather than quantitative such as very favorable to very unfavorable based on this information it can be decided that whether the strike and dip orientation is favorable or not in case of tunnel, based on the effect of joint orientation a value selected from the range 0 to -12 for tunnels and mines, 0 to -25 for foundations and 0 to -50 for slopes. This value adjusted with the basic RMR to give the RMR value. The maximum values of RMR indicate good quality of rock.
After calculation of RMR value by using six parameters, the RMR values grouped into five rock mass categories, each category are in groups of each twenty ratings, the cohesion and angle of internal friction suggested for each category based on RMR as shown in Table 1.
Table 1. Rock Mass Classification [1]
Classification Parameters and their Ratings
S.No Parameters Rang of values/Rating
1
Strength of intact rock material
Point load
strength index >10MPa 4-10MPa 1-2MPa For this low range-uniaxial compressive test is preferred Uniaxial
compressive
strength >250MPa 100-250MPa 50-100MPa 25-50MPa
5-25 MPa MPa 1-5
<1 MPa
Rating 15 12 7 4 2 1 0
2 RQD 90-100% 75-90% 50-75% 25-50% <25%
Rating 20 17 13 8 3
3 Spacing of Discontinuities >2m 0.6-2m 200-600mm 60-200mm <60mm
Rating 20 15 10 8 5
4
Condition of Discontinuities Very rough surface Not continuous No separation Unweathered wall rock
Slightly rough Separation <1mm Slightly weathered walls
Slightly rough Separation <1mm Highly weathered walls
Slikensided surfaces Or gouge<5mm thick
Or separation 1-5 mm
Continuous
Soft gouge > 5mm thick Or separation >5mm Continuous
Rating 30 25 20 10 0
5 Ground water
Inflow/10m tunnel length
(l/m) None <10 10-25 25-125 >125
(joint water press)/(major
principle stress) 0 <0.1 0.1-0.2 0.2-0.5 >0.5
General
condition Completely dry Damp Wet Dripping Flowing
Rating 15 10 7 4 0
6 Discontinuity orientation
Strike and dip orientation Very favorable Favorable Fair Unfavorable Very Unfavorable
Rating
Tunnel &mines 0 -2 -5 -10 -12
Foundation s 0 -2 -7 -15 -25
Slopes 0 -5 -25 -5-
Rock mass classification determined from total rating
Rating 100-81 80-61 60-41 40-21 <21
Class number I II III IV V
Description Very good rock Good rock Fair rock Poor rock Very poor rock
Meaning of rock classes
Class number I II III IV V
Average stand-up time of rock
mass 20 yrs for 15 m span 1 year for 10 m span 1 week for 5m span 10hrs for 2.5 m span 30 min for 1m span
Cohesion (kPa) of rock mass >400 300-400 200-300 100-200 <100
4. Inductive Models for RMR Prediction
Using Field Data
This paper presents comparative analysis of two different inductive models for RMR prediction through range of modeling techniques using field data collected along the axis of tunnel at Golen Gol Hydropower Project. These models include 1) Regression, and 2) ANN-based models. Both the models will be trained and tested using the same field data. This study investigates the utility of ANN-based models and its comparison with other traditional models. The input variables used in both modeling techniques are descriptively given in Table 2.
4.1. Multiple Linear Regression (MLR)-based Data-driven Models
The field data collected from along the axis of tunnel was used in this study for the development of both types of models i.e. (MLR, and ANN). Out of the total 146 data sets, 109 (75%) were used for training of both the models while the remaining 37, (25%) data points were used for model validation or testing. There were ten inputs variables as described in Table 2 and RMR as output variable. This data split and input/output configuration applies to both models developed in this study.
Table 2. Descriptions of input parameters
S.No Input parameter Symbol
1 Rock quality designation RQD
2 Uniaxial compressive strength UCS
3 Joint Spacing JS
4 Joint condition - Persistence JCP
5 Joint condition - Aperture JCA
6 Joint condition - Roughhouse JCR
7 Joint condition - Infilling JCI
8 Joint condition - Weathering JCW
9 Ground water condition GWC
10 Discontinuities orientation DO
The MLR model was trained using the collected data set and the following optimal equation is obtained for the prediction of RMR.
(1)
The results of the MLR model as given by Equation (1) above in model training and validation are discussed later in this paper.
Regression models are commonly used traditional models however; sometime they are not capable to handle and model complex phenomena. In order to handle more complex structures and phenomena, models based on ANN have prospects to be used as they are proficient for multivariate structures.
4.2. Artificial Neural Network Model (ANN)
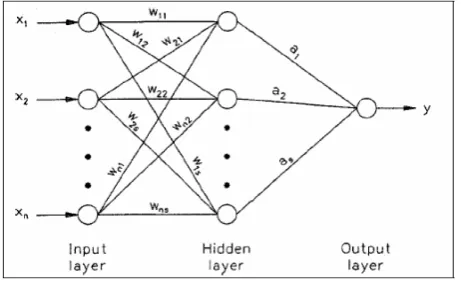
Artificial Neural Network (ANN) is a digital mathematical model of the human brain consisting of highly interconnected network of neurons. It consists of an input layer of neurons, hidden layers, and an output layer. The weights of these connecting elements and its arrangements are adjusted through a process of “training” for model calibration [11, 12]. Concepts involved behind these training schemes can also be found in ASCE Task Committee (2000b) [13].
ANN models are often referred to as “black box models” as they cannot develop empirical equation for the process, but rather produce outputs according to the given inputs. These models require a lot of data and thus resulting in long expressions for the process being modeled. In mining engineering, ANNs have been successfully used in modeling of many problems such as modeling for the prediction of RMR rock mass classification [7, 12, 14]. Different researchers also used the inductive modeling techniques for estimation of rock mass deformation modulus Zhi Qiang Zhang et al., 2009; Raoof Gholami et al., 2013; Hima NikafshanRad et al., 2015 [15-17], and many more researchers used ANNs technique for improving the rating of RMR classification system.
In this study Neuro sort software developed by Lingireddy et al. (2003) [18] is used for development of ANN models. Simple feed forward back propagation type network is used. For model training, learning rate of 0.1 and momentum factor of 0.4 is used. The simple architecture of a generalized feed forward back propagation neural network reported by Jeng et al. (2006) is shown in Figure 2.
Figure 2. Architecture of Artificial Neural Network model [19].
In all cases, the optimal outputs were achieved using ten neurons in the hidden layer showing no improvement with changing neurons. Sigmoidal activation function was used for modeling the transformation of values across the layers.
The statistical measures such as Root Mean Square error (RMSE), Average Absolute error (AAE) and coefficient of determination (R2) were evaluated as the measure of
n
e
MAE
n
i i
∑
=
=
1 , (2)n
e
RMSE
n
i i
∑
=
2
, (3)
Where,
eiis the difference between the observed and predicted
scour and n is the number of data points used. The results of the ANN model for training and validation data sets are discussed in results and discussions section of this paper.
5. Results and Discussions
The value for RMR classification system was predicted by different methods as discussed in earlier using the bore holes data (along the tunnel axis) and the strength properties of rock mass determined in the laboratory on the samples collected along the tunnel axis. The three methods include the conventional methods for RMR calculations and the two inductive modeling techniques including MLR and ANN. the objective is to check the prediction capability of both the inductive models and compare its results with the one obtained from the conventional method. The results obtained from all the three methods are shown in Table 3.
Table 3 shows that the average values of RMR and their respective rock mass classes predicted for all three bore holes by MLR model are greater than the conventional values while ANN-based models predicted lower values, particularly for bore hole GGT-4 shows in Table 3, that the value of RMR is overestimated by MRL model which encountered that the rock class is good, while from the results of conventional and ANN- based models the rock encountered fair rock. According to the stability point of view and design of support system, the lower value of RMR is better and safe option to use for the recommendation of support system, therefore ANN-based models prediction is better than MLR-based model.
To evaluate and compare the performance of the two
inductive modeling techniques, further statistical analysis was carried out. For this purpose, the performance measure such as coefficient of determination R2 and error measures
such as Root mean square error (RMSE) and Average absolute error were calculated using training and testing data sets for both the models. The results obtained are as shown in Table 4.
Table 4 reveals that the values of R2 in case of ANN-based
models both for training and testing data sets are greater as compared to the same values of regression-based models indicating superior performance of the earlier. Similarly, it can also be seen above that the RMSE and AAE values for ANN-based models are very much lower than the MLR-based model values, thus further highlighting the superior performance of the ANN-Based modelling techniques in RMR prediction.
For further evaluation of the performance of two models, scattered plots are drawn for both types of models using training as well as testing data sets. These plots are shown below.
5.1. Scattered Plots for MLR-Based Models
The scattered plots drawn for MLR-based model are shown in Figure 3.
5.2. Scattered Plots for ANN-Based Models
The scattered plots drawn ANN-based models are shown in Figure 4.
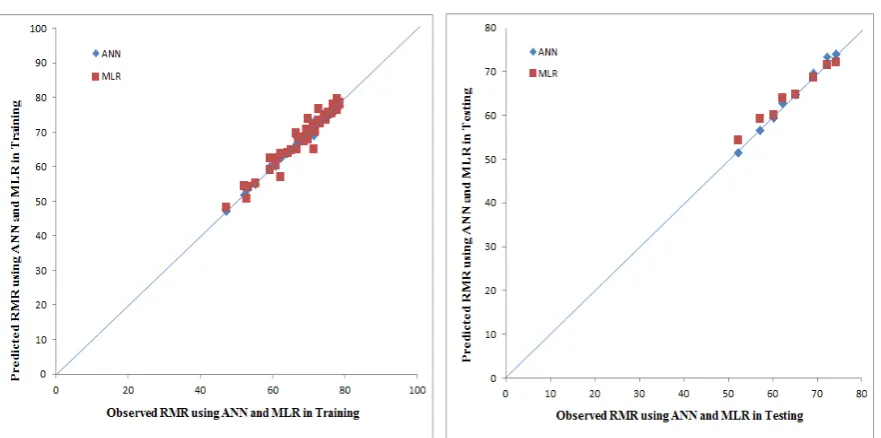
5.3. Scattered Plots for Comparison of MLR AND ANN-Based Models
The scattered plots drawn to compare the performance of ANN and MLR are shown in Figure 5.
Figure-5 reveals that in training data set, for both the models, the data points are almost uniformly distributed around the 45 degree line so it is difficult to judge the difference from this plot. But for testing data set, the ANN-based resulted in more close and uniform distribution of data points as compared to the MLR-based models. Although, the difference is very small but even then it can be seen that ANN-based models performance is slightly better.
Table 3. Comparison of Results obtained for RMR predicted using three different methods
S. No Chainage prediction RMR Bore holes/Rock mass classes
GGT-3 Rock class GGT-4 Rock class GGPH-7 Rock class
1 0+00-2+762 Conventional 71.71 Good rock 59.83 Fair rock 72.05 Good rock
2 2+762-3+624 MLR 73.32 Good rock 61.44 Good rock 75.32 Good rock
3 3+624-3+800 ANN 65.43 Good rock 52.94 Fair rock 63.21 Good rock
Table 4. Results Comparison for RMR predicted using MLR and ANN-based models
Model Training Testing
AAE RMSE R2 AAE RMSE R2
ANN 0.4528 0.6124 0.99 0.6096 0.6498 0.99
Figure 3. Scattered plots for observed and Predicted RMR using MLR-Based Model
Figure 4. Scattered plots for observed and Predicted RMR using ANN-Based Model
6. Conclusions
Accurate prediction of RMR is very essential for accurate design of support system. This paper investigates the use of MLR and ANN-based inductive model for RMR prediction utilizing field data collected from along the tunnel axis at Golen Gole Hydropower project Chitral. At the same time, the performance of ANN-based models is compared with MLR-based model. In particular, the use of ANN-based modelling techniques can bring revolution in this field of engineering. ANN-based modelling technique was applied for the RMR prediction and its performance was compared with the MLR-based models and the conventional procedure. Upon comparing the results in Table 4, obtained from both modelling inductive modelling techniques, it is concluded that, the performance of ANN-based models is superior to MLR-based models not only in term of performance measure (R2), but also in term of error measures such as Average
Absolute Error (AEE) and Root Mean Square Error (RMSE). The same better performance of ANN-based models as compared to MLR-based models can be seen in the scattered plots too. Since AI-based models are not readily available to the common engineer, their use in most cases is restricted for academic and research purposes. This paper intends to highlight the utility of AI-based models with a view to increase their usage by engineers and planners working on problems related to RMR prediction.
So overall, it is concluded that ANN-based models results in much better prediction of RMR as compared to MLR-based models and is recommended for use in the future RMR prediction and design of support system.
REFERENCES
[1] Bieniawski, Z.T. (1989): Engineering Rock Mass Classifications. USA: John Wiley and Sons, 67 p.
[2] Evrim Sopac, and Haluk Akgun (2008): Engineering geologi cal investigations and the preliminary support design for the proposed Ordu Peripheral Highway Tunnel, Ordu, Turkey. Engineering Geology, 96: 43-61.
[3] Karahan and Ercument (2010): Design of Excavation and Support System for the Cubukbili Tunnel in Antalya. M.Sc thesis, the graduate school of natural and applied sciences of Middle East Technical University, 94-98.
[4] Ali, E.W. (2014): rock mass charecterization for diversion tunnel at diamer basha dam, pakistan-a design perspective. M.Sc thesis, University of Engineering and Technology, Peshawar, Pakistan, 45-68.
[5] Hoek, E., Kaiser, P.K., and Bawden, W.F. (1993): Support of Underground Excavations in Hard Rock, 47-50.
[6] Genis, M., Basarir, H., Ozarslan, A., Bilir, E., and Balaban, E. (2007): Engineering geological appraisal of the rock masses and preliminary support design, Dorukhan Tunnel, Zonguldak, Turkey. Engineering Geology, 92: 14–26.
[7] Hoek, E., and Brown, E.T. (1997): Practical estimation of rock mass strenght. International Journal of Rock Mechanics and Mining Science, 34: 1165–1186.
[8] Ertan Mert, Serhat Yilmaz and Malih (2011): An assessment of total RMR classification system using unified simulation model based on artificial neural networks. Neural Computing and Applications, 20: 603–610.
[9] Miranda, Gomes, T.A., Correia and Nogueira (2015):
academia.edu. (P. Cortez, Producer) Retrieved march
monday, From http://www.academia.edu/3114361/ Alternative models for the calculation of the RMR and Q indexes for granite rock masses.
[10] WAPDA (2007): Geology and Geotechnics of Golen gol hydropower project . Lahore: WAPDA, 40-47.
[11] Zurada, J.M. (1992): Introduction to artificial neural systems. Boston, PWS Publishing Company, 764-770.
[12] Rahmannejad, Hamid Mohammadi and Reza (2010): The estimation of rock mass deformation modulus using regression and artificial neural networks analysis. The Arabian Journal for Science and Engineering, 35-38. [13] Changkuan Zhang, and Hangwu Tang (2010): Artificial
neural networks in hydrology- Hydrologic applications. Springer, New York, 124-13.
[14] Jalalifar, H., Mojedifar, S., Sahebi, A.A., and Nezamabadi-pour, H. (2011): Application of the adaptive neuro-fuzzy inference system for prediction rock engineering classification system. Computers and Geotechnics, 38: 783–790.
[15] Zhi Qiang Zhang, Qing Ming Wu, Qiang Zhang and Zhi Chao Gong (2009): Estimation of Rock Mass Rating System with an Artificial Neural Network. In H. H. Wen Yu (Ed.), Advances in Neural Networks, Wuhan, China: Springer Berlin Heidelberg , 963–972.
[16] Raoof Gholami, Vemegh Rasouli and Andisheh Alimoradi (2013): Improved RMR Rock Mass Classification Using Artificial Neural Intelligence Algorithms. Rock Mechanics and Rock Engineering, 46: 1199–1209.
[17] Hima Nikafshan Rad, Zakria Jalali and Hosain Jalalifar (2015): Prediction of rock mass rating system based on continuous using Chaos–ANFIS model. International Journa lof Rock Mechanics & Mining Sciences, 73: 1–9.
[18] Lingireddy, Brion, S., Chandaramouli and Neelakanatan (2003): Neural Network Modeling Software for Water and Environmental Engineering. Lexington, Kentucky: Civil Engineering Department, University of Kentucky.
[19] Jeng, D.S., Betani, S.M., and Lockett, E. (2006): Neural Network, Assessment for Scour Depth Around Bridge Piers. Australia, Research report No. R855, Department of Civil Engineering, University of Sydney, 89 -92.
[20] Mohammed Noor, Ghazali and Huat (2005): Validation of some bridge pier scour formulae using field and laboratory data. American Journal of Environmental Science, 1: 119–125.
![Figure 1. The location of three bore holes and geology along the tunnel axis [10]](https://thumb-us.123doks.com/thumbv2/123dok_us/8709017.1740526/2.595.68.542.531.705/figure-location-bore-holes-geology-tunnel-axis.webp)