ISSN : 2581-7175 ©IJSRED: All Rights are Reserved Page 536
A Novel Approach to Detect and Classify Leaf Diseases
Based on Image Processing
M. SahayaMerlin
1, C.S. Sree Thayanandeswari
21
PGScholar, ECE Department,PET Engineering College, Anna University 2
Assistant Professor, ECE Department, PET Engineering College, Anna University
---************************---
Abstract:
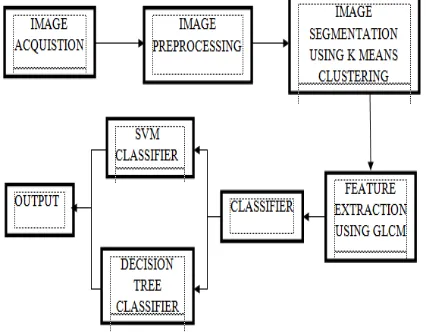
Plant diseases cause major production and economic losses in agricultural. Identification of the plant diseases is the key to prevent the losses in the yield and quantity of the agricultural product. Image processing techniques are used to detect the plant leaf diseases. The objective of this work is to implement image analysis & classification techniques for detection of leaf diseases and classification. The proposed framework consists of four parts. They are (1) Image preprocessing (2) Segmentation of the leaf using K-means clustering to determine the diseased areas (3) feature extraction & (4) Classification of diseases. Texture features are extracted using statistical Gray-Level Co-Occurrence Matrix (GLCM) features and classification is done using Support Vector Machine (SVM) and Decision Tree Classifier.
Index Terms — leaf diseases, classification, SVM , Decision tree, K-Means Segmentation.
---
************************
---I.INTRODUCTION
In India, agriculture is the backbone of economy. 50% of the population is involved in farming activities directly or indirectly. Many varieties of fruits, cereals and vegetables are produced here and exported to other countries.
Hence it is necessary to produce high quality products with an optimum yield. As diseases of the plants are unavoidable, detection of plant diseases is essential in the field of Agriculture.
In plants, diseases can be found in various parts such as fruits, stems and leaves. The main diseases of plants are viral, fungus and bacterial disease like Alternaria, Anthracnose, bacterial spot, canker, etc.,. The viral disease is due to environmental changes, fungus disease is due to the presence of fungus in the leaf and bacterial disease is due to presence of germs in leaf or plants. The proposed framework can be used to identify leaf diseases.
Automatic detection of plant diseases is an important research topic since it is able to automatically detect the diseases from the symptoms that appear on the plant leaves. Barbedo proposed an automatic method of disease symptoms segmentation in digital photographs of plant leaves, in which color channel manipulation & Boolean operation are applied on binary mask of leaf pixels [1]. He
proposed the method of semi-automatic
segmentation of plant leaf disease symptoms in which the histograms of the H and color channels are manipulated [2, 3].
Pang et al proposed the method of automatic segmentation of crop leaf spot disease images by integrating local threshold and seeded region growing [4]. Singh and Misra proposed detection of plant leaf diseases using soft computing techniques [5].
Prasad et al proposed unsupervised resolution independent based natural plant leaf disease segmentation approach in which texture
ISSN : 2581-7175 ©IJSRED: All Rights are Reserved Page 537
based clustering for segmentation is done [6]. Du & Zhang proposed a technique to segment leaf image with non-uniform illumination based on maximum entropy and genetic algorithm (GA) [7].
Dhaygude&Kumbhar proposed
agricultural plant leaf disease detection using image processing in which the texture statistics
are computed from spatial gray-level
dependence matrices (SGDM) [8]. Diao et al reviewed the different methods including edge based, region based, Artificial Neural Network (ANN) etc., for segmentation of plant disease spot [9]. Different methods for automatic leaf image segmentation and disease identification have been proposed in literature [10-14].
In this paper, segmentation of leaves is done using K Means algorithm. Texture features
are extracted using GLCM and then
classification is done using SVM and Decision tree classifier.
II.PPROPOSED METHOD
The overview of the proposed methodology is shown in Figure 1.
Figure 1 – Overview of the proposed Method
A. Image Acquisition
Firstly, the images of various leaves are acquired using a digital camera with required resolution for better quality. The input image is then resized to 256x256 pixels. The construction of an image database depends on the required application. The image database has to be carefully constructed in that it generally decides the efficiency of the classifier and performance of the proposed method.
B. Image Pre-Processing
Image pre-processing is used to enhance the quality of the image necessary for further processing and analysis. It includes color space conversion and image enhancement. The RGB images of leaves are converted into L*a*b* color space. The color transformation is done to determine the luminosity and chromaticity layers. The color space conversion is used for
the enhancement of visual analysis.
C. Image Segmentation
Image segmentation is the process used to simplify the representation of an image into meaningful form, such as to highlight object of interest from background. The K-means clustering algorithm performs segmentation by minimizing the sum of squares of distances between the image intensities and the cluster centroids. K-means clustering algorithm, or Lloyd's algorithm, is an iterative algorithm that partitions the data and assigns n observations to precisely one of k clusters defined by centroids. The steps in the algorithm are given below.
1. Choose k initial cluster centers (centroid).
2. Compute point-to-cluster-centroid distances of all observations to each centroid.
ISSN : 2581-7175 ©IJSRED: All Rights are Reserved Page 538
4. Compute the mean of the observations in each cluster to obtain k new centroid locations.
5. Repeat steps 2 through 4 until there is no change in the cluster assignments or the maximum number of iterations is reached.
D. Feature Extraction
After segmentation, the GLCM features are extracted from the image. Gray-Level Co-Occurrence Matrix (GLCM) is the statistical method of investigating texture which considers the spatial relationship of pixels [15].
The GLCM functions characterize the texture of images by computing the spatial relationship among the pixels in the images. The statistical measures are extracted from this matrix. In the creation of GLCMs, an array of offsets which describe pixel relationships of varying direction and distance have to be specified. In the proposed method, four features are extracted which include contrast, energy, homogeneity and correlation. Let Pij represents the (i,j)th entry in the normalized Gray-Level CoOccurrence Matrix. N represents the number of distinct gray levels in the quantized image. The different features extracted are defined as follows.
a) Contrast
Contrast measures intensity contrast of a pixel and its neighbor pixel over the entire image. If the image is constant, contrast is equal to 0. The equation of the contrast is as follows.
Contrast = ∑, ( )( − ) (1)
a) Energy
Energy is a measure of uniformity with squared elements summation in the GLCM. Range is in between 0 and 1. Energy is 1 for a
constant image. The equation of the energy is given by equation (2)
Energy = ∑, ( ) (2)
b) Homogeneity
Homogeneity measures the similarity among the pixels. Its range is between 0 and 1. Homogeneity is 1 for a diagonal GLCM. The equation of the Homogeneity is as follows.
= ∑ ( )
[ ( ) ]
, (3)
c) Correlation
Correlation measures how correlated a pixel is to its neighborhood. Its range is in between -1 and 1.
Correlation = ∑ ( )( )
!
, (4)
µ is mean value of all pixels in the relationships that contributed to the GLCM and σ represents the variance.
E. Classification using Support Vector Machine (SVM)
ISSN : 2581-7175 ©IJSRED: All Rights are Reserved Page 539
Support Vector Machine is kernel-based supervised learning algorithm used as a classification tool. The training algorithm of SVM maximizes the margin between the training data and class boundary. The resulting decision function depends only on the training data called support vectors, which are closest to the decision boundary as shown in Figure 2. It is effective in high dimensional space where number of dimensions is greater than the number of training data. SVM transforms data from input space into a high-dimensional feature space using kernel function. Nonlinear data can also be separated using hyper plane in high
dimensional space. The computational
complexity is reduced by kernel Hilbert space
The idea of support vector machine is to create a hyper plane in between data sets to indicate which class it belongs to. The feature vector is given as input to the classifier. The feature vectors of the database images are divided into training and testing vectors. The classifier trains on the training set and applies it to classify the testing set. The performance of the classifier is measured by comparing the predicted labels and actual values.
F. Classification using decision tree
Decision tree algorithm falls under the category of the supervised learning. They can be used to solve both regression and classification problems. Decision tree uses the tree representation to solve the problem in which each leaf node corresponds to a class label and attributes are represented on the internal node of the tree. We can represent anyBoolean function on discrete attributes using the decision tree. At the beginning, we consider the whole training set as the root. Feature values are preferred to be
categorical then they are discretized prior to building the model. On the basis of attributes values records are distributed recursively. We use statistical methods for ordering attributes as root or the internal node.
Decision tree is a simple data mining approach used to establish the hidden knowledge in the data to enable classification and prediction. Decision tree is a tree structure, where internal nodes denote a test on an attribute, each branch represents the outcomes of the test and the leaf node represents the class labels. Decision tree induction is the learning process of decision trees from class-labeled training tuples.
Construction of decision tree is simple and fast, and does not need any domain
knowledge and hence appropriate for
exploratory knowledge discovery. Decision trees are used for classification and the classification rules can be easily generated from them. An unknown tuple X can be classified, given its attribute values by traversing the decision tree.
They have the advantage of easy interpretation and decision makers can easily understand and compare with their domain knowledge for validation and justification of their decisions. In general, decision tree classifiers have good accuracy, but successful use of it depends on the data at hand. The Decision tree algorithm steps,
Step1: Place the best attribute of the dataset at the root of the tree.
ISSN : 2581-7175 ©IJSRED: All Rights are Reserved Page 540
Step3: Repeat step 1 and step 2 on each subset until you find leaf nodes in all the branches of the tree.
III RESULT AND DISCUSSION
Fig 3: Output Image (Using SVM)
Fig 4: Output Image (Using Decision Tree)
The plant leaf diseases were detected using various algorithms such that segmentation by K means clustering algorithm, feature extractionusing GLCM and then classified the plant leaf diseases using SVM algorithm. Thus it is identified that leaf was detected by Blackspot. Thus the image features will be enhanced in the proposed methodology.
IV CONCLUSION AND FUTURE WORK
A method for detection and
classification of leaf diseases is implemented. The segmentation of the diseased part is done using K-Means segmentation. Then, GLCM texture features are extracted and classification is done using SVM. The method is tested for detection of diseases in citrus leaves. Future work is to be carried out for classification of diseases in different plant species and to improve the classification accuracy.
REFERENCES
[1] S. J. G. A. Barbedo, “A new automatic method for disease symptom segmentation in digital photographs of plant leaves,” European Journal of Plant Pathology, vol. 147, no. 2, pp. 349–364, 2016.
[2] J. G. A. Barbedo, “A novel algorithm for semi-automatic segmentation of plant leaf
disease symptoms using digital image
processing,” Tropical Plant Pathology, vol. 41, no. 4, pp. 210– 224, 2016.
[3] J. G. A. Barbedo, L. V. Koenigkan, and T. T. Santos, “Identifying multiple plant diseases using digital image processing,” Biosystems Engineering, vol. 147, pp. 104–116, 2016.
[4] J. Pang, Z.-Y.Bai, J.-C.Lai, and S.-K. Li, “Automatic segmentation of crop leaf spot disease images by integrating local threshold and seeded region growing,” 2011 International Conference on Image Analysis and Signal Processing, 2011.
[5] V. Singh and A. Misra,“Detection of plant leaf diseases using image segmentation and soft computing techniques,” Information Processing in Agriculture, 2016.
ISSN : 2581-7175 ©IJSRED: All Rights are Reserved Page 541
for mobile devices,” Proceedings of the 5th IBM Collaborative Academia Research Exchange Workshop on - I-CARE '13, 2013.
[7] M. G. Du and S. W. Zhang, “Crop Disease Leaf Image Segmentation Based on Genetic Algorithm and Maximum Entropy,” Applied Mechanics and Materials, vol. 713-715, pp. 1670–1674, 2015.
[8] B. Dhaygude&P.Kumbhar, “Agricultural plant Leaf Disease Detection Using Image Processing”, International Journal of Advanced Research in Electrical, Electronics and Instrumentation Engineering, vol. 2, no. 1, 2013, pp. 599-602.
[9] Z. H. Diao, Y. M. Song, H. Wang, and Y. P. Wang, “Study Surveys on Image Segmentation of Plant Disease Spot,” Advanced Materials Research, vol. 542-543, pp. 1047– 1050, 2012.
[10] J. Y. Bai and H. E. Ren,“An Algorithm of Leaf Image Segmentation Based on Color Features,” Key Engineering Materials, vol. 474-476, pp. 846–851, 2011.
[11] J. Y. Bai and H. E. Ren,“An Algorithm of Leaf Image Segmentation Based on Color Features,” Key Engineering Materials, vol. 474-476, pp. 846–851, 2011.
[12] N. Valliammal and S. S.n.geethalakshmi, “A Novel Approach for Plant Leaf Image
Segmentation using Fuzzy Clustering,”
International Journal of Computer Applications, vol. 44, no. 13, pp. 10–20, 2012.
[13] L. Kaiyan, W. Junhui, C. Jie, and S. Huiping,“A Real Time Image Segmentation
Approach for Crop Leaf,” 2013 Fifth
International Conference on Measuring
Technology and Mechatronics Automation, 2013.
[14] K. R. Gavhale, U. Gawande, and K. O. Hajari, “Unhealthy region of citrus leaf detection
using image processing techniques,”
International Conference for Convergence for Technology-2014, 2014.
[15] R. M. Haralick, K. Shanmugam, and I. Dinstein, “Textural Features for Image Classification,” IEEE Transactions on Systems, Man, and Cybernetics, vol. SMC-3, no. 6, pp. 610–621, 1973
[16] S.A. Ali, N. Sulaiman,” K-Means Clustering to Improve the Accuracy of Decision Tree Response Classification” International Conference for Convergence for Technology-2009
[17] Braik, M. BaniAhmad S, “A framework for detection and classification of plant leaf and stem diseases”IEEE transactions on image processing, 2015.
[18] Lizhen Lu LipingDi ,”A Decision-Tree Classifier for Extracting Transparent Plastic-Mulched Landcover from Landsat-5 TM Images”,2014..
[19] T. Rumpfa ,A.-K. Mahleinb “Early detection and classification of plant diseases with Support Vector Machines based on
hyperspectral reflectance,Computers and
Electronics in Agriculture” 2010.