Published online April 2 2013 (http://www.sciencepublishinggroup.com/j/ajrs) doi: 10.11648/j.ajrs.20130102.11
Improving satellite image segmentation using
evolutionary computation
Mohamad M. Awad
National Council for Scientific Research, Beirut, Lebanon
Email address:
[email protected] (M. M. Awad)
To cite this article:
Mohamad M. Awad. Improving Satellite Image Segmentation Using Evolutionary Computation, American Journal of Remote Sensing. Vol. 1, No. 2, 2013, pp. 13-20. doi: 10.11648/j.ajrs.20130102.11
Abstract:
Segmentation is the process of dividing an imageinto disjoint regions. It is the most important task in image processing where the success of the object recognition depends strongly on the efficiency of the segmentation process. The most popular and important segmentation methods are clustering such asFuzzy c-Means (FCM), Iterative Self-Organizing Data (ISODATA) and K-means. Clustering methods depends strongly on the selection of the initial spectral signatures which represents initial cluster centers. Normally, this is done either manually or randomly based on statisticaloperations.In either case the outcome is unpredictable and sometime inaccurate. In this paper an unsupervised method based on Multi-Objective Genetic Algorithm (MO-GA) for the selection of spectral signature from satellite images is implemented. The new method worksby maximizing the number of the selected pixels and bymaximizinghomogeneitythrough the minimizing of the dif-ference between the pixels and their spectral signature. The objective is to create best cluster centers as an initial population for any segmentation technique. Experimental results are conducted usinghigh resolution SPOT V satellite imageandthe verification of the segmentation results is basedon a very high resolution satellite image of type Quickbird. The spectral signatures provided to K-means and Fuzzy c-meansby MO-GA process increased the speed of theclustering algorithmto approximately4 timesthe speed of the random based selection of signatures.At the same time MO-GA improved the accuracy of the results of clustering algorithmstomore than 10% compared to the random statistical cluster centers selection methods.Keywords:
Optimization, Multi-ObjectiveGenetic Algorithm, Spectral Signature, Clustering, Segmentation, Satellite Image, Software Development1. Introduction
Image segmentation is the process of division of the im-age into regions with similar attributes [1]. It is an important step toward robust image analysis. Segmentation is one of the most difficult tasks in image processing because it de-termines the quality of the analysis of the extracted infor-mation [2]. There are many methods of image segmentation such as edge detection [3-7], Artificial Neural Networks (ANNs) [8, 9], region growing [10, 11], etc. But, the most popular ones are the clustering methods because of their unsupervisedrandom selection nature based on statistics.
Formally, clustering divides an image I into k
non-overlapping subsets C= {C1, C2, ...,Ck} such that
C1∪C2∪ ··· ∪Ck= Iand Ci ∩ Cj= ∅i≠j. In general, each
pixel in an image I is represented by an N-dimensional vector of attributes or features A = {a1, ...,aN}. The main goal
of clustering is to maximize both the homogeneity within each cluster and the heterogeneity among different clusters
[12]. Sometimes clustering can be fuzzy in that each object belongs to one or more clusters to different degrees [13]. In general, because of the image complex structure, clustering can be formally seen as an instance of NP-hard grouping problems [14].
There are many clustering methods that are used in the segmentation of different type of images in different discip-lines.Iterative Self-Organizing Data (ISODATA), K-means, Fuzzy c-means (FCM) are three well-known clustering algorithms in image segmentation [15-17]. However, they require a priori knowledge of the clusters number and some statistical informationwhich must be adjusted after verifica-tion. The solution is to combine a clustering algorithm with anotheralgorithm [18] to form a hybrid method or approach similar to a split and merge method. Another way is to use non-clustering algorithm as a supplier of a prioridatafor a clustering algorithm. The last approach is the subject of this research.
circles, rectangles, or any otheruniform and non-uniform shapes. Sometime a seed (a pixel) is selected and`the selec-tionexpands to include neighboring pixels according to pre-selected thresholds of spectral distance withminimum and maximum number of pixels. The problem with these methods is the dependency onmanual selection of spectral signatures withouta priori knowledge about the structure of the data in the images. This manual way of selection reduces the efficiency and accuracy of the clustering method. So there is a need to create an unsupervised method which can optimize the selection of the spectral signatures. The opti-mization process includes maximizing the homogeneity-between the pixels of and their spectral signature in a cluster and maximizing the number of pixels in order to reduce over-segmentation.
Genetic Algorithms have already proved their usefulness when combined with image clustering methods [19]. However, the capacity of a GA to explore and exploit given population of complicated types of images such as mul-ti-component images is still in progress. Mul-ti-componentimage is characterized by having ti-spectral, multi-spatial, multi-radiometric and mul-ti-temporal components. The increased volume and use of these images has created a strong need for fast and efficient image processing algorithms capable of producing reliable results.
In general, it has been proven that complex image seg-mentation problems have multiple objectives: minimize the distances between pixelsand a cluster center to maximize homogeneity (intra-cluster spread of data), and maximize distances between different clusters (inter-cluster connec-tivity). Consideration of these objectives in combination is a difficult problem, and a multi-objective optimization ap-proach is an appropriate method to solve this problem [20]. The use of a multi-objective approach in satellite image segmentation is still limited, but has great potential [21-23]. In this paper a new unsupervised method is described and evaluated for selecting the signatures from a satellite image using Multi-Objective Genetic Algorithm (MO-GA). The solutions provided by the evolutionaryalgorithmare used bymany segmentation methods such as Artificial Neural Network (ANN) methods, supervised statistical methodsin-cluding Maximum Likelihood [24] and Minimum Distance [25].
The remainder of this paper is organized as follow. After the introduction, Section II explains the concept of mu lti- objective optimization and particularly the Non- dominated Sorting Genetic Algorithm II (NSGA -II). Section III covers in details the Non-dominated Solutions Genetic Algorithm II(NSGA-II)applicationand tuning of parameters. Section IV covers experimental results and discussion. Finally, Section V completes the researchwithconclusionand future perspec-tives.
2.
Multi-Objective Optimization
A multi-objective optimization problem can formally be
stated as [26]: Find the vector v = [v1, v2, ..vn]Tof decision
variables which will satisfy a number of equality and in-equality constraints and optimizes the following vector function:
f(v) = [f1(v), f2(v),…,fk(v)](1)
The constraints define the feasible region F that contains all the admissible solutions. Any solution outside this region is inadmissible since it violates one or more constraints. The vector v denotes an optimal solution in F. The concept of
Pareto optimality is useful in the domain of multi-objective optimization. A formal definition of Pareto optimality from the viewpoint of the minimization problem may be given as follows: A decision vector v is called Pareto optimal if and only if there is no v” that dominates v, i.e. There is no v”
such that
and .
In other words, v is Pareto optimal if there exists no feasible vector v” which causes a reduction on some crite-rion without a simultaneous increase in at least one other. In general, Pareto optimality usually admits a set of solutions called non-dominated solutions.
There are a number of multi-objective optimization tech-niques available. Among them, the GA based techtech-niques such as Non-Dominated Solutions Genetic Algorithm Ver-sion II (NSGA-II)developed by Deb [27] and the Strength Pareto Evolutionary Algorithm 2 (SPEA2) [28]. In this ar-ticle, NSGA-II is used as a framework for the new method because it is more efficient than any other evolutionary multi-objective optimization method.
Non-Dominated Solutions Genetic Algorithm Version II (NSGA-II) uses elitism and a crowded comparison operator that keeps diversity without specifying any additional pa-rameters. Table 1 shows the pseudo code of the NSGA-II. The code shows that the process starts by creating an initial population of size M then their fitness values are computed and according to these values the individuals in the popula-tion are assigned a rank. Then recombinapopula-tion, reproducpopula-tion and mutation operators are applied which results in a larger population two times the initial population. The intermediate population is sorted again based on non-domination criteria before the replacement operator is performed on the inter-mediate population. Once the interinter-mediate population is sorted then the best solution is selected based on crowding distance.This helps NSGA-II in creating diverse fronts by making sure each member stays a crowding distance apart. Each front is filled in ascending order until the addition of population size is reached. This process continues except the initial creation of population until it converges with a global optimal solution of size M.
NSGA-II requires less computation time O(MN2) com-pared to the older version O(MN3) where M is the population and N is the number of objective functions. The old version of the NSGA lacks the elitism that is necessary to speed up the performance of the GA. The new version NSGA-II is able to maintain a better spread of solutions and converge
) ( ) " ( }, ,..., 2 , 1
{ k f v f v
i∈ i ≤ i
better in the obtained non-dominated front compared to other elitist Multi-Objective Evolutionary Algorithms.
Table 1. Pseudo code of NSGA
Initialize population
Generate random parent population of size M
Evaluate objective values
Assign rank (level) based on Pareto dominance – For i =1 to number of generations
Generate child population of size M using binary tournament selection, recombination and mutation.
With combined parent and child populations, assign rank level based on Pareto dominance and sort into sets of non-dominated fronts.
Select the M survivors (next generation parents): Starting from the first front until M individuals found: Determine crowding distance between points on each front.
Select points (elitist) on the lower front (with lower rank) and are outside a crowding distance.
End inner loop End outer loop
Return M individuals in final population as the estimation of the Pareto front.
3. Spectral Signature Selection Optim
zation Using NSGA-II
The goal of this research is to automate and optimize the selection process of spectral signaturesfrom satellite
Initiallythe maximum number of spectral sign
held constant, but the number of pixels in each spectral signature is variable. This means that the inte
representation is a fixed-length “chromo Each gene defines a spectral signature
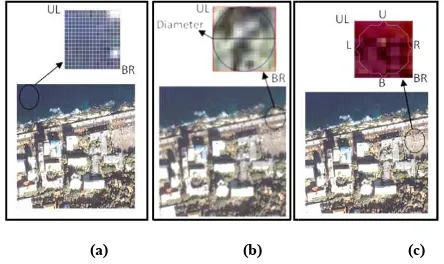
image. To keep things simple, the shapes of the signa limited tosquare and circle.The shapes are simply specifying the upper left and lower
the square or the radius and the center for the circleas it is shown in Figure 1a and 1b. The basic format can easily be extended to become a complex geometric shape such as the oneshown in Figure 1c.
(a) (b)
Figure 1. Spectral signature selection using (a) square ( plex shape
The process of signature selection starts by rea
tellite image which consists of multiple bands. The columns and rows of data in the image are used to create the initial population of chromosomes (individu
dominated front compared to Objective Evolutionary Algorithms.
. Pseudo code of NSGA-II
then sort
using binary tournament selection,
combined parent and child populations, assign rank level based on dominated fronts.
individuals found: stance between points on each front.
Select points (elitist) on the lower front (with lower rank) and are outside a
individuals in final population as the estimation of the Pareto
Signature Selection
Optimi-The goal of this research is to automate and optimize the sfrom satellite images. nitiallythe maximum number of spectral signatures was f pixels in each spectral . This means that the internal NSGA-II osome” of m “genes”. nature selected from the shapes of the signaturesare cle.The shapes are described by simply specifying the upper left and lower right corners of the square or the radius and the center for the circleas it is basic format can easily be become a complex geometric shape such as the
(c)
) square (b) circle (c)
com-The process of signature selection starts by reading a sa-of multiple bands. The columns and rows of data in the image are used to create the initial uals) with the same
length (m spectral signatures) but a variable number of pi els within each spectral signature.
In this research the multi-objective “fitness” of an ind vidual involves two functions, each measuring
characteristicof the satellite image. The first one represent the distance (Euclidean) between
presentsthe selectedspectral signature pixels (Pixel(Equation 2). The variables number of rows and columns in a
and n is the number of bands in the image. The goal is to minimize the sum of differences between
signatures and their neighboring pixels
h h
r c
m n
h 1 i 1 j 1 k 1
(Clust(h,round( ),
min( sqrt( ))
c
round( ),k)-Pixel(i,j,k))^2 2
= = = =
∑ ∑ ∑
∑
The second function measures the number of pixels reach spectral signature, the goal of which is to ma the number ofpixelsin a setof
3). The degree of homogeneity in each spe increases the efficiency of the clustering algorithm.
The spectral signatures are subject to the following co straints:
1-The minimum matrix size whic signature is 3×3,
2- The maximum is ri×ci on condition that ri=ci(ri and ciare the number of rows and columns in an image).
The constraints on the minimum and maximum number of
spectral signatures (m) are m ≥1 and m ≤
wxw is the initial size of the spectral signature. In caseri than columns and rows are padded with zeros until their sizes areequal.
Finally, two signatures are combined if the difference of the average spatial value of both neighbor signatures is less than and the difference between the two spectral values
is less than
ε
2. Such thatcording to the following formula:
= and
Where mean, max, min, and imumand minimum intensity values
the dimension of image im.Once a parent population is in place, a child population is created by selecting parents based on their non-dominated sorting fitness using binary tournament selection [29]. In this r
selected to produce two offspring via uniform cr [30-31].The uniform crossover uses a fixed mixi between two parents. Unlike, one and two
the Uniform Crossover enables the parent chromosomes to
max( 1
ε
1ε
1ε
spectral signatures) but a variable number of pix-ch spectral signature.
objective “fitness” of an indi-vidual involves two functions, each measuring a different-satellite image. The first one represents
an) between the mid pixel which re-spectral signatureClust and the other
). The variables rh, ch are the
number of rows and columns in a matrix (spectral signature), is the number of bands in the image. The goal is to fferences between a set of m spectral s and their neighboring pixels.
h
h
r (Clust(h,round( ),
2
min( sqrt( ))
c
round( ),k)-Pixel(i,j,k))^2 2
(2)
The second function measures the number of pixels fo-signature, the goal of which is to maximize
of spectral signatures (Equation The degree of homogeneity in each spectral signature increases the efficiency of the clustering algorithm.
(3)
The spectral signatures are subject to the following
con-The minimum matrix size which represents a spectral
ci on condition that ri=ci(ri and ciare the number of rows and columns in an image).
The constraints on the minimum and maximum number of
spectral signatures (m) are m ≥1 and m ≤ where
is the initial size of the spectral signature. In caseri≠ci than columns and rows are padded with zeros until their
Finally, two signatures are combined if the difference of the average spatial value of both neighbor signatures is less
and the difference between the two spectral values
and are calculated ac-cording to the following formula:
and = (4)
, and size are the average, max-minimum intensity values. The parametersize is
.Once a parent population is in on is created by selecting parents dominated sorting fitness using binary In this research two parents are selected to produce two offspring via uniform crossover rossover uses a fixed mixing ratio between two parents. Unlike, one and two-point crossover, sover enables the parent chromosomes to
contribute the gene level rather than the segment level. If the mixing ratio is 0.5, the offspring has approximately half of the genes from first parent and the other half from second parent.The newly created children are then subject to muta-tion operator that modifies the size of a signature by incre-menting/decrementing the Upper Left (UL) and/or Lower Bottom (BL) coordinates by 2 within the constraints speci-fied earlier. Preliminary experiments indicated that a muta-tion rate between 0.05 and 0.1 can produce best results. The following pseudo code (Table 2) shows clearly how muta-tion operamuta-tion works.
To provide additional diversity beyond the spectral sig-natures making up the initial population, a second mutation operator is implemented which replaces an existing spectral signature with a randomly generated one. This form of mu-tation is more explorative and may slow the process of convergence producing better global solutions.
Table 2. Pseudo code of the mutation operator
The replacement function replaces the individuals based on rank and crowding distance. After completing the process of producing an offspring population, the next generation of
M parentsis chosen from the current parent and offspring populations based on non-dominated ranking and crowding. The new parent population represents the current estimate of the entire Pareto front. The quality of that estimate is cal-culatedusing the standard HypervolumeTndicatorintroduced by Coelloet al. [32].
This process is repeated until the limit on the number of generation is reached or there is no further improvement in the Hypervolume indicator. Table 3 gives the pseudo-code of the overall process of applying MO-GA based on NSGA-II in the creation of the new automatic signature selection tool.
Notice that the notion of Pareto optimality implies a set of non-dominated solutions based on the objectives given. It is then the job of the Decision Maker (DM) to select which of the non-dominated solutions (if any) are preferable based on other aspects not specified as part of the multi-objective optimization problem [33].
Table 3. Signature selection method pseudo code
Read multi-component image.
Initialize the parameters (including the number of spectral signatures). Choose the population size.
Determine the number of generations.
Initialize the population with random spectral signatures. Run NSGA-II until the stopping criteria is satisfied
Return as a result the final population which represents the best estimate of the Pareto front.
4. Experimental Results
In order to evaluate the effectiveness of the new signature selection method, images from twodifferent satellites are used. SPOT V and Quickbirdimages.SPOT V offers a reso-lution of 2.5 to 5 meters in panchromatic mode and 10 me-ters in multi-spectral mode. Quickbirdsatellite imagehave four multi-spectralbands with 2.4 meter resolution and one panchromatic band with0.61 meter resolution.The results of the new signature selection algorithm are passed to K-means algorithm [34-36]and Fuzzy c-means [37-38] to complete the clustering process. K-means follows a simple procedure for classifying a given data set using a predefined number of
k clusters.The number of clusters is decided by the supplied spectral signatures which are obtained by the multi-objective evolutionary algorithm.Fuzzy c-means (FCM) is a method of clustering which allows one piece of data to belong to two or more clusters. This method is frequently used in pattern recognition. It is based on minimization of a defined objec-tive function.
4.1. Selecting the Best Parameters for MO-GA
The first step is to decide on the population size and the number of generations. Normally, the selection of these parameters depends strongly on the size of the image. A rule of thumb, if the image sizes are organized into four catego-ries (a very large image is an image having a size greater than 2048×2048 pixels, large image is an image between 512×512 and 2048×2048 pixels, a medium is between 128×128 and 512×512 pixels and finally small one is less than128×128 pixels) then the population size and the chromosome length increases 30 individuals and 4 genes for each increment of 128×128 pixels. It is preferable to start with a population of size 20 and individual length of 8 genes (each represents 4 coordinates) for small image.
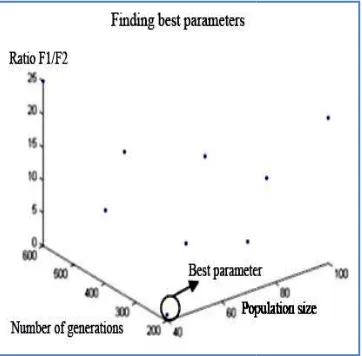
The above rule is used to decide on the initial population size and individual length. However, experiments are still needed to find the optimal combination of the population size and individual (chromosome) length. In this research the population size is varied between 40 and 100 and the individual length is varied between 64 and 96 representing either 16or 24 matrices (spectral signatures) with 4 coordi-nates. Finally, the number of generations varied between 200 and 600. The ratio of both objective functions (F1/F2) is calculated such that the closer the ratio to zero the better, so one can conclude after several experiments that the popula-tion size 100 and the chromosome length 96 are the best combination (Figure 2).
In order to find the best results, the new selection method is run with different mutation and reproduction rates. The mutation rate is varied between 5% and 10% while cros-sover rate is varied between 60% and 80%. The population size is set to 100 and individual length is 96.
The outcomes of running the method with different pa-rameters are compared with respect to many criteriasuch as: 1-The stable progress toward the final solutions,and 2-the fast or slow convergence toward global or local optimal solutions. From the results of the experiments,mutation
and crossover operators with 5% and 60% rates are
se-Select a gene that has a position as either 1 or modulo 4 If the position is greater than number of rows or columns then subtract 2
lected.The smooth increase in the number of pixels acco panied by the increase in homogeneity in every selected area is the reason for selecting these rates. The other parameters are not selected because the number of pixels
neityincrease simultaneously.But suddenly the homoge of the selected pixels and spectral signatures
This means that the run of the algorithm earlier and we have a premature convergence optimal solution.
Figure 2. Different parameters with chromosome length
After the convergence of MO-GA the population represents the final solution. Diversity in the solution is preferred (different number of classes or spectral signatures because it helps the decision makersto
tion.
4.2. Optimizing the Selection of the Spectral Signatures Using MO-GA
In theexperiment, pan sharpened SPOT size 304X304 pixels for different locations is image is of 5 metersresolution and it represents
urban and agricultural site (Figure 3a). The QuikBird image is used to verify the segmented SPOT
from the same area during the same period of the year (Figure 3b).The size of the QuickBird imageis
pixels with resolution of 0.61 meter.
(a)
Figure 3. Satellite images (a ) SPOT V image (
ber of pixels accom-ity in every selected area is the reason for selecting these rates. The other parameters the number of pixels and
homoge-ut suddenly the homogeneity of the selected pixels and spectral signatures decreases again.
of the algorithm should be aborted convergence toward a local
Different parameters with chromosome lengthof96
GA the population presents the final solution. Diversity in the solution is or spectral signatures) select the best
solu-he Spectral Signatures
nt, pan sharpened SPOT VXS image of for different locations is used. The and it represents large area of . The QuikBird image image. It is selected from the same area during the same period of the year size of the QuickBird imageis 1900X1900
(b)
) SPOT V image (b) QuickBird image.
As it is decided beforethe population consists of 100 i dividuals, the number of generations is 600, and the length of the chromosome “individual” is 96. The final solutions of the MO-GA are investigated and the
are selected. The reason for the selection of 4 classes is based on the preferences to reduce(generalize) the classesin the image. Normally, the verification of generalized classes using a very high resolution image is much simpler detailed classes which requirefield verification.
best matrix in the group of matrices of 4 classes the one with the highest number of pixels and
lected. Then the spectral signatures are provided to
and Fuzzy c-meansas the initial cluster centers to segment the SPOT V image.
After the convergence of MO (final solution) is selected. However, tures have similar values which mean that multi-objective solution may consist
with different number of spectral signatures.Figure 4 the satellite image with different solutions (
natures) such that each solution has different signature or class represented by a square
one can see that each has different size and different position Sometime these signatures may have the same value difference is less than a certain threshold. Knowing the relationship between these different signatur
removing redundancies by using one value for many similar signatures
efficiency of the selection method a procedure which co bines similar spectral signatures (classes)
redundancy is implemented. Figure
dividual (4 spectral signatures) after using theprocedure which removes the redundanc
signatures.
(a)
Figure 4. The selected signatures (a) original by MO redundancy elimination procedure.
Several areas are selected as samples for verification u ing the QuickBird high reso
represent vegetation, urban and soil classes.
with 4 classes generalize the object and combine different classes while the other segmented images
number of classes gives more details. Sometime spectral signatures indicate an over
correct number of spectral signature
the population consists of 100 in-viduals, the number of generations is 600, and the length of the chromosome “individual” is 96. The final solutions of estigated and the matrices with 4 classes The reason for the selection of 4 classes is based on the preferences to reduce(generalize) the classesin the image. Normally, the verification of generalized classes using a very high resolution image is much simpler than detailed classes which requirefield verification. To find the best matrix in the group of matrices of 4 classes the one with pixels and besthomogeneity is se-spectral signatures are provided to K-means meansas the initial cluster centers to segment
After the convergence of MO-GA one of 100 individuals However, some spectral signa-which mean that the final optimal may consist of different individuals spectral signatures.Figure 4a shows the satellite image with different solutions (10 spectral sig-natures) such that each solution has different signature or class represented by a square. Investigating these squares one can see that each has different size and different position. Sometime these signatures may have the same value or their difference is less than a certain threshold. Knowing the relationship between these different signatures will help in removing redundancies by using one spectral signature signatures. In order to increase the efficiency of the selection method a procedure which com-bines similar spectral signatures (classes) and eliminates
is implemented. Figure 4b shows the final in-spectral signatures) after using theprocedure which removes the redundanciesin the original 10 spectral
(a) (b)
) original by MO-GA (b) after the
ho-mogeneity will increase and over-segmentation will d crease. Out of 4 classes 3 are selected
cause they represent different important and general in the SPOT V satellite image. This makes the job of ver fication easier and eliminates the need for field survey. The classes represent urban and other featuressuch as roads with green houses, vegetation, and soil. A number o
selected randomly from each class and
pared with the same objects which exist in the high resol tion image (Figure 5aand 5b).
(a)
( c ) (d)
(e) (f)
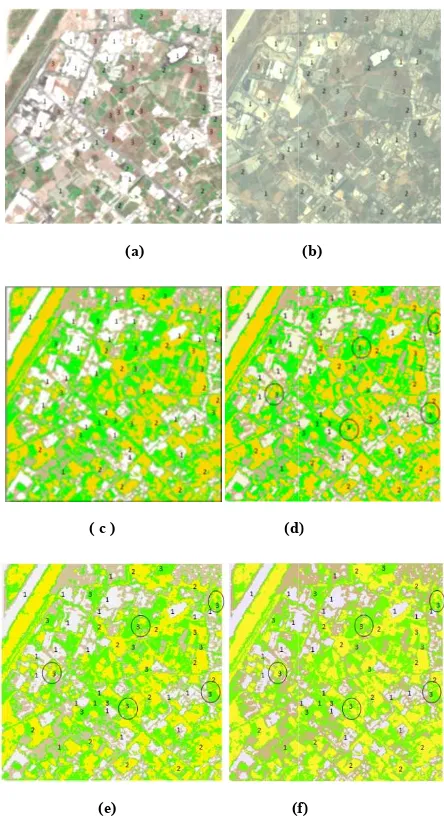
Figure 5. Selected samples (a) SPOT V image (b) QuickBird image ( segmented image by MO-GA + K-means (d) segmented image by random K-means (e) Segmented image by MO-GA + FCM (f) segmented image by normal FCM.
The samples are distributed uniformly and represents the three classes 1- Urban and others (White), 2
(Yellow), and 3- Soil (green). In the SPOT image t of the first class is 24 objects, 15 objects for each classes. Table 4 provides a way to compute the acc the selected samples in a way similar to the conf
of Kohavi and Provost [39].The only difference isthe d pendabilityof the predicted and actual data on field verif
segmentation will de-are selected for verificationbe-mportant and general features in the SPOT V satellite image. This makes the job of veri-fication easier and eliminates the need for field survey. The
and other featuressuch as roads with green houses, vegetation, and soil. A number of objects are and then they are com-the same objects which exist in com-the high
(b)
(d)
(f)
) QuickBird image (c) means (d) segmented image by random
GA + FCM (f) segmented image by
The samples are distributed uniformly and represents the Urban and others (White), 2- Vegetation In the SPOT image the number of the first class is 24 objects, 15 objects for each other Table 4 provides a way to compute the accuracy of the confusion matrix 9].The only difference isthe de-the predicted and actual data on field
verifi-cation.
The normal K-means and Fuzzy c
same initial number of iterations as that of MO
method and the results of clustering are shown in Figures 5c to 5f which include some investigated spots (circles). In our case, MO-GA with K-means and Fuzzy c
after less than 40 iterations. On the other hand, K FCM with random selection process (normal K
FCM) converged after more than 100 iterations. In addition, it took between 10 and 17 seconds to complete the process for both algorithms compared to less than 4 seconds for MO-GA based process.
The percentage of the correct segmented features ind cates the accuracy of the new selection method. According to the results in Table 4, 5, 6 and 7
identified objects is indicated in the diagonal of the table. The remaining cells in the table indicate the number of conflicts with other selected objects e.g. urban object soil or vegetation objects.
The total number of the samples in the by the total number of all samples indica
of accuracy. The segmented image with 4 classes isused for the verification process of MO
method. The calculated accurac selection method is more than 95% (K
c-means based on MO-GA). While theaccuracy for the normal K-means and Fuzzy c
less or equal to 85%.
Table 4. Verification of the clustered image by MO
Urban
and others Vegetation
Urban and
others 23 0
Vegetation 0 15
Soil 0 1
Total 23 16
Table 5. Verification of the clustered image by random
Urban
and others Vegetation
Urban and others 23 0
Vegetation 0 13
Soil 0 5
Total 23 18
Table 6. Verification of the clustered image by MO
Urban
and others Vegetation
Urban and others 24 0
Vegetation 0 15
Soil 1 1
Total 25 16
and Fuzzy c-means are run with the same initial number of iterations as that of MO-GA based method and the results of clustering are shown in Figures 5c to 5f which include some investigated spots (circles). In our means and Fuzzy c-means converged after less than 40 iterations. On the other hand, K-means and FCM with random selection process (normal K-means and FCM) converged after more than 100 iterations. In addition, it took between 10 and 17 seconds to complete the process lgorithms compared to less than 4 seconds for
The percentage of the correct segmented features indi-cates the accuracy of the new selection method. According
6 and 7 the number of correctly cts is indicated in the diagonal of the table. The remaining cells in the table indicate the number of conflicts with other selected objects e.g. urban objects with
samples in the diagonal divided of all samples indicates the percentage The segmented image with 4 classes isused for the verification process of MO-GA based signature selection method. The calculated accuracyof the new unsupervised than 95% (K-means and Fuzzy GA). While theaccuracy for the means and Fuzzy c-means with random processis
Verification of the clustered image by MO-GA and K-means.
Vegetation Soil Total
2 25
15 0 15
14 15
16 16 55
Verification of the clustered image by random K-means.
Vegetation Soil Total
2 25
3 2 15
10 15
8 14 55
Verification of the clustered image by MO-GA and Fuzzy c-means.
Vegetation Soil Total
1 25
15 0 15
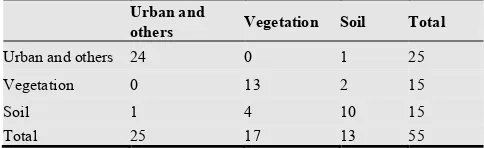
Table 7. Verification of the clustered image by random Fuzzy c-means.
Urban and
others Vegetation Soil Total
Urban and others 24 0 1 25
Vegetation 0 13 2 15
Soil 1 4 10 15
Total 25 17 13 55
5. Conclusions
In this research multi-objective Genetic Algorithm (MO-GA) is used to create a robust and efficient spectral signature selection method. The role of the Non-Dominated Sorting GA version II (NSGA-II) in the new method is to find a global optimal solution of spectral signatures. The solution consists of many individuals each is a possible group of spectral signatures which can be used with any segmentation/classification algorithm such as K-means and Fuzzy c-means. The obtained individuals represent the global optimal solutions with different characteristics such as the total number of pixels and the degree of homogeneity. Several experiments are conducted to find the best combi-nations of parameters which represent the size of the popu-lation, the size of the individuals and the reproduction rates. Other parameters such as the maximum and minimum size of the matrix which represents a gene in a chromosome (individual) are affected by the size of the image. These parameters must be computed each time the satellite image type and size are changed. In our case, the image is consi-dered to be medium size image and the parameters are se-lected according to the criteria set in the experiments. The reproduction operator rates of the MO-GA are selected after several try and test experiments where the objective is to minimize the heterogeneity and maximize the number of pixels per spectral signature.
The application of this selection method to a Spot V multi-spectral satellite image and the verification of the results using another high resolution QuickBird satellite image have proved the reliability of this method. The veri-fication method is based on the collection of sample objects representing different classes such as vegetation and urban. The results indicate that the accuracy of the new selection tool can reach more than 95 %. Although, the verified image consists of only 4 classes, other images can be verified too depending on the required details and the available verifi-cation data. The new selection method can be used as an unsupervised spectral signature selection tools. The speed of the new selection tool is more than 4 times faster compared to the traditional method of random selection of cluster centers by K-means and Fuzzy c-means with the same initial number of iterations as the MO-GA.
In the future there are many issues left to be solved such as how accurate this new method is compared to the supervised selection methods. In addition, there are unsupervised me-thods which depend on random selection of seeds and which can be compared in combination with the new selection
method.
The new selection method uses different geometric shape (N×N matrix) which may represent a square or a circle. The next step is to improve the selection method and to modify it in order to use other different geometric shapes such as hexagon, octagon, non-uniform shapes.
References
[1] R. Demirci, Rule-based automatic segmentation of color images. International Journal of Electronics and Communi-cation60, 435 – 442(2006).
[2] W. Pratt, Digital Image Processing. 2nd edition, (Wiley &Sons Inc, New York., 1991).
[3] I. Sobel, G. Feldman, A 3x3 Isotropic Gradient Operator for Image Processing, In: Hart, Pattern Classification and Scene Analysis, (Wiley and Sons, New York, 1973), ed. by R. Duda, and P. Hart, pp. 271-2.
[4] J. Canny, Computational approach to edge detection,IEEE Trans. On Pattern Analysis and Machine Intelligence 8( 6), 679-698 (1986).
[5] J. Shen and S. Castan, An optimal linear operator for edge detection, In Abstract of the Proceeding of IEEE Int. Conf. On Computer Vision and Pattern Recognition, USA, 1986. [6] M. Kass, A. Witkin and D. Terzopoulos, Snakes: Active
Contour models,International Journal of Computer Vision 1, 259-268 (1987).
[7] R. Deriche, Using Canny's criteria to derive a recursively implemented optimal edge detector,International Journal of Computer Vision 1(2), 167-187(1987).
[8] M. Awad, K. Chehdi, and A. Nasri, Multi-component Image Segmentation Using Genetic Algorithms and Artifi-cial Neural Network, IEEE Geosciences and Remote Sensing Letters 4(4), 571-575(2007).
[9] M. Awad, An unsupervised Artificial Neural Network me-thod for satellite image segmentation,International Arabic Journal of Information Technology (IAJIT) 7( 2), 199-205 (2010).
[10] F. Shih, and S. Cheng,Automatic seeded region growing for color image segmentation,Image and Vision Computing 23 (10), 877-886 (2005).
[11] L. Garcia, E. Saber, S. Vantaram, V. Amuso, M. Shaw, R. Bhaskar, “Automatic Image Segmentation by Dynamic Re-gion Growth and Multiresolution Merging,” IEEE Transac-tion on Image Processing 18(10), 2275-2288 (2009). [12] L. J. Arabie, G. Hubert, and P. DeSoete, Clustering and
Classification.(World Scientific, Singapore, 1999).
[13] F. H¨oppner, F. Klawonn, R. Kruse, and T. Runkler, Fuzzy Cluster Analysis: Methods for Classification, Data Analysis and Image Recognition. (Wiley and Sons,1999).
[14] E. Falkenauer, Genetic Algorithms and Grouping Prob-lems.Wiley and Sons, 1998).
[16] H. Ng, S. Ong, K. Foong, P. Goh, W. Nowinski, Medical Image Segmentation Using K-Means Clustering and Im-proved Watershed Algorithm, In the abstracts of IEEE Southwest Symposium on Image Analysis and Interpretation, Colorado, USA, 2006.
[17] J. Noordam, W. Broek, and L. Buydens, Geometrically Guided Fuzzy C-means Clustering for Multivariate Image Segmentation, In the Abstracts of 15th International Confe-rence on Pattern Recognition (ICPR'00), Spain, 2000. [18] M. Awad, K. Chehdi, and A. Nasri, Multi-component image
segmentation using Hybrid Dynamic Genetic Algorithm and Fuzzy C-Means,IET image processing 3 ( 2), 52-62 (2009). [19] M. Awad, K. Chehdi., Satellite image segmentation using
variable hybrid Genetic Algorithm,International Journal of Imaging Systems and Technology (19), 199-207 ( 2009). [20] V. Guliashki, H. Toshev, and C. Korsemov, Survey of
Evolutionary Algorithms used in multi-objective optimiza-tion,Problems of Engineering Cybernetics and Robotics 60, Bulgarian Academy of Sciences, 2008.
[21] S. Bandyopadhyay, A. Srivastava and S. Pal, `Mul-ti-objective Variable String Genetic Classifier: Application to Remote Sensing Imagery, ed. A. Ghosh and S. Pal, Lecture Notes in Soft Computing, Image Processing and Pattern Recognition, (World Scientific,2002), 65-94.
[22] A. Mukhopadhyay, S.Bandyopadhyay, and U. Maulik, Clustering using multi-objective genetic algorithm and its application to image segmentation, In Abstracts ofIEEE In-ternational Conference on Systems, Man and Cybernetics 3, Taipei, Taiwan, 2007.
[23] N. Ghoggali, F. Melgani, and Y. Bazi, A Multi-objective Genetic SVM Approach for Classification Problems With Limited Training Samples, IEEE Trans. on Geosciences and Remote Sensing 47, 1707-1718 ( 2009).
[24] J. Aldrich, R. A. Fisher and the making of maximum like-lihood 1912–1922, Statistical Science 12( 3), 162–176 (1997).
[25] P. Swain, and S. Davis. Remote Sensing: The Quantitative Approach. (McGraw Hill Book Company, New York, 1978). [26] K. Deb, Multi-objective Optimization Using Evolutionary
Algorithms. (John Wiley and Sons, England, 2001). [27] K. Deb, S. Agrawal, A. Pratab, and T. Meyarivan, A fast
elitist non-dominated sorting genetic algorithm for mul-ti-objective optimization: NSGA-II, Springer Lecture Notes in Computer Science No. 1917, 849–858 ( 2000). [28] E. Zitzler, M. Laumanns, and L. Thiele, “SPEA2: Improving
the Strength Pareto Evolutionary Algorithm,” Gloriastrasse 35, CH-8092 Zurich, Switzerland, Tech. Rep. 103, 2001. [29] D. Goldberg, K. Deb, A comparison of selection schemes
used in genetic algorithms,ed. by G.J.E. Rawlins, (Morgan Kaufmann Publishers, San Mateo, CA, 1991), p. 69-93. [30] G. Syswerda, Uniform Crossover in Genetic Algorithms,
ed.D. J. Schaffer, in proceedings of the Third International Conference on Genetic Algorithms ICGA, (Morgan Kauf-mann, Los Altos, Ca, 1989), p. 2-9.
[31] W. Spears and K. De Jong, On the virtues of parameterized uniform crossover, ed. R. K. Belew and L. B. Booker, in proceedings of International Conference on Genetic Algo-rithms, Morgan Kaufmann, Los Altos, Ca, 1991), p. 230–236.
[32] C. A. CoelloCoello, D. A. Van Veldhuizen, and G. B. Lamont, Evolutionary algorithms for solving Multi-objective prob-lems. (Kluwer Academic Publishers, New York, 2002). [33] E. Zitzler, Evolutionary algorithms for multiobjective
opti-mization: Methods and applications, PhD Dissertation, Swiss Federal Institute of Technology Zurich, 1999.
[34] J. MacQueen, Some Methods for classification and Analysis of Multivariate Observations, In Abstracts of 5-th Berkeley Symposium on Mathematical Statistics and Probability 1, Berkeley, University of California, USA , 281-297 (1967). [35] R. Duda, P. Hart, and D. Stork D, Pattern Classification,
Second Edition. (JohnWiley& Sons, New Jersey, 2000). [36] J. Tou and R.Gonzalez, Pattern RecognitionPrinciples.(
Ad-dison-Wesley, MA, 1974).
[37] J. Dunn, A Fuzzy Relative of the ISODATA Process and Its Use in Detecting Compact Well-Separated Clusters, Journal of Cybernetics 3, pp. 32-57, 1973.
[38] J. Bezdek, Pattern Recognition with Fuzzy Objective Func-tion Algoritms, (Plenum Press, New York,1981.