Please cite this article as: Z. Mortezaie, H. Hassanpour, S. Asadi Amiri, Image Enhancement Using an Adaptive Un-sharp Masking Method Considering the Gradient Variation, International Journal of Engineering (IJE), TRANSACTIONS B: Applications Vol. 30, No. 8, (August 2017) 1118-1125
International Journal of Engineering
J o u r n a l H o m e p a g e : w w w . i j e . i rImage Enhancement Using an Adaptive Un-sharp Masking Method Considering the
Gradient Variation
Z. Mortezaiea, H. Hassanpour*a, S. Asadi Amirib
a Department of Computer Engineering, Shahrood University of Technology, Shahrood, Iran b Department of Engineering and Technology, University of Mazandaran, Babolsar, Iran
P A P E R I N F O
Paper history: Received 20 April 2017
Received in revised form 22 June 2017 Accepted 07 July 2017
Keywords: Un-sharp Masking Blur Image Image Gradient Image Enhancement
A B S T R A C T
Technical limitations in image capturing usually impose defect, such as contrast degradation. There are different approaches to improve the contrast of an image. Among the exiting approaches, un-sharp masking is a popular method due to its simplicity in implementation and computation. There is an important parameter in un-sharp masking, named gain factor, which affects the quality of the enhanced image. In this paper, a new adaptive un-sharp masking method is proposed. In the proposed method gradient variation of the image is used to estimate the gain factor for un-sharp masking. Gradient variation of an image can provide information about the image contrast. Subjective and objective image quality assessments are used to compare the performance of the proposed method both with the classic and the recently developed un-sharp masking methods. The experimental results show the superiority of the proposed method compared to the existing methods in image enhancing using un-sharp masking.
1. INTRODUCTION1
Technical limitations such as environmental conditions, image capturing device constraints and lack of skill of photographer, usually impose defect on captured images. Contrast degradation is one of the imposing defects which occurs by degradation in high frequency components (edges) of image. Since contrast degradation directly affects the quality of the image, image enhancement methods can be used to improve the images contrast.
There are various image enhancement methods in literature [1-5]. One of these approaches is un-sharp masking. Simplicity in implementation and computation are two important specifications in this technique. The purpose of using this method is contrast enhancement via boosting high frequency regions, such as image edges. In the classic un-sharp masking technique, at first, the high frequency components of the input image is extracted by using a linear high pass filter, then via
*Corresponding Author’s Email: [email protected] (H. Hassanpour)
adding a scaled amount (the gain factor) of these components to the input image, a sharper image is obtained. The gain factor has an important influence on un-sharp masking results. Indeed, undesirable gain values may lead to an over sharpening problem or a negligible influence on the image quality.
A number of methods have been introduced in the literature to improve the classic un-sharp masking technique. The method introduced by Polesel et al. [6] initially segments the image into three different areas: low contrast, medium contrast and high contrast areas. Based on these three segments, appropriate gain factors are applied to each segment. In this method, the gain factors for each segment are determined experimentally. Due to the influence of image segmentation on the quality of resulted image, others [7] have tried to improve the segmentation approach introduced by Polesel et al. [6]; similarly the gain factor for each segment is determined experimentally. In another study [8], an un-sharp masking has been proposed to enhance the dark regions details of an image similar to the bright regions which matches the response of human visual
system well. In this method by applying the negative operation, the dark regions are transformed to the bright regions. Then to reduce the noise effect, a mean weighted high pass filter is used to extract the regions edges. In this method, a constant gain factor is applied to all input images. A method, using the discrete wavelet transform (DWT), was proposed in the literature [9] for reducing the over sharpening. In this method, a set of wavelet coefficients are obtained by applying the DWT to the input image. To reduce the over sharpening problem, the wavelet coefficients which are related to extra details are trimmed. By applying the inverse discrete wavelet transform (IDWT) to the rest of the coefficients, the image containing the edges of the input image is obtained. Then, the scaled value of this image is added to the input image for enhancing. Others [10] combined DWT with the method proposed by Polesel et al. [6] to enhance the satellite images. In these two last methods which are based on DWT, the gain factors are chosen as a constant value throughout the input image.
In all of the above mentioned approaches, the gain factors are chosen without considering the quality and the content of the input image. There are some approaches that choose the gain factor by considering these issues. Mai et al. [11] used the particle swarm optimization (PSO) to automatically find the gain factor for gray-level input images. In this method the optimization is based on maximizing the enhanced image entropy. But maximizing the entropy may lead to an over sharpening problem. In another work [12] the same idea has been proposed to determine the gain factor for color input images. In this approach the PSO is used based on maximizing the enhanced image entropy and minimizing the number of over ranged pixels to overcome the over sharpening problem. Time consumingness is an important problem in these workes [11,12]. In another study [13], a fast method has been proposed, which is based on intensity of the input image and the extracted edges. In this method, the intensity of the input image and the extracted edges are applied to a hyperbolic tangent function to determine the gain factor automatically. This method causes an over sharpening problem on some images.
In this paper, we will propose a new adaptive un-sharp masking method. Our proposed method is based on the gradient variation of the images. The main idea is that a sharp image has a higher gradient than a blur one. Indeed, the appropriate gain factor can be chosen automatically by considering the gradient information of the input image and the image under enhancing. This premise is used in the proposed method, hence, the gradient information in horizontal and vertical directions and the second order gradient of the images are used to increase the accuracy of the results.
This paper is structured as follows: the classic un-sharp masking method is reviewed in Section 2. The
proposed method is presented in Section 3. In Section 4, image quality assessment is introduced. The experimental results and conclusion are presented in Sections 5 and 6, respectively.
2. THE CLASSIC UN-SHARP MASKING
In classic un-sharp masking, the sharp image is obtained via following equation:
𝑦(𝑛, 𝑚) = 𝑥(𝑛, 𝑚) +1
𝜆× 𝑧(𝑛, 𝑚) (1)
𝑧(𝑛, 𝑚) = 𝑥(𝑛, 𝑚) − 𝑥(𝑛, 𝑚) ∗ 𝑓 (2)
𝑓 =1
9 [
1 1 1
1 1 1
1 1 1
] (3)
where, 𝑦(𝑛, 𝑚) is a sharp image. 𝑥(𝑛, 𝑚) is the input image, 𝑧(𝑛, 𝑚) represents high frequency components,
𝜆 is the gain factor and ∗ indicates convolution. Indeed, by applying the linear high pass filter to 𝑥(𝑛, 𝑚),
𝑧(𝑛, 𝑚) is obtained; hence, 𝑧(𝑛, 𝑚) involves high
frequency components of 𝑥(𝑛, 𝑚). High frequency components are scaled via gain factor.
The small gain value causes an over sharpening problem, and a large gain value has a little influence on the images quality. Hence, the image contrast can be increased via choosing an appropriate value for this parameter. In classic un-sharp masking, this factor is chosen as a constant value without considering the content of the input image. Figure 1 indicates an example of the influence of gain value on un-sharp masking result. In this figure, part (a) is the input blur image and parts (b-d) are the results of un-sharp masking with low, high and an appropriate gain factor, respectively.
3. PROPOSED METHOD
In this section, a new adaptive un-sharp masking is proposed. The proposed method is based on image gradient variation. As mentioned before, a sharp image has a higher gradient than a blur one which is the premise of our proposed method.
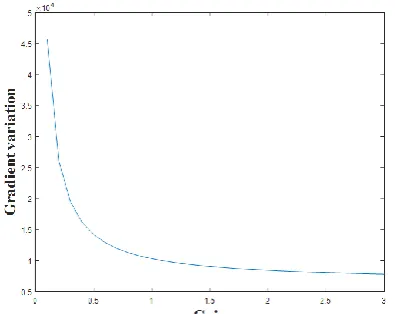
increasing the accuracy of the proposed method, the gradient variation is considered in three forms: 1-norm of gradient in horizontal direction, 1-norm of gradient in vertical direction, and the 1-norm of the second order gradient. Figure 2 represents the gain factor influence on the 1-norm of gradient in horizontal direction for 30 different processed images.
(a) Blur image
(b) Low gain factor (𝜆 = 0.1)
(c) High gain factor (𝜆 = 3)
(d) Appropriate gain factor (𝜆 = 0.6)
Figure 1. The results of the classic un-sharp masking method
with different gain factors
Figure 2. The results of 1-norm of gradient variation versus
gain factor
As mentioned before, these images are achieved by applying 30 different gain factors to un-sharp masking an input image. In this figure, the horizontal and vertical axes indicate 30 different gain values and the 1-norm of horizontal direction gradient variation, respectively.
This figure shows that by increasing the gain factor, the 1-norm of gradient of the processed image is decreased. Similar results are obtained for both vertical direction and the second order gradient.
All of the processed images are sharper than the input image; so, they have a higher gradient value than the input image. In our proposed method, the gradient information is used to automatically choose the most appropriate image. For increasing the accuracy of the proposed method, we consider, the gradient information in horizontal and vertical directions and the second order gradient as Equation (4):
𝑆 = (‖𝐹𝑋‖‖𝑓𝑥‖) × (‖𝐹𝑌‖‖𝑓𝑦‖) × (‖𝐹𝑋𝑌‖‖𝑓𝑥𝑦‖), (4)
where 𝐹𝑋, 𝐹𝑌 and 𝐹𝑋𝑌 are respectively the input image gradients in horizontal direction, vertical direction and the second order gradient associated with the input image. Similarity 𝑓𝑥, 𝑓𝑦 and 𝑓𝑥𝑦 represent the same meaning for the processed image, and ‖. ‖ symbol indicates 1-norm.
In this equation, 𝐹𝑋, 𝐹𝑌 and 𝐹𝑋𝑌 are independent of the gain factor. But, 𝑓𝑥, 𝑓𝑦 and 𝑓𝑥𝑦 depend on the gain factor. As mentioned before, the 1-norm of gradient is increased for the small value of gain factor. Whereas this value is decreased for a large value of gain factor. Hence, increasing the gain factor causes increasing the 𝑆
value. Moreover the gradient of the over sharpened images is large, and these images cause decreasing the 𝑆
value. Hence, for avoidance of the over sharpening problem, increasing the 𝑆 value is desirable.
As mentioned before, 30 different processed images are obtained via considering 30 different gain values. Most of these gain values cause a little variation in 𝑆
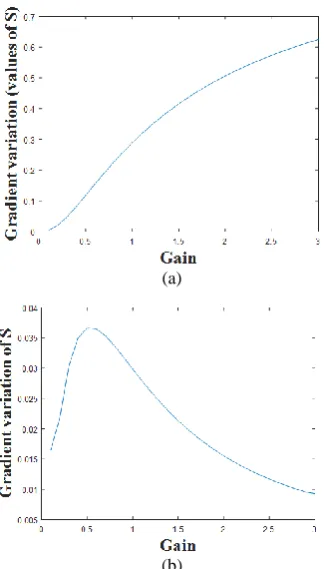
sharpening problem in the processed images and some of them have a little influence on the quality of the input image. One of the gain values causes that 𝑆 has a maximum increment; indeed, the smaller gain values cause an over sharpening problem and the larger gain values have no significant influence on the input image quality. So, we should choose the gain value that causes the maximum increment in 𝑆 value as the most appropriate gain value and apply it to the input image. In our proposed method the gradient of 𝑆 value is used to find the maximum increment in the 𝑆 value. The gain value that causes this increment is determined accordingly. The values of 𝑆 for 30 different gain factors and the gradient of 𝑆 are indicated in Figures 3(a) and (b), respectively. In part (a) of this figure, the horizontal and vertical axes indicate 30 different gain values and the 𝑆 value variation, respectively. In part (b) of this figure, 30 different gain values and the gradient of 𝑆 value are indicated by the horizontal and vertical axes, respectively. Figure 4 exhibits the flowchart of the proposed method.
4. IMAGE QUALITY ASSESSMENT
The subjective and objective methods are two types of image quality assessment (IQA). In subjective approaches, human beings evaluate the quality of images.
(a)
(b)
Figure 3. (a) The values of 𝑆 for various gain factors and (b)
its gradient
Figure 4. The flowchart of our proposed method
But they are expensive and time consuming methods. So in practice, subjective approaches are not suitable for IQA [14, 15]. Whereas the objective IQA are numerical measures. The purpose of these measures are determining the quality of images as closely as to the subjective assessment [15]. One of the objective IQA measures is Pratt’s Figure Of Merit (FOM) [16-18]. This measure is defined as Equation (5):
𝐹𝑂𝑀 = 1
𝑚𝑎𝑥 {𝑁̂,𝑁𝑜𝑟𝑖𝑔𝑖𝑛𝑎𝑙} ∑
1 1+𝑑𝑖2 𝛼
𝑁̂
𝑖=1 (5)
In this equation, 𝑁̂ is the number of detected edge pixels, 𝑁𝑜𝑟𝑖𝑔𝑖𝑛𝑎𝑙 is the number of reference edge pixels, 𝑑𝑖 is the Euclidean distance between the 𝑖th detected edge pixel and the nearest reference edge pixel and 𝛼 is a constant that usually is set as 1
9 .
Indeed, this measure is based on the edge similarity between two images. The output of this measure is a value in the interval [0-1]. The bigger value of this measure represents the more similarity between the two images.
The human visual system is well matched to structural information of images [19, 20]. Hence, the structural similarity metric (SSIM) [19] are used to assess image quality. Indeed, SSIM is another objective measure to assess image quality as closely as human visual system. By assuming 𝑥 and 𝑦 as a reference image and a test image, respectively, the similarity between 𝑥 and 𝑦 is defined as Equation (6) [19]:
𝑆𝑆𝐼𝑀(𝑥, 𝑦)= (𝑙(𝑥, 𝑦))𝛼× (𝑐(𝑥, 𝑦))𝛽× (𝑠(𝑥, 𝑦))𝛾 =(𝑥̅)22𝑥̅𝑦̅+𝑐1+(𝑦̅)2+𝑐1 ×
2𝜎𝑥𝜎𝑦+𝑐2
𝜎𝑥2+ 𝜎𝑦2+𝑐2×
𝜎𝑥𝑦+𝑐3
𝜎𝑥 𝜎𝑦+𝑐3
The luminance similarity, contrast similarity and the degree of linear correlation between 𝑥 and 𝑦, are determined by 𝑙(𝑥, 𝑦), 𝑐(𝑥, 𝑦) and 𝑠(𝑥, 𝑦) respectively.
𝛼, 𝛽 and 𝛾 are positive parameters to adjust the influence of relative functions. For simplicity of the SSIM equation, these parameters are considered as 1.
𝑐1, 𝑐2 and 𝑐3 are small positive constants which are used for avoiding the unstable results when ((𝑥̅)2+
(𝑦̅)2), (𝜎
𝑥2+ 𝜎𝑦2) or (𝜎𝑥 𝜎𝑦) is close to zero. Even by
setting the 𝑐1, 𝑐2 and 𝑐3 as zero, SSIM provides the acceptable performance.
where:
𝑥̅ =1𝑁∑𝑁𝑖=1𝑥𝑖 (7)
𝑦̅ =𝑁1∑𝑁𝑖=1𝑦𝑖 (8)
𝜎𝑥2= 1
𝑁−1∑ (𝑥𝑖− 𝑥̅)
2 𝑁
𝑖=1 (9)
𝜎𝑦2= 1
𝑁−1∑ (𝑦𝑖− 𝑦̅)
2 𝑁
𝑖=1 (10)
𝜎𝑥,𝑦2= 1
𝑁−1∑ (𝑥𝑖− 𝑥̅)
𝑁
𝑖=1 (𝑦𝑖− 𝑦̅) (11)
Similar to FOM, the output of SSIM is a value in the interval [0-1]. More similarity between two images is accrued by a bigger value of this measure.
5. EXPERIMENTAL RESULTS
In this paper we proposed a new adaptive un-sharp masking based on gradient variation. Our proposed method can be applied to color images. The HSV (Hue Saturation Value) color model is adopted in processing color images. In this model, the H channel describes the pure color, the S channel represents the degree of pure color which is diluted by white light, and the V channel depicts colorless intensity; V channel is an important component to describe color sensation [21]. So, in practice, this channel is only processed with the proposed method. Then the HSV color model with the modified V is transformed into the RGB color model. Subjective and objective IQA are used to evaluate the performance of our proposed method. We also compare the results of the proposed method with the classic un-sharp masking method and the method proposed in the literature [13].
Three blur images are used for subjective and objective evaluation. These images are selected from CSIQ database [22]. This database includes 30 reference images. Different amounts of gaussian blurriness are applied to each of the reference images.
So, this database includes various blurred images with different level of blurriness from level 1 to 5.
Figures 5 to 7 illustrate three instance results of the proposed method in comparison with the results obtained using the classic un-sharp masking method, as well as, the method proposed elsewhere [13]. As it is shown in these figures, the enhanced images using the proposed method are more visually pleasing; while the classic un-sharp masking method and the proposed method [13] cause an over sharpening. Hence, in practice these methods decrease the quality of the image. Objective evaluation represents that our proposed method provides a better FOM and SSIM values than the classic un-sharp masking method and the method proposed by Lin et al. [13].
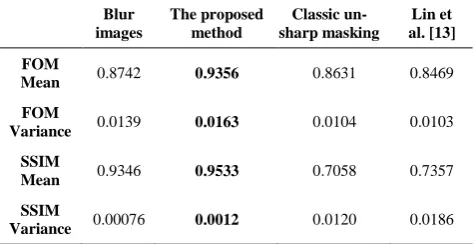
As mentioned before, each of the CSIQ reference images is blurred with five different levels of blurriness. From level 1 to 5, the blurriness of images is increased. By increasing the blurriness of images, the degradation in high frequency components (edges) is increased. In the blurred images of levels 4 and 5, the amount of degradation in edges is very high, and in practice these images have no significant edges. Besides, the un-sharp masking methods are based on extracting the edges of images; hence, these methods cannot overcome the blurriness of images in levels 4 and 5. Hence, we have applied our proposed method, classic un-sharp masking method and the method proposed elsewhere [13], to all of the blurred images in levels 1, 2 and 3 (90 different blurred images). The mean and variance of FOM and SSIM which are obtained from these methods are shown in Table 1.
As it is shown in Table 1, the FOM means and SSIM means of these three methods have significant difference. Indeed, the over sharpening problem in classic un-sharp masking method and the method proposed by Lin et al. [13] decreases the mean values of FOMs and SSIMs in these methods. It is clear that the mean of SSIM and the mean of FOM for our proposed method outperform the classic un-sharp masking method and the method proposed by Lin et al. [13].
TABLE 1. Summary of FOM and SSIM results
Blur images The proposed method Classic un-sharp masking Lin et al. [13] FOM
Mean 0.8742 0.9356 0.8631 0.8469
FOM
Variance 0.0139 0.0163 0.0104 0.0103
SSIM
Mean 0.9346 0.9533 0.7058 0.7357
SSIM
(a) Reference image (b) Blur image; FOM = 0.9271; SSIM = 0.9697
(c) Enhanced image by our proposed method; FOM = 0.9677; SSIM = 0.9787
(d) Enhanced image by classic un-sharp masking; FOM = 0.8660; SSIM = 0.7141
(e) Enhanced image by proposed method [13]; FOM = 0.8160; SSIM = 0.0.7038
Figure 5. Comparison between the proposed method, classic un-sharp masking and the method proposed by Lin et al. [13]
(subjective and objective quality assessment, Sample 1)
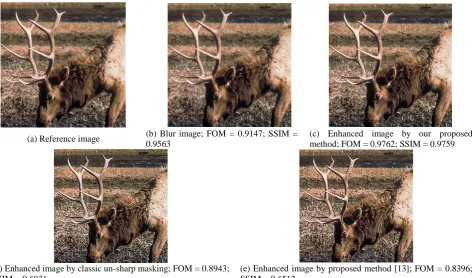
(a) Reference image (b) Blur image; FOM = 0.9147; SSIM = 0.9563
(c) Enhanced image by our proposed method; FOM = 0.9762; SSIM = 0.9759
(d) Enhanced image by classic un-sharp masking; FOM = 0.8943; SSIM = 0.6931
(e) Enhanced image by proposed method [13]; FOM = 0.8396; SSIM = 0.6512
Figure 6. Comparison between the proposed method, classic un-sharp masking and the method proposed by Lin et al. [13]
(a) Reference image (b) Blur image; FOM = 0.9014; SSIM = 0.8911
(c) Enhanced image by our proposed method; FOM = 0.9816; SSIM = .0.9785
(d) Enhanced image by classic un-sharp masking; FOM = 0.8452; SSIM = 0.7147
(e) Enhanced image by proposed method [13]; FOM = 0.8569; SSIM = 0.7295
Figure 7. Comparison between the proposed method, classic un-sharp masking and the method proposed by Lin et al. [13]
(subjective and objective quality assessment, Sample 3)
6. CONCLUSION
In this paper, an adaptive un-sharp masking method was proposed to enhance blur images. Indeed, the purpose of this method was determination of the gain factor proportional to the different qualities of the input images. Our proposed method was based on the gradient variation of the input image and the image under enhancing. This method was compared with the classic sharp masking method and a recently developed un-sharp masking method. The subjective and objective results show that the proposed method has a better performance in comparison to the other existing methods.
7. REFERENCES
1. Archana, J.N. and Aishwarya, .P., "A review on the image sharpening algorithms using unsharp masking", International
Journal of Engineering Science and Computing,Vol. 6, No. 7,
(2016), 8729-8733.
2. Cao, X., Ren, W., Zuo, W., Guo, X. and Foroosh, H., "Scene text deblurring using text-specific multiscale dictionaries", IEEE
Transactions on Image Processing, Vol. 24, No. 4, (2015),
1302-1314.
3. Vankawala, F., Ganatra, A. and Patel, A. "A Survey on different Image Deblurring Techniques", International Journal of
Computer Applications, Vol.116, No. 13, (2015), 15-18.
4. Xiang, S., Meng, G., Wang, Y., Pan, C. and Zhang, C., "Image deblurring with coupled dictionary learning.", International
Journal of Computer Vision,Vol.114, No. 2-3, (2015),
248-271.
5. Ehsaeyan, E., "A ROBUST IMAGE DENOISING TECHNIQUE IN THE CONTOURLET TRANSFORM DOMAIN", International Journal of Engineering-Transactions B:
Applications,Vol.28, No. 11, (2015), 1589-1596.
6. Polesel, A., Ramponi, G. and Mathews, V.J., "Image enhancement via adaptive unsharp masking", IEEE transactions on image
processing, Vol. 9, No. 3, (2000), 505-510.
7. Jane, O. and Ilk, H.G., "Priority and significance analysis of selecting threshold values in Adaptive Unsharp Masking for infrared images", IEEE International Conference on
Microwave Techniques (COMITE), (2010), 9-12.
8. Zaafouri, A., Sayadi, M. and Fnaiech, F., "A developed unsharp masking method for images contrast enhancement", IEEE
International Multi-Conference on Systems, Signals and
Devices (SSD), (2011) 1-6.
9. Ying, L., Ming, N.T. and Keat, L.B., "A wavelet based image sharpening algorithm", IEEE International Conference on
Computer Science and Software Engineering, vol. 1, (2008),
1053-1056.
10. Chitwong, S., Phahonyothing, S., Nilas, P. and Cheevasuvit, F., "Contrast enhancement of satellite image based on adaptive unsharp masking using wavelet transform", In ASPRS 2006
11. Mai, C.L.D.A., Nguyen, M.T.T. and Kwok, N.M., "A modified unsharp masking method using particle swarm optimization",
IEEE International Congress onImage and Signal Processing
(CISP), Vol. 2, (2011), 646-650.
12. Kwok, N. and Shi, H., "Design of unsharp masking filter kernel and gain using particle swarm optimization", IEEE
International Congress on Image and Signal Processing
(CISP), (2014), 217-222.
13. Lin, S.C.F., Wong, C.Y., Jiang, G., Rahman, M.A., Ren, T.R., Kwok, N., Shi, H., Yu, Y.H. and Wu, T., "Intensity and edge based adaptive unsharp masking filter for color image enhancement", Optik-International Journal for Light and
Electron Optics, Vol. 127, No. 1, (2016), 407-414.
14. Wang, Z. and Bovik, A.C., "Modern image quality assessment", Synthesis Lectures on Image, Video, and Multimedia
Processing, Vol. 2, No. 1, (2006), 1-156.
15. Asadi Amiri, S. and Hassanpour, H., "A preprocessing approach for image analysis using gamma correction", International
Journal of Computer Applications (0975 – 8887), Vol. 38, No.
12, (2012), 38-46.
16. Pratt, W. K. "Digital Image Processing", Wiley, New York, (1978).
17. Mastriani, M., "New wavelet-based superresolution algorithm for speckle reduction in SAR images", Computer Vision and
Pattern Recognition, (2016).
18. Yu, Y. and Acton, S.T., "Speckle reducing anisotropic diffusion",
IEEE Transactions on image processing, Vol. 11, No. 11,
(2002), 1260-1270.
19. Wang, Z., Bovik, A.C., Sheikh, H.R. and Simoncelli, E.P., "Image quality assessment: from error visibility to structural similarity",
IEEE transactions on image processing, Vol. 13, No. 4, (2004),
600-612.
20. Li, C. and Bovik, A.C., "Content-partitioned structural similarity index for image quality assessment", Signal Processing: Image
Communication, Vol. 25, No. 7, (2010), 517-526.
21. Zhang, M., Zou, F. and Zheng, J., "The linear transformation image enhancement algorithm based on HSV color space", International Conference on Intelligent Information Hiding
and Multimedia Signal Processing,Vol. 2, (2017), 19-27.
22. Larson, E.C. and Chandler, D.M., "Most apparent distortion: full-reference image quality assessment and the role of strategy",
Journal of Electronic Imaging, Vol. 19, No. 1, (2010),
011006-1 - 0011006-1011006-1006-2011006-1.
Image Enhancement Using an Adaptive Un-sharp Masking Method Considering the
Gradient Variation
Z. Mortezaiea, H. Hassanpoura, S. Asadi Amirib
a Department of Computer Engineering, Shahrood University of Technology, Shahrood, Iran b Department of Engineering and Technology, University of Mazandaran, Babolsar, Iran
P A P E R I N F O
Paper history: Received 20 April 2017
Received in revised form 22 June 2017 Accepted 07 July 2017
Keywords: Un-sharp Masking Blur Image Image Gradient Image Enhancement
ديكچ ه
تیدودحم یبارخ لاومعم یکینیکت یاه یم داجیا هدش تبث ریواصت رد ییاه
عاونا زا یکی ریوصت تسارتنک شهاک هک دننک
یبارخ نیا ،اهراکهار نیا نایم رد .دراد دوجو یفلتخم یاهراکهار ،ریوصت تسارتنک دوبهب یارب .تساه ریغ کسام شور
هب زیت هدایپ رد یگداس تلع بیرض مان هب یمهم رتماراپ یاراد شور نیا .تسا یرتشیب تیبوبحم یاراد ،تابساحم و یزاس
یم ریثات هتفایدوبهب ریوصت تیفیک رد بیرض نیا هک تسا تیوقت یفقو زیت ریغ کسام شور کی هلاقم نیا رد .دراذگ
ت یارب شور نیا رد .تسا هدش داهنشیپ یم هدافتسا ریوصت نایدارگ تارییغت زا ،تیوقت بیرض نیمخ
نایدارگ تارییغت .دوش
یم مهارف ریوصت تسارتنک هرابرد یتاعلاطا ،ریوصت شور درکلمع هسیاقم یارب یمک و یفیک یبایزرا یاهرایعم .دنک
هب زیت ریغ کسام دیدج هتفای هعسوت شور و کیسلاک شور اب یداهنشیپ سررب .تسا هتفر راک
ی ناشن ،هدش ماجنا یاه
شور هب تبسن یداهنشیپ شور یرترب هدنهد .تسا زیت ریغ کسام دوجوم یاه