AUT J. Mech. Eng., 2(1) (2018) 51-60 DOI: 10.22060/mej.2017.13415.5625
A Fluid-Structure Interaction Study on Vulnerability of Different Coronary Plaques to
Blood Flow Increase During Physical Exercise
H. Afrasiab*
Mechanical Engineering Department, Babol Noshirvani University of Technology, Babol, Iran
ABSTRACT: Pathological studies have shown that coronary atherosclerotic plaques are more prone to rupture under physical exercise. In this paper, using a fully coupled fluid-structure interaction (FSI) analysis based on arbitrary Lagrangian-Eulerian (ALE) finite element method, the effect of the coronary blood flow rate increase during physical exercise on the plaque rupture risk is investigated for different plaque types. It is proved that the increase in coronary blood flow rate during physical exercise considerably increases the maximum stress in the plaque fibrous cap which can potentially lead to the plaque rupture. The issue is investigated for different plaque shapes and their vulnerability to exercise condition is compared. It is observed that the diffused plaque type which experiences the maximum stress of 187.9 kPa at rest and 544 kPa at exercise is the most critical plaque type. Because it is subjected to the highest stress in both of these conditions. However, the descending plaque type exhibits the highest susceptibility to physical activity, since its maximum stress increases from 68.9 kPa at rest to 280.5 kPa at exercise which means an increase of about 308%.
Review History:
Received: 12 September 2017 Revised: 13 October 2017 Accepted: 28 November 2017 Available Online: 12 January 2018
Keywords:
Atherosclerosis plaque rupture Physical exercise
Fluid–structure interaction analysis Finite element method
Plaque shape
51 1- Introduction
The rupture of the atherosclerotic plaque is one of the leading causes of death and severe disability worldwide [1-3]. The atheromatous plaque resulting from the gradual deposition of cholesterol and other lipids, calcium minerals and large inflammatory cells in the vascular wall, narrows the lumen of the arteries and reduces the blood flow through the vessels. However, the most dangerous damage may occur when the plaque becomes vulnerable to rupture (vulnerable plaque) [4]. Covering the plaque’s core is the fibrous cap, a protective layer of connective tissue that prevents the core’s highly thrombogenic contents from being in contact with blood. The rupture of the fibrous cap may lead to thrombus formation. This event could potentially occlude the vessel and stop the blood perfusion downstream, resulting in an acute coronary syndrome such as sudden cardiac death, heart attack, acute myocardial infarction or unstable angina.
Plaque rupture is believed to occur when a local maximum stress exceeds the strength of the fibrous cap [5-7]. There are numerous studies that have considered the effect of physical factors such as the fibrous cap thickness [8, 9], stenosis severity [10, 11], the size of plaque core [10, 12], its composition [5, 12], plaque morphology [13, 14], plaque length [15], vessel remodeling [6, 16], arterial luminal curvature and irregularity [8, 17], inflammation [18], hemodynamics [19, 20] and residual stresses [6, 21] on the mechanical stress distribution in the fibrous cap tissue.
Vulnerable plaques are also known to be more prone to rupture under physical exercise [22-24]. Exercise is considered to be the most important physiological factor that increases
myocardial oxygen demand [25]. This increased oxygen demand is principally fulfilled by augmenting coronary blood flow because, unlike skeletal muscles, oxygen extraction level by the myocardium during resting conditions is already high [25-28]. Consequently, due to the increase of coronary blood flow during exercise, the plaque is subjected to new loading conditions that change the stress field in the plaque fibrous cap.
Despite a considerable amount of research dealing with the impact of different physiological parameters on the atheromatous plaques stress condition, few (if any) computational studies regarding the effect of exercise on the plaque vulnerability are presented in the literature. While many biomechanical and biochemical factors of the circulation system change during physical exercise, it is not feasible to deal with all of them in a single study. Consequently, one of the most important factors, i.e., the increase of coronary blood flow rate is considered in the comparative study of this paper. It is hoped that this study may encourage more research to explore the physical exercise impact on the vulnerability of atherosclerotic plaques.
In order to examine the mechanical stress developed in different plaque types in rest and exercise conditions, an axisymmetric fully coupled fluid-structure interaction (FSI) model of pulsatile blood flow through a compliant stenotic artery is developed using the finite element method. A verified in-house developed finite element code, previously used e.g. in [29, 30], based on arbitrary Lagrangian-Eulerian (ALE) formulation is employed for this purpose. In this
H. Afrasiab, AUT J. Mech. Eng., 2(1) (2018) 51-60, DOI: 10.22060/mej.2017.13415.5625
code, The SUPG1 and Galerkin methods are used for spatial discretization of fluid and solid domains, respectively. Furthermore, the first order backward Euler method is employed for integration in time. The blood is assumed to be a non-Newtonian fluid and its viscous behavior is described by the Carreau model. The plaque is modeled as a homogeneous hyperelastic solid composed of the arterial wall, the lipid core, and the fibrous cap.
2- Methods
2- 1- Stenosis geometry
Having studied a group of 42 patients with a coronary stenosis in [31], Beaumont et al. concluded that the stenosis shape can be categorized into four general types – type I (protruding), type II (ascending), type III (descending), and type IV (diffused). These four general types are considered in the morphological studies of this paper and their outer profile is sketched in Fig. 1. A schematic of the simulated protruding stenosis type is also presented in Fig. 2. It is to be noted that while there is a wide variation in the plaque components, models consisting of the artery wall, lipid core, and the fibrous cap has been widely used in many articles to study the plaque behavior with acceptable accuracy [5, 6].
The arterial geometry is considered axisymmetric. The typical dimensions of the proximal third of coronary arteries where most plaque ruptures occur were selected to create the computational models [32]. These dimensions were set to be R=3 mm for the internal diameter of the artery, ta=0.5 mm for the artery wall thickness, tb=100 μm for the wall thickness behind the core and tc=60 μm for the fibrous cap thickness. This value of tc has been reported in some previous studies as the typical thickness at which fibrous caps fail [33]. The length of the stenosis is L=4R and the stenosis severity in percent of cross-sectional area is 90%.
2- 2- The blood flow governing equations
In this study, the fluid-structure interaction analysis is performed using an arbitrary Lagrangian-Eulerian approach in the framework of the finite element method. The law of conservation of momentum and the continuity equation for a viscous, incompressible flow are the Navier-Stokes equations which along with appropriate initial and boundary conditions can be written in the ALE description as [30]:
1
Streamlined upwind Petrov-Galerkin
(
)
(
)
(
)
(
)
(
( )
)
( )(
)
( )
(
)
(
)
(
)(
)
(
)
(
)
(
)
1 2 2 0 2 2 2 in 0,0 in 0,
1
in 0,
1 tr 2
,
2 1 1 1 2
on 0,
on 0,
0 in 0,
s m
f f f
X f f f f n f
s s s
s s
s s s T
s s
s
f fs
s f fs
f i p t T T T t J E E T t T T ρ µ ρ ρ Ω Ω µ µ µ µ λγ ρ σ ρ Ω σ λ µ υ µ λ υ υ υ Ω Ω − ∞ ∞ ∂ − + − + = ∂ × = × = + − + ∂ = + × ∂ = + = = + + − ∂ = ∂ × ∂ + ∂ × ∇ = Ω ×
v . v v v . v
b
.v
u . b
F E I E F
u v
.n .n = 0
. u ∇ ∇ ∇ ∇ ∇ ∇ σ σ σ b i =u (1-a)
(
)
(
)
(
)
(
)
(
( )
)
( )(
)
( )
(
)
(
)
(
)(
)
(
)
(
)
(
)
1 2 2 0 2 2 2 in 0,0 in 0,
1
in 0,
1 tr 2
,
2 1 1 1 2
on 0,
on 0,
0 in 0,
s m
f f f
X f f f f n f
s s s
s s
s s s T
s s
s
f fs
s f fs
f i p t T T T t J E E T t T T ρ µ ρ ρ Ω Ω µ µ µ µ λγ ρ σ ρ Ω σ λ µ υ µ λ υ υ υ Ω Ω − ∞ ∞ ∂ − + − + = ∂ × = × = + − + ∂ = + × ∂ = + = = + + − ∂ = ∂ × ∂ + ∂ × ∇ = Ω ×
v . v v v . v
b
.v
u . b
F E I E F
u v
.n .n = 0
. u ∇ ∇ ∇ ∇ ∇ ∇ σ σ σ b i =u (1-b) Where ρf , μf , v and p represent the fluid density, viscosity (both constant), velocity and pressure, respectively. vm is the mesh velocity and bf denotes the body force vector. The fluid
domain is specified by Ωf while the time interval of interest
is between (0,T ). X denotes the referential domain and 𝛁sv represents the symmetric part of the velocity gradient. Blood was modeled as an incompressible (ρf=1050Kg/ m3) non-Newtonian Carreau fluid with shear rate (γ;1/s) dependent viscosity:
(
)
(
)
(
)
(
)
(
( )
)
( )(
)
( )
(
)
(
)
(
)(
)
(
)
(
)
(
)
1 2 2 0 2 2 2 in 0,0 in 0,
1
in 0,
1 tr 2
,
2 1 1 1 2
on 0,
on 0,
0 in 0,
s m
f f f
X f f f f n f
s s s
s s
s s s T
s s
s
f fs
s f fs
f i p t T T T t J E E T t T T ρ µ ρ ρ Ω Ω µ µ µ µ λγ ρ σ ρ Ω σ λ µ υ µ λ υ υ υ Ω Ω − ∞ ∞ ∂ − + − + = ∂ × = × = + − + ∂ = + × ∂ = + = = + + − ∂ = ∂ × ∂ + ∂ × ∇ = Ω ×
v . v v v . v
b
.v
u . b
F E I E F
u v
.n .n = 0
. u ∇ ∇ ∇ ∇ ∇ ∇ σ σ σ b i =u (2)
where μ0=0.056 Pa.s , μ∞=0.00345 Pa.s , n=0.3568 and λ=3.313 s [11, 34].
2- 3- The tissue governing equations
The law of conservation of linear momentum for a solid continuum may be expressed as:
(
)
(
)
(
)
(
)
(
( )
)
( )(
)
( )
(
)
(
)
(
)(
)
(
)
(
)
(
)
1 2 2 0 2 2 2 in 0,0 in 0,
1
in 0,
1 tr 2
,
2 1 1 1 2
on 0,
on 0,
0 in 0,
s m
f f f
X f f f f n f
s s s
s s
s s s T
s s
s
f fs
s f fs
f i p t T T T t J E E T t T T ρ µ ρ ρ Ω Ω µ µ µ µ λγ ρ σ ρ Ω σ λ µ υ µ λ υ υ υ Ω Ω − ∞ ∞ ∂ − + − + = ∂ × = × = + − + ∂ = + × ∂ = + = = + + − ∂ = ∂ × ∂ + ∂ × ∇ = Ω ×
v . v v v . v
b
.v
u . b
F E I E F
u v
.n .n = 0
. u ∇ ∇ ∇ ∇ ∇ ∇ σ σ σ b i =u (3)
where ρs is the solid density, u represents its displacement field, whereas the body forces, like gravity or centrifugal forces, are given by vector bs . The symmetric second-order tensor σs denotes the Cauchy stress tensor and the solid domain is represented by Ωs.
Assuming an elastic behavior for artery and plaque components is a common approach in the literature [5, 13]. In order to account for the nonlinear stress/strain dependency of the atherosclerotic plaques, the Neo-Hookian hyper-elastic model is considered to be an appropriate option [35, 36]. In this model the Cauchy stress tensor is defined by [37]:
(
)
(
)
(
)
(
)
(
( )
)
( )(
)
( )
(
)
(
)
(
)(
)
(
)
(
)
(
)
1 2 2 0 2 2 2 in 0,0 in 0,
1
in 0,
1 tr 2
,
2 1 1 1 2
on 0,
on 0,
0 in 0,
s m
f f f
X f f f f n f
s s s
s s
s s s T
s s
s
f fs
s f fs
f i p t T T T t J E E T t T T ρ µ ρ ρ Ω Ω µ µ µ µ λγ ρ σ ρ Ω σ λ µ υ µ λ υ υ υ Ω Ω − ∞ ∞ ∂ − + − + = ∂ × = × = + − + ∂ = + × ∂ = + = = + + − ∂ = ∂ × ∂ + ∂ × ∇ = Ω ×
v . v v v . v
b
.v
u . b
F E I E F
u v
.n .n = 0
. u ∇ ∇ ∇ ∇ ∇ ∇ σ σ σ b i =u (4)
In this equation, F=I+𝛁us is the deformation gradient tensor, J is the Jacobian of F, and E=(1/2)(FTF - I) is the Green-St.
Venant strain tensor. λs and μs are Lame coefficients which
can be obtained from Young modulus E and Poisson’s ratio υ using following relations:
(
)
(
)
(
)
(
)
(
( )
)
( )(
)
( )
(
)
(
)
(
)(
)
(
)
(
)
(
)
1 2 2 0 2 2 2 in 0,0 in 0,
1
in 0,
1 tr 2
,
2 1 1 1 2
on 0,
on 0,
0 in 0,
s m
f f f
X f f f f n f
s s s
s s
s s s T
s s
s
f fs
s f fs
f p t T T T t J E E T t T T ρ µ ρ ρ Ω Ω µ µ µ µ λγ ρ σ ρ Ω σ λ µ υ µ λ υ υ υ Ω Ω − ∞ ∞ ∂ − + − + = ∂ × = × = + − + ∂ = + × ∂ = + = = + + − ∂ = ∂ × ∂ + ∂ × ∇ = Ω ×
v . v v v . v
b
.v
u . b
F E I E F
u v
.n .n = 0
. ∇ ∇ ∇ ∇ ∇ ∇ σ σ σ (5)
A wide range of values for elastic properties of the human tissue is reported in the literature. Some studies proposed a very stiff behavior for the tissue, e.g. E=1500 kPa in [38], while some others reported a very soft behavior, e.g. E=33 kPa in [35]. Here, an intermediate value of E=500 kPa is employed for the elastic modulus of the artery and fibrous
Fig. 1. Sketch of different plaque shapes
Fig. 2. The geometry of the protruding stenosis model
H. Afrasiab, AUT J. Mech. Eng., 2(1) (2018) 51-60, DOI: 10.22060/mej.2017.13415.5625
53 cap material. The lipid core is modeled as very soft tissue, i.e. E=1 kPa [5, 13]. The artery, cap, and lipid core are assumed to be nearly incompressible and a Poisson’s ratio of υ=0.495 is defined [5, 36, 38]. Since the artery wall is simulated as a deformable body, the developed coupled FSI model is capable of taking into account the change of the artery diameter due to the increased blood flow during exercise.
2- 4- The Fluid-structure interface conditions
The fluid-solid interface conditions consist of kinematic and dynamic constraints specified as follows on the FSI interface ∂Ωtfs [29, 30]:
(
)
(
)
(
)
(
( )
)
( )(
)
( )
(
)
(
)
(
)(
)
(
)
(
)
(
)
1 2 2 0 2 2 in 0,0 in 0,
1
in 0,
1 tr 2
,
2 1 1 1 2
on 0,
on 0,
0 in 0,
f f
f
f
n f
s s s
s s
s s s T
s s
s
f fs
s f fs
f i T T T t J E E T t T T ρ Ω Ω µ µ µ µ λγ ρ σ ρ Ω σ λ µ υ µ λ υ υ υ Ω Ω − ∞ ∞ × = × = + − + ∂ = + × ∂ = + = = + + − ∂ = ∂ × ∂ + ∂ × ∇ = Ω × b .v
u . b
F E I E F
u v
.n .n = 0
. u ∇ ∇ σ σ σ b i =u (6-a)
(
)
(
)
(
)
(
( )
)
( )(
)
( )
(
)
(
)
(
)(
)
(
)
(
)
(
)
1 2 2 0 2 2 in 0,0 in 0,
1
in 0,
1 tr 2
,
2 1 1 1 2
on 0,
on 0,
0 in 0,
f f
f
f
n f
s s s
s s
s s s T
s s
s
f fs
s f fs
f i T T T t J E E T t T T ρ Ω Ω µ µ µ µ λγ ρ σ ρ Ω σ λ µ υ µ λ υ υ υ Ω Ω − ∞ ∞ × = × = + − + ∂ = + × ∂ = + = = + + − ∂ = ∂ × ∂ + ∂ × ∇ = Ω × b .v
u . b
F E I E F
u v
.n .n = 0
. u ∇ ∇ σ σ σ b i =u (6-b) with n being the outer normal at the solid boundary.
2- 5- Mesh Motion Algorithm
In the arbitrary Lagrangian-Eulerian (ALE) approach to the fluid-structure interaction problems, a technique is needed to move the fluid mesh so that it can track the structure motion at the FSI interface. Different techniques of ALE mesh motion are presented in the literature. Here, we use an approach that is based on solving the linear elasticity equation [39]. In this approach, the equation governing the displacement of fluid mesh nodes can be written as [39]:
(
)
(
)
(
)
(
)
(
( )
)
( )(
)
( )
(
)
(
)
(
)(
)
(
)
(
)
(
)
1 2 2 0 2 2 2 in 0,0 in 0,
1
in 0,
1 tr 2
,
2 1 1 1 2
on 0,
on 0,
0 in 0,
s m
f f f
X f f f f n f
s s s
s s
s s s T
s s
s
f fs
s f fs
f i p t T T T t J E E T t T T ρ µ ρ ρ Ω Ω µ µ µ µ λγ ρ σ ρ Ω σ λ µ υ µ λ υ υ υ Ω Ω − ∞ ∞ ∂ − + − + = ∂ × = × = + − + ∂ = + × ∂ = + = = + + − ∂ = ∂ × ∂ + ∂ × ∇ = Ω ×
v . v v v . v
b
.v
u . b
F E I E F
u v
.n .n = 0
. u ∇ ∇ ∇ ∇ ∇ ∇ σ σ σ b i =u (7) where σ is the Cauchy stress tensor. For each boundary i a Dirichlet boundary condition
(
)
(
)
(
)
(
)
(
( )
)
( )(
)
( )
(
)
(
)
(
)(
)
(
)
(
)
(
)
1 2 2 0 2 2 2 in 0,0 in 0,
1
in 0,
1 tr 2
,
2 1 1 1 2
on 0,
on 0,
0 in 0,
s m
f f f
X f f f f n f
s s s
s s
s s s T
s s
s
f fs
s f fs
f i p t T T T t J E E T t T T ρ µ ρ ρ Ω Ω µ µ µ µ λγ ρ σ ρ Ω σ λ µ υ µ λ υ υ υ Ω Ω − ∞ ∞ ∂ − + − + = ∂ × = × = + − + ∂ = + × ∂ = + = = + + − ∂ = ∂ × ∂ + ∂ × ∇ = Ω ×
v . v v v . v
b
.v
u . b
F E I E F
u v
.n .n = 0
. u ∇ ∇ ∇ ∇ ∇ ∇ σ σ σ b i
=u (8)
may be given. ub is the boundary displacement vector that
is either given a priori or computed by the solid structure equations.
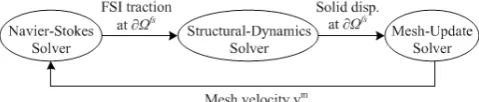
2- 6- The fluid-structure coupling method
In this work, a partitioned strong coupling approach is employed that uses a sequential iterative algorithm as illustrated in Fig. 3. This iterative scheme for the coupled system of fluid and structure is repeated in each time step until the convergence is reached, i.e., after the norms of relative change in the field variables between two consecutive iterations are smaller than the specified convergence tolerance. Field variables are the fluid pressure and velocity and the solid displacement, and the convergence tolerance was selected equal to 10-4.
2- 7- Inflow boundary condition
Presented in Fig. 4 is the realistic blood flow pattern of a left anterior descending coronary artery used in this study to simulate the inflow boundary condition of the numerical models [40].
As indicated earlier in this paper, increases in myocardial oxygen demand during exercise are met by the increases in coronary artery blood flow. Previous studies reported that the resting coronary flow velocity at 71 beats/min heart rate increases progressively during pacing to 122±16% of control value at 100 beats/min and 139±16% of control value at 120 beats/min [27]. In order to investigate the rupture risk of the atheromatous plaque, in this study, the exercise-induced flow velocity increase was applied to the inflow boundary condition of the coronary artery and the resulted maximum Von-Mises stress in the plaque was compared to its counterpart at rest.
2- 8- Mesh convergence test
An example of the employed mesh is presented in Fig. 5. Four-node quadrilateral axisymmetric elements were used to mesh the fluid and solid parts. The mesh size sensitivity was examined by conducting the mesh convergence test in each case by increasing the mesh density. For instance, the results of this test are presented in Fig. 6 for the protruding plaque type. The element number of 6990 seems to be an appropriate selection in this case.
2- 9- Model verification
In order to evaluate the accuracy of the developed methodology, a test case is considered that deals with wave propagation in a straight elastic artery due to the blood flow. In this example, the artery length is L=10 cm, its inner radius
Fig. 3. The sequential fluid–structure coupling algorithm.
Fig. 4. Flow pattern of a left anterior descending coronary artery [40]
H. Afrasiab, AUT J. Mech. Eng., 2(1) (2018) 51-60, DOI: 10.22060/mej.2017.13415.5625
is Ri=1 cm and its outer radius is Ro=1.2 cm . At t=0 a step, pressure p=5 kPa is applied at the artery inlet and wave propagation is initiated. Figure 7 compares the results of this study for outer wall displacement with results presented in [41, 42]. It can be seen that results are in a good agreement with the reference computations, such that the maximum difference between the results of this work and Refs. [40,41] is about 0.5% and 8%, respectively.
3- Results and Discussion
The exercise effect on the maximum stress induced in the protruding plaque is shown in the diagram of Fig. 8. The horizontal axis of this diagram represents the number of heartbeats which increases during exercising.
According to this figure, the stress induced in the protruding plaque increases during physical exercise. A similar behavior was also observed in other plaque shapes. It should be remarked that the stress values presented in Fig. 8 correspond to the beginning of diastole when the blood flow rate is maximum in the coronary artery. This point of time was chosen as it was observed that the highest stress occurs during the peak diastolic flow.
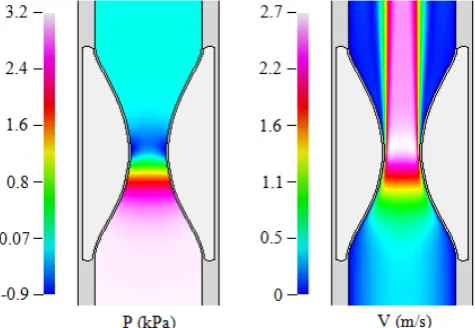
In order to better understand the physical exercise impact on the loading condition of stenotic plaques, the numerical results of the fluid domain in different values of heart rate are presented in Figs. 9 to 11 for protruding stenosis type. It can be seen that the maximum pressure drops and hence the loss of energy occurs at the highest heart rate where the blood flow is maximum.
The blood energy loss translates partly into the mechanical deformation of the plaque components, particularly the fibrous cap. Consequently, at a higher heart rate, greater energy loss contributes to a higher plaque deformation and accordingly, higher strain and stress values are expected within the plaque.
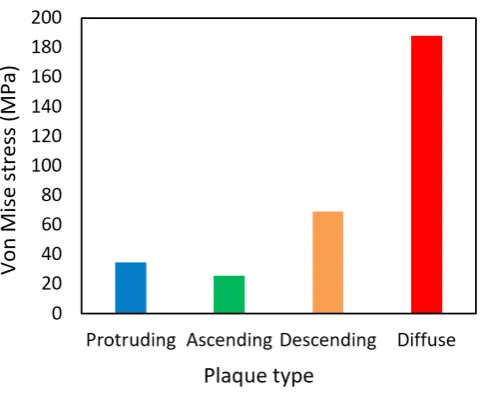
The maximum stress induced in different plaque shapes at rest and exercise condition are compared in Figs. 12 and 13. According to these figures, the diffused and ascending plaques are subjected to the maximum and minimum stresses, respectively, both at resting and exercising conditions. Considering the plaque profiles shown in Fig. 1, it can be said that the highest stress develops in plaques that have a less streamlined form.
The percentage of stress increase, defined as (σexercise - σresting)/σresting ×100, in different plaque shapes is
Fig. 6. The results of the mesh convergence test
Fig. 7. Wave propagation in an elastic artery.
Fig. 8. The exercise effect on the maximum stress produced in the protruding plaque
55 compared in the diagram of Fig. 14. This diagram indicates that the stress increase is especially notable in the descending plaque type which experiences more than 300% stress increase in the exercise condition. The diffused plaque type which undergoes the highest stresses both in resting and
exercising conditions, ranks second in terms of susceptibility to the flow rate increase due to physical activity, while the protruding stenosis is the least sensitive plaque type in this respect.
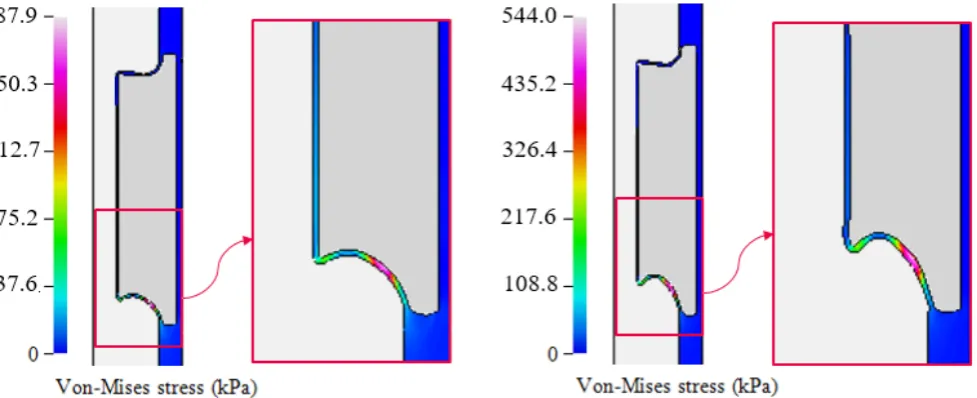
Figures 15 and 16 display the stress field of the most and least sensitive plaques in resting and exercising conditions. According to these figures, the highest Von-Mises stress occurs in the proximal shoulder zone of plaques and the site of the maximum stress is not influenced by the physical exercise. The same finding was also observed for ascending and diffused plaque types. Since in both resting and exercise conditions pressure gradient forces act directly on the proximal side of the plaque, when the plaque is displaced, the proximal shoulder areas suffer the greatest strains and consequently mechanical stresses.
The stress distribution in the ascending and diffused plaque types are also shown in Figs. (17) and (18).
Fig. 10. Flow solution at 100 beats/min heart rate
Fig. 11. Flow solution at 120 beats/min heart rate
Fig. 12. Maximum stress in different plaque types in resting condition
Fig. 13. Maximum stress in different plaque types in exercising condition
H. Afrasiab, AUT J. Mech. Eng., 2(1) (2018) 51-60, DOI: 10.22060/mej.2017.13415.5625
Fig. 15. Stress in the protruding plaque fibrous cap at rest (left) and exercise (right) conditions
Fig. 16. Stress in the descending plaque fibrous cap at rest (left) and exercise (right) conditions
57 4- Conclusion
The effect of coronary flow rate increase during physical exercise on the stress induced in different coronary plaque types was investigated using a fully-coupled fluid-structure interaction analysis based on the arbitrary Lagrangian-Eulerian finite element method. It was shown that the increase of blood flow rate and pressure during physical exercise imposes new loading conditions on the stenotic plaque causing higher deformations and accordingly higher strains and stresses in the plaque fibrous cap. The vulnerability of different plaque shapes to exercise condition was compared. It was observed that the maximum stress increase occurs in the descending plaque type, from 68.9 kPa at rest to 280.5 kPa at exercise, more than 300% stress increase in the exercise condition. The diffused plaque type which undergoes the highest stresses both in resting and exercising conditions ranks second in terms of susceptibility to physical activity. The maximum stress is 187.9 kPa at rest and 544 kPa at exercise for this plaque type. The protruding stenosis which experiences the stress of 34.5 kPa and 80.6 kPa at rest and exercise is the least sensitive plaque type. The site of the plaque maximum stress was found not to be influenced by physical exercise.
Acknowledgement
This study was encouraged by the fourth death anniversary of the late professor Mohammad Hossein Kargarnovin, a former faculty member of the Mechanical Engineering Department of the Sharif University of Technology, who lost his life due to a heart attack during a volleyball game. God bless him. Nomenclature
E Modulus of Elasticity, N/m2 L Stenosis length, mm n Outer normal p Pressure, Pa
R Internal diameter of the artery, mm t Thickness, mm
v Velocity, m/s
Greek symbols
μ Viscosity, Pa.s ρ Density, kg/m3 Ω Problem domain, m3
υ Poisson’s ratio
Subscript
a artery wall
b wall behind the core c fibrous cap
f Fluid s Solid
fs Fluid-solid interface
Subscript
f Fluid m mesh s Solid
References
[1] O.Y. Hung, A.J. Brown, S.G. Ahn, A. Veneziani, D.P. Giddens, H. Samady, Association of Wall Shear Stress with Coronary Plaque Progression and Transformation, Interventional Cardiology Clinics, 4 (2015) 491-502. [2] D.R. Obaid, P.A. Calvert, A. Brown, D. Gopalan,
N.E.J. West, J.H.F. Rudd, M.R. Bennett, Coronary CT angiography features of ruptured and high-risk atherosclerotic plaques: Correlation with intra-vascular ultrasound, Journal of Cardiovascular Computed Tomography, (2017) 42-51.
[3] T. Yonetsu, T. Lee, T. Murai, M. Suzuki, A. Matsumura, Y. Hashimoto, T. Kakuta, Plaque morphologies and the clinical prognosis of acute coronary syndrome caused by lesions with intact fibrous cap diagnosed by optical coherence tomography, International Journal of
H. Afrasiab, AUT J. Mech. Eng., 2(1) (2018) 51-60, DOI: 10.22060/mej.2017.13415.5625
Cardiology, 203 (2016) 766-774.
[4] M. Cilla, E. Peña, M.A. Martínez, 3D computational parametric analysis of eccentric atheroma plaque: influence of axial and circumferential residual stresses, Biomechanics and Modeling in Mechanobiology, 11 (2012) 1001-1013.
[5] J.R. Doherty, D.M. Dumont, G.E. Trahey, M.L. Palmeri, Acoustic radiation force impulse imaging of vulnerable plaques: a finite element method parametric analysis, Journal of Biomechanics, 46 (2013) 83-90.
[6] M. Cilla, E. Peña, M.A. Martínez, D.J. Kelly, Comparison of the vulnerability risk for positive versus negative atheroma plaque morphology, Journal of Biomechanics, 46 (2013) 1248-1254.
[7] W.J.S. Dolla, J.A. House, S.P. Marso, Stratification of risk in thin cap fibroatheromas using peak plaque stress estimates from idealized finite element models, Medical Engineering & Physics, 34 (2012) 1330-1338.
[8] Z. Teng, U. Sadat, Z. Li, X. Huang, C. Zhu, V.E. Young, M.J. Graves, J.H. Gillard, Arterial luminal curvature and fibrous-cap thickness affect critical stress conditions within atherosclerotic plaque: an in vivo MRI-based 2D finite-element study, Annals of Biomedical Engineering, 38 (2010) 3096-3101.
[9] G. Finet, J. Ohayon, G. Rioufol, Biomechanical interaction between cap thickness, lipid core composition and blood pressure in vulnerable coronary plaque: impact on stability or instability, Coronary Artery Disease, 15 (2004) 13-20.
[10] M.X. Li, J.J. Beech-Brandt, L.R. John, P.R. Hoskins, W.J. Easson, Numerical analysis of pulsatile blood flow and vessel wall mechanics in different degrees of stenoses, Journal of Biomechanics, 40 (2007) 3715-3724. [11] A. Valencia, F. Baeza, Numerical simulation of fluid– structure interaction in stenotic arteries considering two layer nonlinear anisotropic structural model, International Communications in Heat and Mass Transfer, 36 (2009) 137-142.
[12] J. Ohayon, G. Finet, A.M. Gharib, D.A. Herzka, P. Tracqui, J. Heroux, G. Rioufol, M.S. Kotys, A. Elagha, R.I. Pettigrew, Necrotic core thickness and positive arterial remodeling index: emergent biomechanical factors for evaluating the risk of plaque rupture, American Journal of Physiology. Heart and Circulatory Physiology, 295 (2008) H717-727.
[13] A.C. Akyildiz, L. Speelman, H. van Brummelen, M.A. Gutiérrez, R. Virmani, A. van der Lugt, A.F. van der Steen, J.J. Wentzel, F.J. Gijsen, Effects of intima stiffness and plaque morphology on peak cap stress, Biomedical Engineering Online, 10 (2011) 25-35.
[14] D. Tang, Z. Teng, G. Canton, T.S. Hatsukami, L. Dong, X. Huang, C. Yuan, Local critical stress correlates better than global maximum stress with plaque morphological features linked to atherosclerotic plaque vulnerability: an in vivo multi-patient study, BioMedical Engineering OnLine, 8 (2009) 15-28.
[15] T. Belzacq, S. Avril, E. Leriche, A. Delache, A numerical parametric study of the mechanical action of pulsatile blood flow onto axisymmetric stenosed arteries, Medical
Engineering & Physics, 34 (2012) 1483-1495.
[16] A.M. Varnava, P.G. Mills, M.J. Davies, Relationship between coronary artery remodeling and plaque vulnerability, Circulation, 105 (2002) 939-943.
[17] Z. Teng, U. Sadat, G. Ji, C. Zhu, V.E. Young, M.J. Graves, J.H. Gillard, Lumen irregularity dominates the relationship between mechanical stress condition, fibrous-cap thickness, and lumen curvature in carotid atherosclerotic plaque, Journal of Biomechanical Engineering, 133 (2011) 34-43.
[18] M.J. Lipinski, J.C. Frias, Z.A. Fayad, Advances in detection and characterization of atherosclerosis using contrast agents targeting the macrophage, Journal of Nuclear Cardiology, 13 (2006) 699-709.
[19] Y. Fukumoto, T. Hiro, T. Fujii, G. Hashimoto, T. Fujimura, J. Yamada, T. Okamura, M. Matsuzaki, Localized elevation of shear stress is related to coronary plaque rupture: a 3-dimensional intravascular ultrasound study with in-vivo color mapping of shear stress distribution, Journal of the American College of Cardiology, 51 (2008) 645-650.
[20] E. Cecchi, C. Giglioli, S. Valente, C. Lazzeri, G.F. Gensini, R. Abbate, L. Mannini, Role of hemodynamic shear stress in cardiovascular disease, Atherosclerosis, 214 (2011) 249-256.
[21] J. Ohayon, O. Dubreuil, P. Tracqui, S. Le Floc’h, G. Rioufol, L. Chalabreysse, F. Thivolet, R.I. Pettigrew, G. Finet, Influence of residual stress/strain on the biomechanical stability of vulnerable coronary plaques: potential impact for evaluating the risk of plaque rupture, American Journal of Physiology. Heart and Circulatory Physiology, 293 (2007) 1987-1996.
[22] S.H. Fertels, D.R. Heller, A. Maniet, A. Zalewski, Acute myocardial infarction due to exercise-induced plaque rupture, Clinical Cardiology, 21 (1998) 767-768.
[23] R.V. Kalaga, A. Malik, P.D. Thompson, Exercise-related spontaneous coronary artery dissection: case report and literature review, Medicine and Science in Sports and Exercise, 39 (2007) 1218-1220.
[24] A.P. Burke, A. Farb, G.T. Malcom, Y. Liang, J.E. Smialek, R. Virmani, Plaque rupture and sudden death related to exertion in men with coronary artery disease, JAMA, 281 (1999) 921-926.
[25] D.J. Duncker, R.J. Bache, Regulation of coronary blood flow during exercise, Physiological Reviews, 88 (2008) 1009-1086.
[26] M.H. Laughlin, R.J. Korthuis, D.J. Duncker, R.J. Bache, Control of Blood Flow to Cardiac and Skeletal Muscle During Exercise, in: Comprehensive Physiology, John Wiley & Sons, Inc., 2010.
[27] J.D. Rossen, M.D. Winniford, Effect of increases in heart rate and arterial pressure on coronary flow reserve in humans, Journal of the American College of Cardiology, 21 (1993) 343-348.
59 [29] H. Afrasiab, M.R. Movahhedy, A. Assempour, Fluid–
structure interaction analysis in microfluidic devices: A dimensionless finite element approach, International Journal for Numerical Methods in Fluids, 68 (2012) 1073-1086.
[30] H. Afrasiab, M.R. Movahhedy, Treatment of the small time instability in the finite element analysis of fluid structure interaction problems, International Journal for Numerical Methods in Fluids, 71 (2013) 756-771. [31] R. Beaumont, K. Bhaganagar, B. Segee, O. Badak,
Using fuzzy logic for morphological classification of IVUS-based plaques in diseased coronary artery in the context of flow-dynamics, Soft Computing, 14 (2010) 265-276.
[32] J.C. Wang, S.-L.T. Normand, L. Mauri, R.E. Kuntz, Coronary artery spatial distribution of acute myocardial infarction occlusions, Circulation, 110 (2004) 278-284. [33] R. Virmani, A.P. Burke, F.D. Kolodgie, A. Farb,
Vulnerable plaque: the pathology of unstable coronary lesions, Journal of Interventional Cardiology, 15 (2002) 439-446.
[34] B.C. Konala, A. Das, R.K. Banerjee, Influence of arterial wall-stenosis compliance on the coronary diagnostic parameters, Journal of Biomechanics, 44 (2011) 842-847.
[35] S.R.H. Barrett, M.P.F. Sutcliffe, S. Howarth, Z.Y. Li, J.H. Gillard, Experimental measurement of the mechanical properties of carotid atherothrombotic plaque fibrous cap, Journal of Biomechanics, 42 (2009) 1650-1655.
[36] S.A. Kock, J.V. Nygaard, N. Eldrup, E.-T. Fründ, A. Klærke, W.P. Paaske, E. Falk, W. Yong Kim, Mechanical stresses in carotid plaques using MRI-based fluid– structure interaction models, Journal of Biomechanics, 41 (2008) 1651-1658.
[37] H.G. Matthies, J. Steindorf, Partitioned strong coupling algorithms for fluid–structure interaction, Computers & Structures, 81 (2003) 805-812.
[38] A. Karimi, M. Navidbakhsh, A. Shojaei, S. Faghihi, Measurement of the uniaxial mechanical properties of healthy and atherosclerotic human coronary arteries, Materials Science & Engineering. C, Materials for Biological Applications, 33 (2013) 2550-2554.
[39] K. Stein, T. Tezduyar, R. Benney, Mesh Moving Techniques for Fluid-Structure Interactions With Large Displacements, Journal of Applied Mechanics, 70 (2003) 58-63.
[40] R.K. Stoelting, S.C. Hillier, Pharmacology and Physiology in Anesthetic Practice, Lippincott Williams & Wilkins, 2012.
[41] Y. Bazilevs, V.M. Calo, Y. Zhang, T.J.R. Hughes, Isogeometric Fluid–structure Interaction Analysis with Applications to Arterial Blood Flow, Computational Mechanics, 38 (2006) 310-322.
[42] C.J. Greenshields, H.G. Weller, A unified formulation for continuum mechanics applied to fluid–structure interaction in flexible tubes, International Journal for Numerical Methods in Engineering, 64 (2005) 1575-1593.
Pleasecitethisarticleusing:
H. Afrasiab, A Fluid-Structure Interaction Study on Vulnerability of Different Coronary Plaques to Blood Flow Increase During Physical Exercise, AUT J. Mech. Eng., 2(1) (2018) 51-60.