Http://www.ijetmr.com©International Journal of Engineering Technologies and Management Research [241]
A COMPARATIVE STUDY OF DISTRICT INDUSTRIES CENTRE
LISTED ENTREPRENEURS OF ASSAM WITH SPECIAL REFERENCE
TO JORHAT DISTRICT
Naba Kumar Das *1
*1
Research Scholar, Department of Business Administration, Tezpur University, Tezpur, Assam, India
Abstract:
This study aims to examine the trend of assorted DIC registered business enterprise in Jorhat district of Assam. Data of six financial year i.e. 2010-11 to 2015-16 are taken into consideration to measures the various aspects which are related to entrepreneurial growth and employment generation. By comprising four objectives, this study attempts to focus on various areas such as engagement of male and female entrepreneurs in manufacturing and service sector, share of various of agro and non-agro based enterprises, employment generation scenario and impact of investment in plant and machinery in annual turnover. In the study it was found that in the initial three years share of male entrepreneurs was more and from the financial year 2014-15 to 2015-16, share of female entrepreneurs increased drastically. The weightage of non-agro based business is much higher than agro-based business and ratio of annual turnover to investment in plant and machinery marginal except in the year 2012-13 which was 17:1.
Keywords: MSME; District Industries Centre; Agro and Non-Agro Based Enterprise; UAM; Manufacturing and Service Sector.
Cite This Article: Naba Kumar Das. (2018). “A COMPARATIVE STUDY OF DISTRICT INDUSTRIES CENTRE LISTED ENTREPRENEURS OF ASSAM WITH SPECIAL REFERENCE TO JORHAT DISTRICT.” International Journal of Engineering Technologies and Management Research, 5(3), 241-250. DOI: https://doi.org/10.29121/ijetmr.v5.i3.2018.197.
1. Introduction
With population of 1299.0 million and unemployment number of 44.85 million and unemployment rate of 3.46 percent (Unemployment rate, 2017), in a developing country like India it is highly needed to have skill development and employment generation programmes which will generate employment in coming years. Various govt. policy such as skill India, make India policy implemented and primarily focusing on developing entrepreneurship zeal in every nook and corner of the country. Ranking of India as compare with other nations like Spain, Turkey, Russia, Brazil, France is in comfortable position and still need to match with the developed countries like Switzerland (3.10) and Japan (2.80), (Unemployment rate, 2017).
Http://www.ijetmr.com©International Journal of Engineering Technologies and Management Research [242] contribution of Assam and other North Eastern states in total number of MSME establishment is negligible. As per the report of MSME report (2016-2017), top 10 states namely West Bengal, Uttar Pradesh, Maharashtra, Tamil Nadu, Andhra Pradesh, Kerala, Rajasthan, Gujarat, Karnataka and Madhya Pradesh accounted for 70 percent of total number of establishment as shown in table 1. Similarly the filling of Udyog Aadhar Memorandum till December 31, 2016 is one of the lowest in the country. Assam contributes 0.02 percent in total UAM fillings whereas Bihar, Uttar Pradesh and Tamil Nadu contributes 24.57, 14.22 and 10.52 percent respectively. Lion’s share of MSME sector is covered by Micro i.e. 20,03,673 enterprises followed by Small enterprises i.e.2,28,008 units. Share of medium scale enterprise is very less and it accounted only 8,781 enterprises (Annual Report 2016-17, 2017). As in India, 70% of population is directly or indirectly engaged to agricultural activities, but the distribution of agricultural and non agricultural establishments are not even. Share of non agricultural establishment is 453,63,786 which is much higher than agricultural establishment i.e. 131,31,573, clearly indicates that there in need to establish more ago based industries for value addition of the raw agro products (Annual Report 2016-17, 2017).
Table 1: Top 10 states in terms of number of MSME establishments Rank State Number of establishments Percentage of share
1 West Bengal 5269814 11.62
2 Uttar Pradesh 5238568 11.55
3 Maharashtra 4545581 10.02
4 Tamil Nadu 3282197 7.24
5 Andra Pradesh 2781291 6.13
6 Kerela 2364085 5.21
7 Rajasthan 2270936 5.01
8 Gujarat 2218464 4.89
9 Karnataka 2188860 4.83
10 Madhya Pradesh 1958550 4.32
Total 32118346 70.80
All India 45363786 100.00
Source: Data are compiled from MSME report 2016-17.
Http://www.ijetmr.com©International Journal of Engineering Technologies and Management Research [243] is positive. This paper attempts to classified various DIS listed enterprises’ in various categories such as manufacturing, service, agro and non agro based enterprises. Agro-based industries broadly classified into two categories namely food processing and non-food processing industries (Paramasivan & Pasupathi, 2016). Details classifications of agro-based industries are given below in table 2.
Table 2: Classification of agro-based industries in India Broad classification Definition
Agro-produce processing units.
Process the raw material so that it can be preserved and transported easily. Eg. Rice Mills, Dal Mills.
Agro – produce manufacturing units
Raw materials are converted to a new product. Eg: Sugar factories, Bakery, Textile Mills
Agro-inputs
manufacturing units
Include the industrial units which are engaged in the mechanization of agriculture or for increasing the agricultural productivity. Eg: seed industries, pump sets, fertilizer and pesticide industries.
Agro service center These are engaged in repairing and servicing of pump sets, diesel engines, tractors and all type of farm equipment.
Source: Secondary data.
The study is conducted with nineteen parameters i.e. employee behaviour, motivation campaigns, Subsidy given, Loan sanctioned, training conducted etc and all statements are statistically significant.
Both male and female entrepreneurs are engaged in various business units but in terms of ratio, male owned enterprise is more. Female entrepreneurs generally preferred sole proprietorship as legal form of doing business and mostly engaged in service activity (Veena & Nagaraja, 2013).
This paper aims to find out the present status and scenario of DIC4 listed enterprises in Jorhat district of Assam. Data are collected from the period of 2010-11 to 2015-16 in order to know the various dimensions and trend such as number of agro and non agro based business, ratio of male and female entrepreneurs engaged in manufacturing and service sector, employment generation scenario by various male and female owned business and lastly the comparison of investment in plant and machinery with annual turnover by male and female owned business.
1. Prime Minister’s Employment Generation Programme.
2. Unemployed Youth Employment Generation Programme
3. National Economic Empowerment Development Strategy 4. DIC4 is used in place of District Industries Center
2. Objective of the Study
1) To find out the Weightage of male and female entrepreneurs in manufacturing and service activities.
Http://www.ijetmr.com©International Journal of Engineering Technologies and Management Research [244] 3) To know the status and scenario of employment generation by male and female
entrepreneurs.
4) To find out the ratio of annual turnover with investment in plant and machinery by male and female owned businesses.
3. Research Methodology
Secondary data from District Industries Centre, Jorhat is used as a base to knows the various aspect of DIC listed enterprises. Data has been collected for the period 2010-11 to 2015-16. The same data are then grouped and regrouped to full fill the various objectives. The study primarily uses Frequency and trend analysis to figure out various findings as per the objectives. For objective one, data of the six years are compiled and regrouped to know the number of business engaged in manufacturing and service activities by male and female entrepreneurs. For objective two, data related to various business activities are categorized into two major groups i.e. agro based and non agro based business and weightage of each business is computed to know the percentage of share in the total value. For objective three and four, ratio are computed for a comparative analysis of male and female employee and to know the relation between annual turnover and investment in plant and machinery for the period of 2010 to 2016.
4. Findings and Analysis
Objective 1: To find out the weightage of male and female entrepreneurs in manufacturing and service activities.
Http://www.ijetmr.com©International Journal of Engineering Technologies and Management Research [245] Table 3: List of male and female entrepreneurs engaged in manufacturing and service activities Nature
of activity/ Year
2010-11 2011-12 2012-13 2013-14 2014-15 2015-16
Gender/ Activity Ma le Fem ale Tot al
M F T M F T M F T M F T M F T
Manufact uring
14 10 24 9 7 1 6
36 14 50 39 23 62 24 25 49 1 8
23 41
Service 18 13 31 2
1 1 5
3 6
17 15 32 16 14 30 14 27 41 1 2
69 81
Total 32 23 55 3
0 2 2
5 2
53 29 82 55 37 92 38 52 90 3 0
92 12 2
% of
change 10 0
100 10 0 9 4 9 6 9 5 16 6 12 6 14 9 17 2 16 0 16 7 11 9 22 6 16 4 9 4 40 0 22 2 Source: Data are compiled from DIC office, Jorhat.
The year 2015-16 have highest number of registered business units with 400% as compared to the year 2010-11. Share of manufacturing activity decreased from the previous year. However, there is a drastic jump in the involvement in the service activity by and female owner and out of 81 registered service enterprises, 69 are registered by women. Graphical representation of the share of male and female entrepreneurs engaged in manufacturing and service enterprise are shown in Figure 1.
Figure 1: Trends of male and female entrepreneurs in manufacturing and service activities
In figure 1 it clearly shows the trend of male and female owned manufacturing and service enterprises. Initially male owned service enterprises are dominated the trend and after this growth of business engaged in manufacturing activities increased and in the last year i.e. 2015-16 service related business increased drastically. From the year 2010-11 to 2013-14, male owned
0 20 40 60 80 100 120 140 Ma le Fe m ale To ta l
M F T M F T M F T M F T M F T
2010-11 2011-12 2012-13 2013-14 2014-15 2015-16
Manufacturing
Service
Http://www.ijetmr.com©International Journal of Engineering Technologies and Management Research [246] business enterprise was more, however from the year 2014-15, there is a tremendous growth in the female entrepreneurs mainly in the service sector.
Objective 2: To find out the Weightage of various agro and non agro based business activities by male and female entrepreneurs.
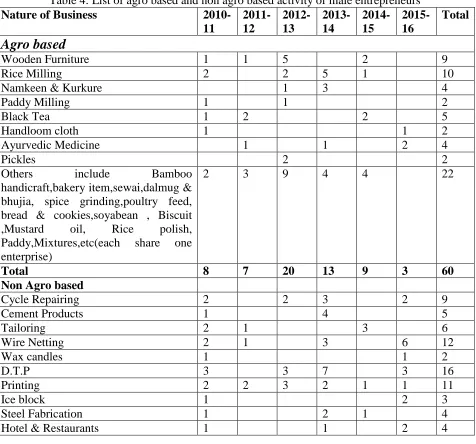
As shown in table 3, out of total 215 business enterprises owned by the male entrepreneurs, majority i.e. 155 enterprise are non agro based and 60 enterprises are agro based industries. In agro based industry, wooden furniture business have lion’s share with 17% share, followed by wooden furniture business. Wooden furniture business have 15% share and black teas business have 8% share in the agro based sector. Apart from these, others such as handicraft, bakery business, dalmug, biscuit, mustard oil poultry feed etc jointly contributed majority share i.e. 37% but individual share in the total agro based industry is negligible.
Table 4: List of agro based and non agro based activity of male entrepreneurs
Nature of Business
2010-11
2011-12
2012-13
2013-14
2014-15
2015-16
Total
Agro based
Wooden Furniture 1 1 5 2 9
Rice Milling 2 2 5 1 10
Namkeen & Kurkure 1 3 4
Paddy Milling 1 1 2
Black Tea 1 2 2 5
Handloom cloth 1 1 2
Ayurvedic Medicine 1 1 2 4
Pickles 2 2
Others include Bamboo
handicraft,bakery item,sewai,dalmug & bhujia, spice grinding,poultry feed, bread & cookies,soyabean , Biscuit ,Mustard oil, Rice polish, Paddy,Mixtures,etc(each share one enterprise)
2 3 9 4 4 22
Total 8 7 20 13 9 3 60
Non Agro based
Cycle Repairing 2 2 3 2 9
Cement Products 1 4 5
Tailoring 2 1 3 6
Wire Netting 2 1 3 6 12
Wax candles 1 1 2
D.T.P 3 3 7 3 16
Printing 2 2 3 2 1 1 11
Ice block 1 2 3
Steel Fabrication 1 2 1 4
Http://www.ijetmr.com©International Journal of Engineering Technologies and Management Research [247]
Aluminium utensils 1 2 3 6
Steel furniture & Trunk 3 1 3 7
Stone crusher 1 2 2 1 2 8
Other includes pole, ice block transport equipments, Disposable cup& plate, batteries, computer related material,Car reparing, Music Center etc
6 4 21 11 10 10 62
Total 23 12 32 40 16 32 155
Source: data are compiled from DIC, Jorhat.
In the year 2012-13, record highest number of registered agro based industry in DIC Jorhat with 34% share followed by 2013-14 with 22% share in the total agro based industry.
Majority of the enterprise i.e. approx 72% of the DIC listed enterprise are non agro based. D.T.P and printing press share majority i.e. 10% & 7% respectively in non agro based enterprises. Apart from these two, other such as steel fabrication, netting, ice block, car repairing, computer related business chare a small margin in the total value as shown in table 3. List of registered business enterprises is highest in the year 2013-14 and 2015-16 with share of 26% and 21% respectively.
Table 5: List of agro based and non agro based activity of female entrepreneurs
Nature of Business
2010-11
2011-12
2012-13
2013-14
2014-15
2015-16
Total
Agro based
Handloom cloth 5 3 4 4 31 47
Pickle Packing 2 2
Wooden furniture 1 1 1 3
Others include paddy milling, Jute bag,Biscuit shop, Food products, Atta with brand
1 1 2 1 5
Total 6 4 2 6 6 33 57
Non Agro based
Tailoring 11 6 11 19 16 12 75
Beauty parlour 2 5 20 6 33
Readymade garments 4 1 8 30 43
Others include consultant, computer related, wax candles , stone crusher, D.T.P etc
5 3 1 3 1 2 15
Total 18 9 16 28 45 50 166
Source: data are compiled from DIC Jorhat
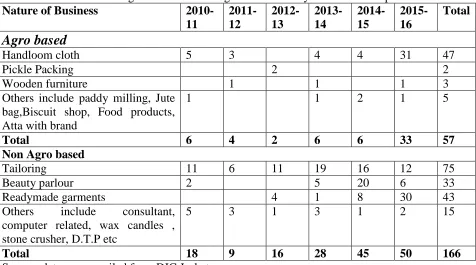
Http://www.ijetmr.com©International Journal of Engineering Technologies and Management Research [248] of agro based industry i.e. which is 26 percent is low as compare to non agro based business which is 74 percent.
In non agro based business mainly dominated by three business segment namely tailoring, beauty parlour and readymade garments contributing share of 45, 20 and 26 percent respectively as shown in table 4. In the year 2015-16 registered highest number of business enterprise with 30 percent of share in total non agro based business followed by 2014-15 which is 27 percent.
Objective 3: To know the status and scenario of employment generation by male and female entrepreneurs.
Employment generation is one of the prime objectives of DIC registered enterprise. From table 5, it is found that employment generation by male owned business for all the years are dominated by male worker only. Employment generation by the business enterprise is highest in the year 2013-14 with 491 employees and worker. The ratio of male to female worker is lowest in the year 2011-12 i.e. 2.1:1 and highest in the year 2013-14 which is 14.34:1 and this clearly indicates that although employment is generated but it is not in parallel direction towards gender.
Table 6: Employment generation scenario by male and female owned business enterprises Year 2010-11 2011-12 2012-13 2013-14 2014-15 2015-16
Male Fe M F M F M F M F M F
Male Owned enterprise 147 34 147 70 249 83 459 32 146 28 138 26 Ratio(male:female) 4.32:1 2.1:1 3:1 14.34:1 5.21:1 5.30:1 Female owned enterprise 13 44 20 65 27 67 32 72 87 34 46 62 Ratio(male:female) 0.29:1 0.30:1 0.40:1 0.44:1 2.55:1 0.74:1 Source: data are compiled from DIC Jorhat
In the year 2013-14, gender gap related to employment is very high at the ratio of 14.34:1, which indicates that against 14.34 male workers in a business enterprise only 1 female worker is there. In female owned business enterprise, except 2014-15, in all other year it is dominated by female worker. Ratio of female worker is more as compare to male worker but in the year 2014-15, the ratio turned to 2.55:1 which indicates that against 2.55 male worker the business have only one female worker.
Objective 4: To find out the ratio of annual turnover with investment in plant and machinery by male and female owned businesses.
Http://www.ijetmr.com©International Journal of Engineering Technologies and Management Research [249] Table 7: Total investment in plant and machinery and annual turnover
Year
2010-11
2011-12
2012-13
2013-14
2014-15
2015-16 Male owned enterprise (Rs. In lakhs)
Total Investment in plant & machinery
417.94 821.38 106.05 1220.25 170.61 197.86
No.of enterprenurs 32 30 53 55 38 30
Avg. Investment 13.06 27.37 2.1 22.18 4.49 6.5
Annual Production 429.10 2824.46 1757.73 2469.72 338.10 246.55
Avg. Annual productions 13.40 94.15 33.16 44.91 8.89 8.21
Ratio (Annual turnover : investment in plant & machinery)
1.02:1 3.43:1 16.57:1 2.02:1 1.98:1 1.24:1
Female owned enterprise (Rs. In lakhs) Total Investment in plant & machinery
23.67 34.63 27.89 33.36 19.04 387.9
No.of enterprenurs 23 15 29 37 52 92
Avg. Investment 1.03 2.30 0.96 0.90 0.37 4.21
Annual Production 356.88 44.47 86.99 75.17 110.45 629.35
Avg. Annual turnover 15.51 2.96 2.99 2.04 2.12 6.85
Ratio (Annual turnover : investment in plant & machinery)
15.07:1 1.28:1 3.11:1 2.25:1 5.80:1 1.62:1
Source:Data are compiled from DIC Jorhat
Investment in plant and machinery by female owned business is low as compared to male owned enterprise. Total and average investment is highest in the year Rs. 387.9 and 4.21 respectively. Total annual turnover is highest in the year 2015-16, i.e. Rs.629.35 however average annual turnover is highest in the year 2012-11 which is Rs. 15.51 lakhs. The ratio to annual production to investment is highest in the year 2010-11, which is 15.07:1. The ratio is lowest in the year 2011-12, i.e. 1.28:1, which indicates annual turnover is Rs. 1.30 against Rs. 1 investment in plant and machinery.
5. Suggestions and Conclusion
Http://www.ijetmr.com©International Journal of Engineering Technologies and Management Research [250] entrepreneurs the ratio is high in the year 2010-11 and in other year the ratio of annual turnover to investment in plant and machinery is moderate. Proper policy should be taken by state govt. to register more number of business enterprises in the DIC and provide them necessary infrastructure and services for the growth and development.
References
[1] Annual Report 2016-17. New Delhi: Ministry of Micro, Small and Medium Enterprises.
[2] DIC. (2017, November Monday). Retrieved from Government of Assam Industries and Commerce: https://industries.assam.gov.in
[3] Jayalakshmi, M., & Gayathri, S. (2016). Role of District Industries centre in the development of Micro, Small and Medium Entreprises in Virudhunagar District. International Journal of Commerce, Business and Management, 5(1), 102-113.
[4] L, B., & Sowmya, S. R. (2017). Role of District Industrial Centers in entrepreneurship development. International Journal of Science Technology and Management, 5(6), 495-500. [5] Sekar, M., & Ganesan, R. (2012). A study on SSI entrepreneur’s business performance and it's
constrains before and after registering DIC -special reference to Thoothukudi districts. International Journal of Business Management Economics research, 3(5), 614-619.
[6] Unemployment rate. (2017, October Monday). Retrieved from Trading economics: https://tradingeconomics.com/india/unemployment-rate
[7] Veena, M., & Nagaraja, N. (2013). Comparison of male and female entrepreneurs- an empirical study. International Journal of Engineering and Management Science, 3(6), 138-143.
[8] Paramasivan, C., & Pasupathi, R. (2016). Performance of agro-based industries in India. National Journal of Advanced Research, 2(6), 25-28.
*Corresponding author.