Ames Laboratory Accepted Manuscripts
Ames Laboratory
12-11-2017
Calcination does not remove all carbon from
colloidal nanocrystal assemblies
Pratyasha Mohapatra
Iowa State University, [email protected]
Santosh Shaw
Iowa State University
Deyny Mendivelso-Perez
Iowa State University and Ames Laboratory, [email protected]
Jonathan M. Bobbitt
Iowa State University and Ames Laboratory
Tiago F. Silva
Universidade de São Paulo
See next page for additional authors
Follow this and additional works at:
http://lib.dr.iastate.edu/ameslab_manuscripts
Part of the
Nanoscience and Nanotechnology Commons
, and the
Polymer and Organic Materials
Commons
This Article is brought to you for free and open access by the Ames Laboratory at Iowa State University Digital Repository. It has been accepted for inclusion in Ames Laboratory Accepted Manuscripts by an authorized administrator of Iowa State University Digital Repository. For more information, please [email protected].
Recommended Citation
Mohapatra, Pratyasha; Shaw, Santosh; Mendivelso-Perez, Deyny; Bobbitt, Jonathan M.; Silva, Tiago F.; Naab, Fabian; Yuan, Bin; Tian, Xinchun; Smith, Emily A.; and Cademartiri, Ludovico, "Calcination does not remove all carbon from colloidal nanocrystal assemblies" (2017).Ames Laboratory Accepted Manuscripts. 88.
Calcination does not remove all carbon from colloidal nanocrystal
assemblies
Abstract
Removing organics from hybrid nanostructures is a crucial step in many bottom-up materials fabrication
approaches. It is usually assumed that calcination is an effective solution to this problem, especially for thin
films. This assumption has led to its application in thousands of papers. We here show that this general
assumption is incorrect by using a relevant and highly controlled model system consisting of thin films of
ligand-capped ZrO2 nanocrystals. After calcination at 800 °C for 12 h, while Raman spectroscopy fails to
detect the ligands after calcination, elastic backscattering spectrometry characterization demonstrates that
~18% of the original carbon atoms are still present in the film. By comparison plasma processing successfully
removes the ligands. Our growth kinetic analysis shows that the calcined materials have significantly different
interfacial properties than the plasma-processed counterparts. Calcination is not a reliable strategy for the
production of single-phase all-inorganic materials from colloidal nanoparticles.
Keywords
Design, synthesis and processing, Nanoscale materials
Disciplines
Materials Science and Engineering | Nanoscience and Nanotechnology | Polymer and Organic Materials
Authors
Pratyasha Mohapatra, Santosh Shaw, Deyny Mendivelso-Perez, Jonathan M. Bobbitt, Tiago F. Silva, Fabian
Naab, Bin Yuan, Xinchun Tian, Emily A. Smith, and Ludovico Cademartiri
ARTICLE
Calcination does not remove all carbon from
colloidal nanocrystal assemblies
Pratyasha Mohapatra
1, Santosh Shaw
1, Deyny Mendivelso-Perez
2,3, Jonathan M. Bobbitt
2,3, Tiago F. Silva
4,
Fabian Naab
5, Bin Yuan
6, Xinchun Tian
1, Emily A. Smith
2,3& Ludovico Cademartiri
1,3,6Removing organics from hybrid nanostructures is a crucial step in many bottom-up materials fabrication approaches. It is usually assumed that calcination is an effective solution to this problem, especially for thinfilms. This assumption has led to its application in thousands of papers. We here show that this general assumption is incorrect by using a relevant and highly controlled model system consisting of thinfilms of ligand-capped ZrO2nanocrystals. After calcination at 800 °C for 12 h, while Raman spectroscopy fails to detect the ligands after calcination, elastic backscattering spectrometry characterization demonstrates that ~18% of the original carbon atoms are still present in the film. By comparison plasma processing successfully removes the ligands. Our growth kinetic analysis shows that the calcined materials have significantly different interfacial properties than the plasma-processed counterparts. Calcination is not a reliable strategy for the production of single-phase all-inorganic materials from colloidal nanoparticles.
DOI: 10.1038/s41467-017-02267-9 OPEN
1Department of Materials Science & Engineering, Iowa State University of Science and Technology, 2220 Hoover Hall, Ames, IA 50011, USA.2Department of
Chemistry, Iowa State University of Science and Technology, 1605 Gilman Hall, Ames, IA 50011, USA.3Ames Laboratory, US Department of Energy, Ames,
IA 50011, USA.4Instituto de Física da Universidade de São Paulo, Rua do Matão, trav. R 187, 05508-090 São Paulo, Brazil.5Michigan Ion Beam Laboratory,
University of Michigan, Draper Road, Ann Arbor, MI 48109, USA.6Department of Chemical & Biological Engineering, Iowa State University of Science and
Technology, Sweeney Hall, Ames, IA 50011, USA. Correspondence and requests for materials should be addressed to L.C. (email:[email protected]) NATURE COMMUNICATIONS|8: 2038 |DOI: 10.1038/s41467-017-02267-9|www.nature.com/naturecommunications 1
123456789
O
rganic ligands can control the growth of nanoparticles, prevent their agglomeration, and disperse them in solvents1,2. Nonetheless, they are often detrimental to the applications of colloidal nanocrystal assemblies (CNAs), espe-cially to those requiring good transport properties (e.g. charge transport in solid state devices3, solar cells4, batteries5, fuel cells6) or those that require clean inorganic interfaces and surfaces (e.g., catalysis7–9).Several methods have been used to remove organic ligands, e.g. solvent extraction, treatment with chemical stripping agents, UV-ozone treatment, calcination, and plasma processing. Each of these approaches have drawbacks: solvent extraction is generally effective on loosely adsorbed ligands and results in incomplete removal of carbon and minor grain growth7; chemical treatments are usually conducted in the liquid phase10(which typically dis-rupts colloidal assemblies due to capillary forces) and do not completely remove all ligands9,11; UV-ozone treatment leads to oxidation of nanoparticles and incomplete removal of carbon9,12; chemical oxidation by ozone leads to incomplete carbon removal (53%) and can result in oxidation13; low-temperature plasmas O2
and air plasmas can lead to oxygen implantation or surface oxi-dation14, and the process takes a comparatively long time15, even though full etching can be accomplished in 6 h with optimized processing parameters.
Calcination at high temperatures in air remains the most common approach to remove ligands from CNAs, and, in gen-eral, to remove organics from nanostructured materials9,16–23. A search of the Google Scholar database yields ~60 thousand results for the keywords“template AND calcination”. While simple, this method has several limitations: high temperatures can coarsen the nanoparticles24,25, the oxidizing atmosphere can oxidize the nanoparticles (i.e., chalcogenides, oxides of partially oxidized metals)26, and exothermic reactions and the release of volatile byproducts can crack the CNAs25.
In spite of these limitations, calcination in oxidating environ-ments is still widely used because it is equally widely assumed that it can fully remove organics from nanostructured hybrid mate-rials in a relatively short time (recent reports claim full removal in as little as 60 s8). In the best cases the assumption is tested by Raman or Fourier-transform Infrared (FT-IR) spectroscopy to show the disappearance of C–H vibrational modes8,21,27–30, thermogravimetric analysis (TGA) to show mass loss21,27,28,30,31, or energy dispersive X-ray spectroscopy (EDX) to show the dis-appearance of the carbon signal32.
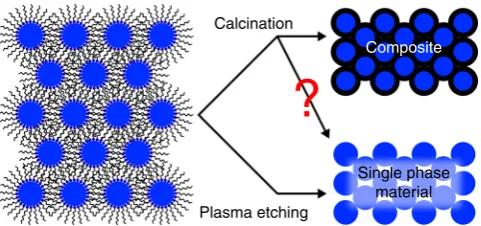
In this paper we demonstrate this assumption to be remarkably incorrect (Fig.1), at least in the case of a model system consisting of 320 nm-thick films of 2.4 nm ZrO2 nanoparticles capped
with trioctylphosphine oxide (TOPO). While Raman character-ization indeed shows the disappearance of the C–H modes upon calcination, elastic backscattering spectrometry (EBS) character-ization demonstrates that as much as 17.88% of the starting carbon atoms remains, even after calcination at 800 °C for 12 h. We compare these results with plasma etching on analogous samples which shows instead removal of 97% of the carbon atoms. Our findings suggest the troubling possibility that the calcination approaches ubiquitously used to convert hybrid nanostructures to inorganic crystalline phases (e.g., block-copolymer-templated mesoporous materials, aerogels, sol-gel coatings, inverse opals) yielded composites rather than the expected single-phase materials. It is especially troubling that the carbon phase left behind (most likely amorphous black carbon) is one of the hardest to detect reliably and quantitatively33, and yet it can severely affect properties. For example, we show here that calcined CNA displays a drastically accelerated grain growth kinetics (Ea=30 vs. 111 kJ mol−1) when compared to
plasma-processed CNAs34.
Results
Defining the model system. We chose ZrO2nanoparticles as a
model system for this study (2.4 nm ZrO2capped with TOPO, cf.
Supplementary Fig.1—the polydispersity of the particles was 19% calculated as a 95% confidence interval). This phase is a refrac-tory, which opens a wide range of calcination temperatures (300–800 °C) for study. The nanoparticles are dispersed in hexane and are stabilized in the tetragonal phase (cf. Supplementary Fig. 1b) at room temperature due to its lower surface energy than the thermodynamically stable monoclinic phase35. Spin coating of these hexane dispersions (nanoparticle concentration ~100 mg ml−1) form films (porosity ~20–25%15) that are espe-cially resistant to cracking36.
Calcination leaves carbon residue. The deposited CNAs were calcined in air (300, 400, 500 and 800 °C for 1, 3, 5 and 12 h, ramp up rate of 20 °C·min−1 and cool down rate of 2–3 °C·min−1). This choice of parameters was based on the typically reported calcination conditions for nanoparticles CNAs19,24–26. Control CNAs were exposed to oxygen plasma (7 W, 500 mTorr, 168 h) for comparison15. Optimized conditions allow for similarly effective etching in as little as 6 h.
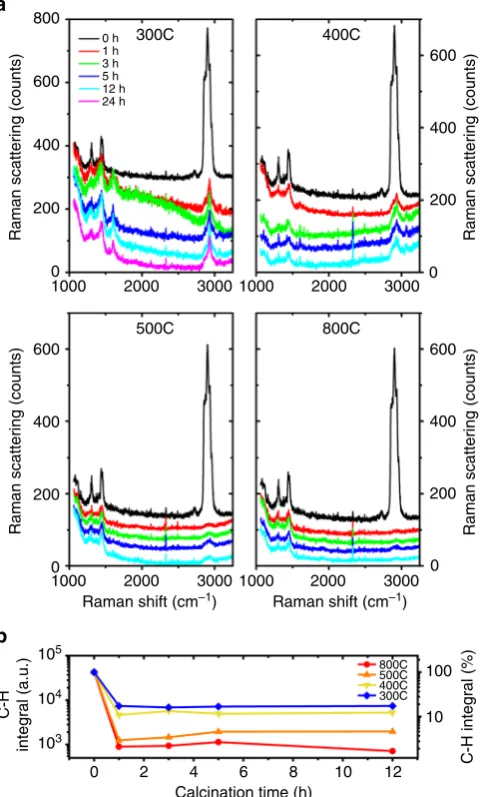
The Raman spectroscopy data from the calcined samples (Fig. 2) compared to the as-deposited films, provide an initial indication of the carbon removal. The five peaks between 2840 and 3000 cm−1in the unprocessed CNA correspond to the C–H saturated bond stretching in the TOPO ligand. The peaks at 2847 and 2882 cm−1 represent the -CH2- bond stretching modes. The
peaks at 2962 cm−1 may correspond to the -CH3 bond stretch.
The peaks between 1100 and 1500 cm−1 may indicate other carbon bond stretching and are also characteristic of the ligand37. Upon calcination, the height of the peaks between 2840 and 3000 cm−1 decreases significantly even after 1 h of calcination at 300 °C (Fig.2a). The height of the peaks decreases with increasing temperature and almost vanishes at 800 °C. The increase in the time of calcination, results in a slow reduction in the peak heights. New peaks at 1601 and 3060 cm−1appear after calcination at 300 °C and for longer times at 400 °C (Fig.2a). They might originate from decomposition intermediates which decompose or oxidize at higher temperatures.
The integral of all C–H peaks (cf. Fig.2b) shows a substantial reduction (as large as 98.3% for 800 °C, 12 h) upon calcination, especially in the first 1 h, followed by a plateau. While long calcination times do not seem to help significantly in removing the ligands, the plateau value does reduce with increasing temperatures. As the intensity of these peaks correlates with the number of -CH2- bonds, their reduction indicates the
disap-pearance of these bonds and is in fact interpreted as a direct measure of carbon etching from thinfilms8.
Calcination
Composite
Single phase material Plasma etching
Fig. 1Difference between calcination and plasma processing. Schematic of
the resulting microstructure after the ligand removal in colloidal nanoparticle assemblies (CNAs) by calcination and plasma processing
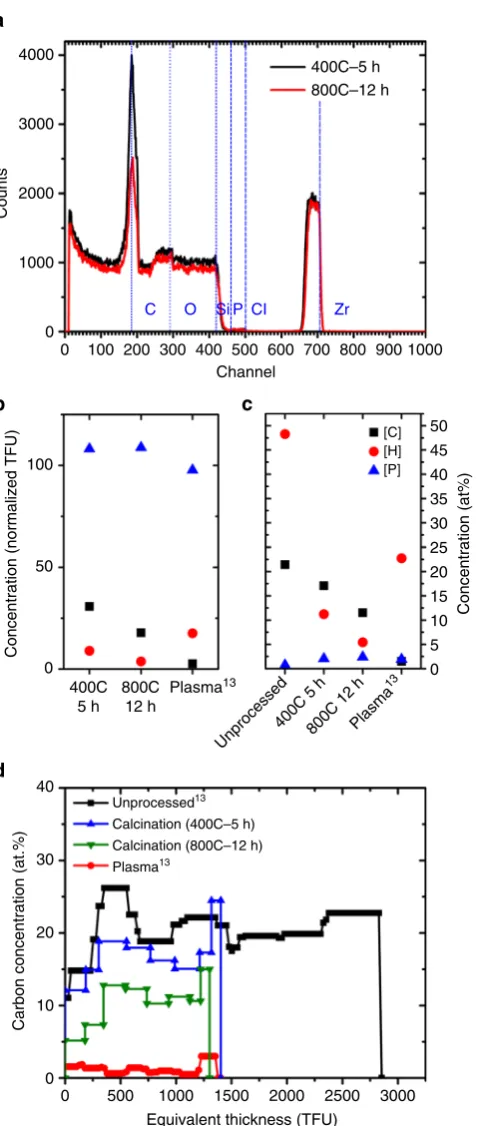
[image:4.595.308.549.49.162.2]Since most thin films are calcined at temperatures ranging between 300–700 °C for times ranging between 3 and 4 h, we conducted EBS on samples calcined at 400 °C for 5 h and 800 °C at 12 h (Fig. 3a). The data clearly show a sharp peak at the 185th channel in the calcined samples, indicating significant concentrations of carbon. The area of the carbon peak is smaller for the 800 °C sample than for the 400 °C sample, which is consistent with the Raman spectroscopy results.
EBS uses a high energy (MeV) ion beam to measure the number of atoms of each element per unit area (in thinfilm units (TFU), i.e., 1015 atoms per cm2 or at.%). For this specific measurement EBS is superior to other elemental profiling techniques like time of flight-secondary ion mass spectrometry (TOF-SIMS), X-ray photoelectron spectroscopy (XPS), X-ray
fluorescence, (XRF), EDX as it provides rapid, direct, accurate, and quantitative information on areal concentration of elements along with depth profiles, with a high sensitivity (<1 at.% detection limit for C), forfilms as thick as 500 nm38. Since EBS
detects atoms rather than bonds (like Raman spectroscopy) or structure (like X-ray diffraction (XRD)), it is more reliable in the detection of total carbon content. Rayleigh backscattering, another ion beam analysis technique, has been rarely used to look at nanocrystal superlattices39.
Figure3b, c show the EBS-derived concentrations of C, H, and P after calcination (this work) and plasma processing (data from Shaw et al.15). The plots represent the normalized TFU concentration of the elements with respect to unprocessed samples (Fig. 3b), and the atomic % (Fig. 3c). Calcination left behind 31% (400 °C, 5 h) and 18% (800 °C, 12 h) of the carbon atoms that were originally in the film. Hydrogen was instead much more severely reduced to 9 and 4% of the initial amount, respectively. Due to the effective removal of hydrogen, the concentration of carbon in the calcined samples only changes from 21 at.% to 17 at.% (400 °C, 5 h) and 12 at.% (800 °C, 12 h). A recently reported “flash” calcination approach8 was also not effective in this model system.
The difference in the etch rates for carbon and hydrogen during calcination indicates a loss of saturation of the organic fraction (the C/H ratio in the CNAs changes from 0.44 in the unprocessed film to 2.1 in the sample calcined at 800 °C), consistent with an insufficient supply of oxygen for a fully oxidative decomposition. These carbonization conditions usually yield highly crosslinked chars and black carbon that have reduced reactivity to oxygen. Ligand removal by calcination shares similarities with the thermal decomposition of polymers, during which various processes like chain scission, crosslinking, side chain elimination, and cyclization occur40. The elimination of smaller molecules also leads to the formation of bonds and crosslinking in the remaining chain. The residual crosslinked material is richer in carbon, higher in molecular weight, and is thus non-volatile. In the case of calcination, elimination of smaller hydrogenated molecules like methane, ethane, etc., through chain scission and formation of unsaturated bonds can explain the increased C:H ratio and the reduction of the C–H peaks.
Plasma processing, by comparison, reduces the number of carbon atoms by 97% (1.5 at.%). A smaller fraction of hydrogen is removed (82%), which is consistent with water adsorption. Phosphorus and zirconium (not shown) are unaffected by either treatments.
Figure3d plots the depth profile of the carbon concentration (at.%) for calcined films (this work) compared to unprocessed and plasma-processed films (data from Shaw et al.15). The thickness of the CNA films is expressed in TFUs because EBS does not consider pores. Assuming a uniform density, the TFUs can be used as a measure of the CNA thickness. The plot indicates that carbon is uniformly distributed throughout the thickness of thefilms in all the calcination and plasma processing conditions. Our data do not support the existence of a gradient, which would be expected if diffusion inside thefilm is the kinetically limiting step. The higher carbon concentration at the surface of thefilms is due to adventitious carbon.
The diffusion of oxygen within these CNAs lies in the Knudsen regime41 even at 1 atm (the Knudsen number Kn, which
represents the ratio between the molecular mean free path and the pore size, lies between 142 and 265 for temperatures between 300 and 800 °C), due to their small pore size (~ 2 nm). The diffusivity inside the CNAs is orders of magnitude lower than in air (Knudsen diffusivity is estimated between 0.8×10⁻⁷m2s−1at 300 °C and 1.2×10⁻⁷m2s−1 at 800 °C, instead of a molecular diffusivity between 0.4×10⁻⁵m2s−1at 300 °C and 1.1×10⁻⁵m2s−1 at 800 °C41), but it does not limit the ligand removal due to the small thickness of the thinfilms. If all the carbon in thefilm were volatile, it would take as little as 10−8s for it all to diffuse out at
400C 300C 800C 500C 0 h 1 h 3 h 5 h 12 h 24 h
Raman scattering (counts) Raman scattering (counts)
800
600
400
200
0
Raman scattering (counts)
C-H
integral (a.u.)
C-H integral (%)
Raman scattering (counts)
600 400 200 0 600 400 200 0 600 400 200 0 1000 2000 3000 1000 2000 3000
1000 2000 3000 1000 2000 3000
800C 500C 400C 300C Raman shift (cm–1)
103 104 105
Raman shift (cm–1)
Calcination time (h)
0 2 4 6 8 10 12
100
10
a
b
Fig. 2Effect of calcination on the C–H bond content.aRaman spectra of the
ZrO2CNAs before and after calcination at 300, 400, 500, and 800 °C for
1, 3, 5, and 12 h showing a reduction in the C–H content with increasing temperature.bThe integral of the C–H Raman peaks for unprocessed and calcined CNAs with time, at different calcination temperatures. The plot shows a sharp decrease in the C–H content in thefirst 1 h of calcination followed by a plateau, at all temperatures
NATURE COMMUNICATIONS | DOI: 10.1038/s41467-017-02267-9
ARTICLE
[image:5.595.49.290.54.453.2]298 K. These timescales are much shorter than the timescales of ligand etching or burnout in either plasma etching or calcination. Therefore, other factors are limiting the rate of ligand removal.
As will be discussed in a separate publication, the two key limitations to the etching kinetics are the chemical transformation of the organic matrix (i.e., crosslinking due to VUV radiation and reactions with radicals), and the formation of a boundary layer at the surface of the coating. The first mechanism is suggested on the basis of the observation that the rate of etching at intermediate and long etching times becomes proportional to the third power of the concentration of carbon in the film. The second mechanism is suggested on the basis of the accelerated rate of etching observed in the presence of pressure oscillations in the plasma chamber (as described by Cima and coworkers in the early 90s42).
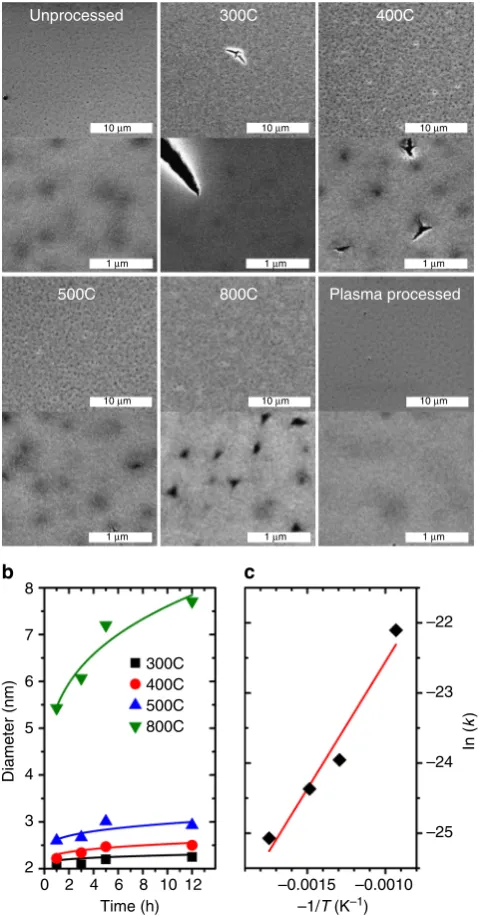
Calcination compromises the structural integrity of thefilms. One of issues of calcination is the accompanying rapid volume loss and gas formation which can damage the structure of the material25. The SEM images of the calcined films show what appear to be clefts on the surface of the films (cf. Fig. 4a). At higher temperatures, pits with extending microcracks can also be seen. Differently from previous reports25, even calcination for long periods (12 h) at temperatures (800 °C) did not cause extensive cracking in our model system. The cracks were not interconnected or intra-granular, and could therefore preserve some transport properties (like electrical conductivity) due to availability of a percolating path. The striking resistance to cracking in our films, compared to ordered CNAs, is consistent with the resistance to cracking upon plasma etching in disordered CNAs36. The plasma-processed film (Fig. 4a) is instead smooth and crack-free.
Calcinedfilms display an accelerated kinetics of grain growth. The XRD patterns of the calcined CNAs (cf. Supplementary Fig.2) shows the diffraction peak associated with tetragonal ZrO2
growing sharper with increasing temperature and time, suggest-ing coarsensuggest-ing. No new phases are evident, suggestsuggest-ing that the remaining carbon is amorphous. Raman characterization showed no graphitization. The crystallite sizes are calculated by Scherrer analysis using the general expression p¼ Kλ
b´cosðθÞwhere pis the “true size”of the crystallites (defined as cube root of the crystallite volume), K is the Scherrer constant whose value depend on crystallite shape, b is the breadth of the peak, λ is the X-ray wavelength, and θ is the diffraction angle43. The formula was corrected to account for the spherical shape of the particles (K=0.829 and diameter=(6/π)1/3·p) as discussed in a prior publication44. At all temperatures, the crystallite sizes steeply increase in the initial time periods followed by a plateau at longer times (Fig.4b).
An Ostwald ripening model45describes our experimental data better than other models46–48, while having fewer floating parameters. The model describes the growth kinetic asD(t)=D
(t=0) +k×t1/n, where t is time, D(t) is the time-dependent particle size, k is the temperature-dependent rate constant and
nis the growth parameter that indicates the rate limiting process in the growth kinetics48. The calcined samples yielded anvalue of 3.6 which is significantly different from the value reported for TOPO-capped ZrO2 nanoparticles that have been sintered only
after complete ligand removal by plasma processing (2.28±0.27)
34. This analysis suggest that the rate of diffusion of the ions at the
particle/matrix boundary regulates growth kinetics in plasma-processed samples, while the rate of dissolution of the surface atoms limits growth in calcined films. The rate constants of calcined samples show an Arrhenius dependence on temperature
Counts
4000
3000
2000
1000
0
Channel
Concentration (at%)
50
45
[C] [H] [P] 40
35
30 25 20 15
40
30
20
10
0
10 5 0
Concentration (normalized TFU)
0 100
50
Zr
400C–5 h 800C–12 h
CI P Si O C
0 100 200 300 400 500 600 700 800 900 1000
400C 5 h
800C 12 h
Unprocessed13 Calcination (400C–5 h) Calcination (800C–12 h) Plasma13
Plasma13
Unprocessed
400C 5 h800C 12 hPlasma
13
Carbon concentration (at.%)
0 500 1000 1500 2000 2500 3000 Equivalent thickness (TFU)
a
b c
d
Fig. 3Chemical characterization after calcination and plasma processing.
aNon-Rutherford elastic backscattering (EBS) spectra of the ZrO2
CNAs after calcination at 400 °C for 5 h and 800 °C for 12 h, showing significant carbon content (channel 185).bConcentration of C, H, and P in thefilms during calcination at 400 °C for 5 h, 800 °C for 12 h and plasma processing13, normalized with respect to concentration in
unprocessed CNAs.cConcentration of C, H, and P in the unprocessed films, during calcination and plasma processing13, in at%.dDepth profile of the carbon concentration (in at.%) after calcination and plasma processing13
[image:6.595.51.290.46.610.2](Fig.4c). The activation energy of grain growth of the calcined CNAs (30 kJ mol−1) is nearly four time smaller than the one measured in plasma-processed samples (111 kJ mol−134). Lower activation energies suggest earlier growth/coarsening during calcination in comparison to the plasma-processed samples. Since grain growth is a surface-dominated process, the significant reduction in the activation energy suggests a significant change in the interface composition resulting from the incomplete oxida-tion of the ligands.
While our results apply quantitatively to our model system, it is likely that qualitatively similar results occur in similarly
structured materials, with some possible exceptions, e.g., materials in which oxidative decomposition of organics is catalytically accelerated (e.g., Pt, Pd)8,28.
Methods
Particle synthesis. The synthesis of TOPO-capped ZrO2nanocrystals as described
in our earlier paper36. Eighty grams of TOPO was taken in a three-neck round bottomflask with a condenser attached to the middle neck and septa on the side necks. The TOPO was liquefied under argon and then degassed under vacuum at 80 °C for 30 mins with constant stirring. 20 mmol of zirconium (IV) chloride and 16 mmol of zirconium (IV) isopropyl alcohol complex was added to the liquefied TOPO and temperature of the mixture was raised to 340 °C under an argonflow. After holding the reaction mixture for 2.5 h at 340 °C under argon blanket, the temperature was lowered to 80 °C and then diluted with toluene in a 1:1 ratio. The nanoparticles were then cleaned with acetone by centrifugation and dispersed in hexane.
CNA deposition and processing. Spincoated CNAs were calcined in a furnace,
with static air. The heating rate was maintained at 20 °C min−1. After the
calcining time, the samples were annealed to room temperature in the furnace at ~2 °C min−1.
X-ray diffraction. Powder X-ray diffraction (XRD) was performed with Siemens
D500 X-ray diffractometer at Materials Analysis and Research Laboratory (MARL) at Iowa State University. The diffraction pattern of as-synthesized ZrO2
nano-particles was collected from drop castedfilm on a zero diffraction plate, whereas, pattern from plasma-processed sample was collected from CNA spincoated on silicon substrate. XRD patterns were collected in 2θrange 20–60° by using 0.15DS, 0.05° steps, and 3 s per step. For nanoparticle size analysis, diffraction pattern was collected in slow scan mode (0.03° steps and 20 s integration) to improve peak-to-noise ratio. Accurate measurement of nanoparticles size using Scherrer equation was done following the procedure reported44.
Raman spectroscopy. Raman spectroscopy measurements were performed using
an XploRa Plus confocal Raman microscope (Horiba Scientific/JY, France) equipped with a 532-nm laser excitation source (11 mW at the sample). Raman spectra were collected at three locations from the center of eachfilm under ambient laboratory conditions using a 50× air objective (Olympus, LMPlanFL) with a 0.5 numerical aperture. The spectra were collected from 900 to 3300 cm−1with a 1200 grooves/mm grating. Reported spectra were an average of 3 measurements, with a 120 s acquisition time for each spectrum.
Scanning electron microscopy. Scanning electron microscopy was performed
with FEI quanta 250field-emission SEM at both MARL and Department of Materials Science and Engineering at Iowa State University. Samples with poor conductivity were sputtered coated with 5 nm iridium before imaging. Imaging was done in secondary electron mode under high vacuum at 8 keV with beam spot size of 2.5.
Transmission electron microscopy/scanning transmission electron
micro-scopy. Transmission electron microscopy (TEM) and high resolution TEM images
were obtained using 2007 JEOL 2100 200 kV STEM in TEM mode, operating at 200 kV. This STEM is located at Microscopy and NanoImaging facility, Iowa State University and equipped with a Thermo Fisher Noran System 6 X-ray micro-analysis system. Samples for TEM micro-analysis were prepared by evaporating drops of dilute nanocrystals dispersion at room temperature, on a carbon-coated copper grid. Energy dispersive X-ray (EDX) analysis were performed in STEM mode. Samples for EDX characterization were prepared by scraping offflakes of CNAs from the substrate using a sharp blade, and then attaching them on a carbon-coated TEM grid.
Ion beam analysis. All ion beam analysis measurements were carried out at the
Michigan Ion Beam Laboratory49at the University of Michigan with the 1.7 MV Tandetron accelerator.
The elemental analysis of the samples throughout thefilm depth was determined by combining non-Rutherford elastic backscattering spectrometry (EBS) and elastic recoil detection (ERD) using a helium beam.
The EBS and ERD spectra were taken simultaneously at two different energies for each sample. A 3040-keV He++beam was used for sensitivity to the oxygen signal through the EBS resonance at 3038.1 keV50. Similarly, a 4290-keV He++ beam was used for sensitivity to the carbon signal through the EBS resonance at 4265 keV51.
The samples were mounted on a sample plate on the 5-axis goniometer of the 2 MV Tandem accelerator. The scattering angle of the EBS detector was 170° and of the ERD detector 30°. For each measurement the beam incident angle was 70°. Thefilter in front of the ERD detector was a 24µm thick foil of
Time (h) 300C Unprocessed
500C
300C
800C
10 µm 10 µm 10 µm
1 µm 1 µm 1 µm
10 µm 10 µm 10 µm
1 µm 1 µm 1 µm
400C
Plasma processed
400C 500C 800C
–1/T (K–1)
–0.0015
Diameter (nm)
In (
k
)
–0.0010 8
7
6
5
4
3
2
4 6 8 10 12
2 0
–22
–23
–24
–25
a
b c
Fig. 4Surface characterization and growth kinetics during calcination.
aSEM micrographs of the top surface of the unprocessed, calcined (12 h), and plasma-processedfilms. Plasma processing produces smooth films compared to calcination, which forms deep clefts, though the disordered structure of thefilm resists catastrophic cracking.bCrystallite size as a function of time at different calcination temperatures with Ostwald modelfit curves.cArrhenius plot of the rate constants of grain growth
NATURE COMMUNICATIONS | DOI: 10.1038/s41467-017-02267-9
ARTICLE
[image:7.595.48.290.62.521.2]Kapton (C22H10O5N2; density of 1.42 g cm2). The beam current on the samples
during these measurements was ~20 nA with a beam spot of 1.5 mm by 1.5 mm. The spectra evaluation followed a self-consistent approach enabled by MultiSIMNRA52that uses SIMNRA53code as engine to calculate the simulated spectra. The MultiSIMNRA code enables the combination of multiple spectra by the optimization of an objective function calculated for all spectra. Thefinal depth profile emerges from the optimization algorithm as the model that best describes all experimental data simultaneously. The main advantage of the self-consistent approach is that the information contained in one spectra plays as boundary condition during the optimization of all the others.
All simulations used the SRIM stopping power54for energy loss calculations and SigmaCalc55scattering cross-sections of Helium in Oxygen and Carbon. For some reason that stays unclear, a better agreement to the experimental data was obtained using the scattering cross-section of Helium on Silicon provided in ref.56 rather than by SigmaCalc. Andersen screening function to Rutherford cross-sections57and the empirical model by Yang for the energy loss straggling calculations58were adopted. The geometrical straggling was taken into account for all simulations, and for the ERD simulations the multiple scattering was also calculated.
Data availability. The data that support thefindings of this study are available in the article, the Supplementary Information, and from the corresponding author upon reasonable request.
Received: 23 August 2017 Accepted: 16 November 2017
References
1. Murray, C. B., Norris, D. J. & Bawendi, M. G. Synthesis and characterization of nearly monodisperse CdE (E=sulfur, selenium, tellurium) semiconductor nanocrystallites.J. Am. Chem. Soc.115, 8706–8715 (1993).
2. Cademartiri, L. & Ozin, G. A.Concepts of Nanochemistry(Wiley-VCH, 2009). 3. Talapin, D. V. & Murray, C. B. Pbse nanocrystal solids for n- and p-channel
thinfilmfield-effect transistors.Science310, 86–89 (2005).
4. Graetzel, M., Janssen, R. A. J., Mitzi, D. B. & Sargent, E. H. Materials interface engineering for solution-processed photovoltaics.Nature488, 304–312 (2012). 5. Tarascon, J.-M. & Armand, M. Issues and challenges facing rechargeable
lithium batteries.Nature414, 359–367 (2001).
6. Scherer, G. G. Interfacial aspects in the development of polymer electrolyte fuel cells.Solid State Ion.94, 249–257 (1997).
7. Lopez-Sanchez, J. A. et al. Facile removal of stabilizer-ligands from supported gold nanoparticles.Nat. Chem.3, 551–556 (2011).
8. Cargnello, M. et al. Efficient removal of organic ligands from supported nanocrystals by fast thermal annealing enables catalytic studies on well-defined active phases.J. Am. Chem. Soc.137, 6906–6911 (2015).
9. Li, D. et al. Surfactant removal for colloidal nanoparticles from solution synthesis: The effect on catalytic performance.ACS Catal.2, 1358–1362 (2012). 10. Rosen, E. L. et al. Exceptionally mild reactive stripping of native ligands from
nanocrystal surfaces by using meerwein’s salt.Angew. Chem. Int. Ed.51, 684–689 (2012).
11. Gordon, T. R. et al. Nonaqueous synthesis of TiO2nanocrystals using TiF4to
engineer morphology, oxygen vacancy concentration, and photocatalytic activity.J. Am. Chem. Soc.134, 6751–6761 (2012).
12. Aliaga, C. et al. Sum frequency generation and catalytic reaction studies of the removal of organic capping agents from Pt nanoparticles by UV−ozone treatment.J. Phys. Chem. C113, 6150–6155 (2009).
13. Elliott, E. W. III, Glover, R. D. & Hutchison, J. E. Removal of thiol ligands from surface-confined nanoparticles without particle growth or desorption.ACS Nano9, 3050–3059 (2015).
14. Cademartiri, L. et al. Nanocrystals as precursors forflexible functionalfilms.
Small1, 1184–1187 (2005).
15. Shaw, S., Colaux, J. L., Hay, J. L., Peiris, F. C. & Cademartiri, L. Building materials from colloidal nanocrystal arrays: Evolution of structure,
composition, and mechanical properties upon removal of ligands by O2plasma. Adv. Mater.28, 8900–8905 (2016).
16. Zhang, Q. et al. Self-assembly and photocatalysis of mesoporous TiO2
nanocrystal clusters.Nano Res.4, 103–114 (2011).
17. Lu, Z., Ye, M., Li, N., Zhong, W. & Yin, Y. Self-assembled TiO2nanocrystal
clusters for selective enrichment of intact phosphorylated proteins.Angew. Chem. Int. Ed.122, 1906–1910 (2010).
18. Han, L. et al. Mesoporous Fe2O3microspheres: Rapid and effective enrichment
of phosphopeptides for MALDI-TOF MS analysis.J. Colloid Interface Sci.318, 315–321 (2008).
19. Lu, Z. & Yin, Y. Colloidal nanoparticle clusters: Functional materials by design.
Chem. Soc. Rev.41, 6874–6887 (2012).
20. Ichijo, T., Sato, S. & Fujita, M. Size-, mass-, and density-controlled preparation of TiO2nanoparticles in a spherical coordination template.J. Am. Chem. Soc. 135, 6786–6789 (2013).
21. Maensiri, S., Laokul, P. & Klinkaewnarong, J. A simple synthesis and room-temperature magnetic behavior of Co-doped anatase TiO2nanoparticles. J. Magn. Magn. Mater.302, 448–453 (2006).
22. Deshpande, A. S., Pinna, N., Smarsly, B., Antonietti, M. & Niederberger, M. Controlled assembly of preformed ceria nanocrystals into highly ordered 3d nanostructures.Small1, 313–316 (2005).
23. Wu, S.-H. et al. Catalytic nano-rattle of Au@hollow silica: Towards a poison-resistant nanocatalyst.J. Mater. Chem.21, 789–794 (2011).
24. Babapour, A., Akhavan, O., Azimirad, R. & Moshfegh, A. Physical characteristics of heat-treated nano-silvers dispersed in sol–gel silica matrix.
Nanotechnology17, 763 (2006).
25. Greer, J. R. & Street, R. A. Mechanical characterization of solution-derived nanoparticle silver ink thinfilms.J. Appl. Phys.101, 103529 (2007). 26. Pehnt, M. et al. Nanocrystalline solutions as precursors to the spray deposition
of Cdte thinfilms.MRS Proc.382, 461 (1995).
27. Al-Hada, N. M. et al. A facile thermal-treatment route to synthesize the semiconductor CdO nanoparticles and effect of calcination.Mater. Sci. Semicond. Process.26, 460–466 (2014).
28. Ping, E. W. et al. On the nature of the deactivation of supported palladium nanoparticle catalysts in the decarboxylation of fatty acids.Appl. Catal. A396, 85–90 (2011).
29. Peng, T., Zhao, D., Dai, K., Shi, W. & Hirao, K. Synthesis of titanium dioxide nanoparticles with mesoporous anatase wall and high photocatalytic activity.J. Phys. Chem. B109, 4947–4952 (2005).
30. Wang, L. & Muhammed, M. Synthesis of zinc oxide nanoparticles with controlled morphology.J. Mater. Chem.9, 2871–2878 (1999).
31. Liu, Y. et al. Synthesis and high photocatalytic hydrogen production of srtio3 nanoparticles from water splitting under uv irradiation.J. Power Sources183, 701–707 (2008).
32. Vlasov, Y. A., Yao, N. & Norris, D. J. Synthesis of photonic crystals for optical wavelengths from semiconductor quantum dots.Adv. Mater.11, 165–169 (1999).
33. Lifshitz, Y. Pitfalls in amorphous carbon studies.Diamond Relat. Mater.12, 130–140 (2003).
34. Shaw, S. et al. Building materials from colloidal nanocrystal assemblies: Molecular control of solid/solid interfaces in nanostructured tetragonal zro2.
Chem. Mater.29, 7888–7900 (2017).
35. Garvie, R. C. Stabilization of the tetragonal structure in zirconia microcrystals.
J. Phys. Chem.82, 218–224 (1978).
36. Shaw, S. et al. Building materials from colloidal nanocrystal arrays: Preventing crack formation during ligand removal by controlling structure and solvation.
Adv. Mater.28, 8892–8899 (2016).
37. Doan-Nguyen, V. V., Carroll, P. J. & Murray, C. B. Structure determination and modeling of monoclinic trioctylphosphine oxide.Acta Crystallogr. C71, 239–241 (2015).
38. Jeynes, C. & Colaux, J. L. Thinfilm depth profiling by ion beam analysis.
Analyst141, 5944–5985 (2016).
39. Sun, S., Murray, C. B., Weller, D., Folks, L. & Moser, A. Monodisperse FePt nanoparticles and ferromagnetic FePt nanocrystal superlattices.Science287, 1989–1992 (2000).
40. Beyler, C. L. & Hirschler, M. M. Thermal decomposition of
polymers, InSFPE Handbook of Fire Protection EngineeringVol 2, 111–131 2002.
41. Lee, H. T. inGrowth, Diffusion, and Loss of Subsurface Ice on Mars: Experiments and models(California Institute of Technology, 2008). 42. Calvert, P. & Cima, M. Theoretical-models for binder burnout.J. Am. Ceram.
Soc.73, 575–579 (1990).
43. Langford, J. I. & Wilson, A. J. C. Sherrer after sixty years: A survey and some new results in the determination of crystallite size.J. Appl. Crystallogr.11, 102–113 (1978).
44. Cademartiri, L. et al. Size-dependent extinction coefficients of PbS quantum dots.J. Am. Chem. Soc.128, 10337–10346 (2006).
45. Voorhees, P. W. The theory of Ostwald ripening.J. Stat. Phys.38, 231–252 (1985).
46. Veshchunov, M. S. Modelling of grain growth kinetics in porous ceramic materials under normal and irradiation conditions.Materials2, 1252–1287 (2009).
47. Quach, D. V., Avila-Paredes, H., Kim, S., Martin, M. & Munir, Z. A. Pressure effects and grain growth kinetics in the consolidation of nanostructured fully stabilized zirconia by pulsed electric current sintering.Acta Mater.58, 5022–5030 (2010).
48. Huang, F., Zhang, H. Z. & Banfield, J. F. Two-stage crystal-growth kinetics observed during hydrothermal coarsening of nanocrystalline ZnS.Nano Lett.3, 373–378 (2003).
49. Naab, F. U., Toader, O. F. & Was, G. S. in23rd International Conference on the Application of Accelerators in Research and Industry-CAARI 2014Vol. 66
Physics procedia(eds B. L. Doyle et al.) 632–640 (2015).
50. Leavitt, J. A. et al. Cross-sections for 170.5-degrees backscattering of He-4 from oxygen for He-4 energies between 1.8 and 5.0 MeV.Nucl. Instrum. Methods Phys. Res. B44, 260–265 (1990).
51. Leavitt, J. A. et al. Cross-sections for 170.5-degrees backscattering of He-4 from carbon for He-4 energies between 1.6 and 5.0 MeV.Nucl. Instrum. Methods Phys. Res. B40–1, 776–779 (1989).
52. Silva, T. et al. MultiSIMNRA: a computational tool for self-consistent ion beam analysis using SIMNRA.Nucl. Instrum. Methods B371, 86–89 (2016).
53. Mayer, M. Improved physics in SIMNRA 7.Nucl. Instrum. Methods B332, 176–180 (2014).
54. Ziegler, J. F. SRIM-2003.Nucl. Instrum. Methods B219, 1027–1036 (2004). 55. Gurbich, A. Evaluated differential cross-sections for IBA.Nucl. Instrum.
Methods B268, 1703–1710 (2010).
56. Cheng, H.-S, Shen, H., Yang, F. & Tang, J.-Y. Cross sections for non-Rutherford backscattering of 4He fromfive light elements.Nucl. Instrum. Methods B85, 47–50 (1994).
57. Andersen, H., Besenbacher, F., Loftager, P. & Möller, W. Large-angle scattering of light ions in the weakly screened Rutherford region.Phys. Rev. A.21, 1891 (1980).
58. Yang, Q., O’Connor, D. & Wang, Z. Empirical formulae for energy loss straggling of ions in matter.Nucl. Instrum. Methods B61, 149–155 (1991).
Acknowledgements
The work described in this paper has been supported by the Member-Specifi c-Research-Intel program of Semiconductor Research Corporation under Award No. 2015-IN-2582. The Raman measurements were supported by the U.S. Department of Energy, Office of Basic Energy Sciences, Division of Chemical Sciences, Geosciences, and Biosciences through the Ames Laboratory. The Ames Laboratory is operated for the U.S. Department of Energy by Iowa State University under Contract No. DE-AC02-07CH11358. XCT is grateful for a scholarship from the Chinese Scholarship Council.
Author contributions
P.M., S.S., X.C.T., and B.Y. synthesized, deposited, and processed the nanoparticles and performed XRD, TEM, and SEM characterizations; D.M.P., J.B., and E.A.S. collected and interpreted Raman measurements; F.N. collected the IBA data; T.S. and F.N. analyzed the IBA data; P.M. and L.C. analyzed diffusion in the CNA and wrote the paper; L.C. designed the work.
Additional information
Supplementary Informationaccompanies this paper at https://doi.org/10.1038/s41467-017-02267-9.
Competing interests:The authors declare no competingfinancial interests.
Reprints and permissioninformation is available online athttp://npg.nature.com/ reprintsandpermissions/
Publisher's note:Springer Nature remains neutral with regard to jurisdictional claims in published maps and institutional affiliations.
Open Access This article is licensed under a Creative Commons Attribution 4.0 International License, which permits use, sharing, adaptation, distribution and reproduction in any medium or format, as long as you give appropriate credit to the original author(s) and the source, provide a link to the Creative Commons license, and indicate if changes were made. The images or other third party material in this article are included in the article’s Creative Commons license, unless indicated otherwise in a credit line to the material. If material is not included in the article’s Creative Commons license and your intended use is not permitted by statutory regulation or exceeds the permitted use, you will need to obtain permission directly from the copyright holder. To view a copy of this license, visithttp://creativecommons.org/ licenses/by/4.0/.
© The Author(s) 2017
NATURE COMMUNICATIONS | DOI: 10.1038/s41467-017-02267-9