Information Waste on the World Wide Web:
combating the clutter
Author: David Beckers
University of Twente P.O. Box 217, 7500AE EnschedeThe Netherlands
[email protected]
ABSTRACT
.
The internet has become a critical part of the infrastructure supporting
modern life. The internet’s key success factor, the vast amount of web-accessible
information, hinges on a high degree of openness and autonomy of information providers.
However, this makes the web vulnerable to inaccurate, misleading, or outdated
information. Now there is more information than ever, this unnecessary and unusable
content, which is referred to as “information waste,” takes up hardware resources and
clutters the web. In this paper, the phenomenon of information waste will be examined in
more detail by developing a definition and analyzing its causes and effects. A theoretical
framework based on semiotics is developed. Possible solutions will be explored and a
classification approach using objective metrics for information waste detection is
proposed.
Supervisors:
Fons Wijnhoven and Chintan Amrit
Keywords
Information waste, web spam, web site quality, semiotics, waste detection
Permission to make digital or hard copies of all or part of this work for personal or classroom use is granted without fee provided that copies are not made or distributed for profit or commercial advantage and that copies bear this notice and the full citation on the first page. To copy otherwise, or republish, to post on servers or to redistribute to lists, requires prior specific permission and/or a fee.
1.
INTRODUCTION
The World Wide Web is a system of hyperlinked documents accessed via the Internet. Hypertext allows the user to access and link to various kinds of information, and can be browsed at will. The original purpose of the Web was to create a single, universal, accessible hypertext medium for sharing information (Berners-Lee & Fischetti, 1999). Over the years, the World Wide Web has developed into a global information space with a multitude of autonomous information providers (Jacobs & Walsh, 2004). The creators of the web felt that central control had to be minimal because it could act as a bottleneck to growth. It had to be able to grow in an unlimited way for it to become a universal resource (Berners-Lee & Fischetti, 1999). Since the world wide web went online in 1990, it has established itself as the key infrastructure for information, administration, exchange, and publication (Alexander & Tate, 1999). Relationships are managed online, commerce increasingly takes place online, media content has moved online, and policy makers can engage the public through online channels. The Internet has moved from a structure for the delivery of data to a socio-economic structure supporting information and knowledge exchange (Oostveen et al., 2012). The web can be a powerful tool for empowering people, and significant research effort is going into making the Internet of the future a dynamic place for innovation, growth, and jobs (Oostveen et al., 2012).
The different types of material and quality of this material have been a concern for a long time. The deficiency of enforceable standards has resulted in frequent information quality problems (Eppler & Muenzenmayer, 2002). A similar point is made by Arazy & Kopak (2011, p. 89): “With less traditional gatekeeping on the ‘information production’ side, more content is obtained from sources with mixed, and sometimes dubious, provenance.” Not only the quality is a concern, the sheer amount of information is causing problems too. We appear to be in a state of “information overload” (Himma, 2007). According to Bawden & Robinson (2008, p. 183), “information overload occurs when information received becomes a hindrance rather than a help, even though the information is potentially useful.” The amount of information on the World Wide Web is increasing at an astonishing rate. The indexed web is estimated to contain roughly 5.09 billion pages as of May 6th, 2014 (de Kunder, 2014)1. Allowing 30 minutes per document, “reading” the Internet would take more than 290,000 years. With this information flood, the major task for information service providers has become one of filtering and selecting information rather than finding enough appropriate material (Bawden & Robinson, 2008).
This paper will focus on an under-researched topic within information management, namely information waste. “Information waste is information which is unnecessary (e.g. redundant) and unusable (e.g. not understandable) and which are the consequences of human limitations of knowing which data are of no use and could thus be removed or stored on a non-direct access medium (F Wijnhoven, Dietz, & Amrit, 2012, p. 135).” Information waste in the context of the World Wide Web is pertinent, given the multitude of quality concerns and the rapidly expanding amount of information. The information flood challenges internet users with an abundance and redundancy of web resources, which makes it difficult to optimize search, identify dependable sources, or obtain factual information from the clutter (Langford, 2010). Furthermore, there might be harm in relying on poor information as this may
1http://www.worldwidewebsize.com/
have an impact on decision-making processes, personal knowledge, and reference materials (Kelton, Fleischmann, & Wallace, 2008). Information waste unnecessarily takes up hardware and cognitive resources. Being able to filter out or eliminate a significant portion of information waste will alleviate the “information overload” we are faced with as well as providing us with more reliable and trustworthy information. Moreover, less hardware resources will need to be used, which has environmental benefits and potentially reduces the operational costs of the internet (F Wijnhoven et al., 2012). In this paper, two key questions are posed: (1) what is information waste? and (2) what are the effects of information waste on the internet? In addition, a detection approach employing objective user data will be proposed.
2.
THE CONCEPT OF INFORMATION
WASTE
Because information waste is relatively new research area, existing definitions are scarce. The concept of information waste will be deconstructed to get a fundamental understanding of the topic. The first component to be defined is information. Himma (2007), providing a philosophical explication, sees information as the following: “Information, as we typically use the term, is related to the act of ‘informing’ or the condition of ‘being informed’ and hence picks out a certain kind of propositional content – i.e., content capable of being either true or false.” More widespread, simpler definitions of information are “meaningful data” or “meaningful representations” (Floridi, 2005). “Waste,” on the other hand essentially has two meanings in the English language (Hornsby, 2003): (1) unwanted matter or material of any type, especially what is left after use; (2) a bad use of something valuable that you have only a limited amount of. “Information waste” is consequently defined as data which are unnecessary and unusable resulting from human limitations in judging which data could be removed or archived (F Wijnhoven et al., 2012). The second viewpoint on waste is provided by Hicks (2007), describing waste as the additional actions and any inactivity that arises because the information consumer is not provided with immediate access to appropriate, accurate, and up-to-date information.
A very prevalent form of information waste on the internet is a phenomenon known as web spam. Araujo & Martinez-Romo (2010, p. 1556) state that “Web spam, or spamdexing, includes all techniques used for the purpose of getting an undeservedly high rank.” As a large and increasing portion of traffic to web sites comes from search engine referrals, getting a high rank is crucial for web sites to be found by their intended audience. There are ethical ways of boosting a web page’s ranking by improving the appearance of content, as well as making it easier for web crawlers to index content. Moreover, making the web page more useful to potential visitors also boosts a page’s search engine ranking. Unfortunately, it has become common practice to craft pages for the sole purpose of increasing search engine rankings without improving the utility of the pages (Ntoulas, Najork, Manasse, & Fetterly, 2006). The most common web spam techniques include the artificial generation of content or keywords, cloaking, redirection spam, and link farms (Prieto, Álvarez, & Cacheda, 2013). Web spam severely pollutes search engines, leading to less relevant results. This is a major problem for site owners and search engine users because misleading and meaningless spam pages obtain high page rankings.
prevalence of information systems and the rise in popularity of the World Wide Web. Low-quality information could be considered information waste because it will be unusable and could be considered unnecessary. Information quality has been commonly defined as the fitness for use of information (Bizer & Cyganiak, 2009). Accordingly, this implies that (1) information quality is task-dependent; and (2) information quality is subjective (Bizer & Cyganiak, 2009). This task-dependence is also supported by Arazy & Kopak (2011) who state that quality depends on a judgment of value to a specific purpose or use. Another important aspect of information quality is that it can be seen as a multidimensional construct. Several operationalizations identifying specific attributes have been developed within information quality research. Taylor (1986) identified five attributes of information quality: accuracy, comprehensiveness, currency, reliability, and validity. Many variants of this set of attributes have emerged in information quality research over the years. Knight & Burn (2005) collated 12 widely accepted information quality frameworks from information systems research and identified an extensive list containing 20 information quality attributes. Davis & Olson (1987) noted that information quality in terms of the perception of a decision-maker essentially has three aspects: utility of information, information satisfaction, and errors and bias. This is certainly a very useful theory since it provides both aspects pertaining to the information itself and the perception of the user.
A crucial point that has been mentioned is that information quality needs to be assessed within the context of its generation and use because the attributes of quality can vary depending on the context in which it is to be used (Knight & Burn, 2005). “What is of good quality in one situation might not be of much help in another situation (Mai, 2013, p. 686).” Quality dimensions such as relevance and usefulness are thus difficult to measure reliably due to their subjectivity (Knight & Burn, 2005). In support of this point, Arazy & Kopak (2011), who did empirical research on rating information quality attributes, found that it was difficult to reach agreement on the assessment of quality dimensions. Arazy & Kopak came to the following conclusion (2011, p. 98): “We conclude that IQ is an elusive construct that is hard to measure, and users’ quality estimates are subjective, therefore making it difficult for multiple assessors to reach an agreement on a resource’s quality.” Similarly, Mai (2013) stated that information quality is a difficult concept to quantify effectively, even though significant research effort has gone into developing objective characteristics.
Information trust was also found to be related to information quality. Trust is the intervening variable that affects the use of technology, mediating between information quality and usage (Kelton et al., 2008; Muir, 1994). Because there is a lack of standard procedures and editorial controls, it is difficult to create trust in online environments (Kelton et al., 2008). As the internet becomes more pervasive in our lives, trust in digital information becomes more important because it plays a key role in some of our decision-making processes and personal knowledge. There might even be harm in relying on poor information. According to Kelton et al. (2008), perceived trustworthiness of information or an information source can be evaluated in terms of its accuracy, objectivity, validity, and stability. This bears close resemblance to the information quality attributes described earlier. The aspect of stability, also referred to as predictability, was described as pertinent to digital information because digital information tends to be fluid and susceptible to alteration. An information source’s predictability encompasses its persistence in both presence and contents.
Taking the perspective of waste as a bad use of something valuable that you have only a limited amount of, the subject of
information overload appears. Bawden & Robinson (2008, pp. 182–183) state that “The term is usually taken to represent a state of affairs where an individual’s efficiency in using information in their work is hampered by the amount of relevant, and potentially useful, information available to them.” We have access to too much content, true and false because we lack the ability to efficiently ascertain what is true and what is not (Himma, 2007). It is not unreasonable to assert that the amount of information waste contributes significantly to the information overload problem. Attention is a scarce cognitive resource (Himma, 2007); dealing excessively with unneeded or unusable information is wasteful.
3.
THE EFFECTS OF INFORMATION
WASTE
The most clearly identifiable form of information waste, web spam, has been studied in detail and some of its effects on various constituents are well-known. Broadly speaking, the following entities suffer economic losses from web spam (Prieto et al., 2013): (a) end users can be cheated and waste their time and money; (b) owners of web pages have difficulty in reaching their audience in an ethical way; and (c) search engine providers lose prestige and waste resources. Araujo & Martinez-Romo (2010) stated that web spam is one of the main problems of search engines because it strongly degrades the quality of search results. This leads to disappointment and frustration among users when they are finding spam sites instead of legitimate search results. With regard to the financial impact of web spam, spam site operators deprive legitimate sites of revenue that they could have earned via search engine referrals (Araujo & Martinez-Romo, 2010; Ntoulas et al., 2006). Moreover, search engine operators waste significant hardware resources (network bandwidth, storage space, CPU cycles) on crawling, processing, indexing, and matching to queries (Ntoulas et al., 2006; Prieto et al., 2013). It must also be taken into consideration that combating web spam requires substantial investment in manpower and time to keep search engines usable.
the validity of information being presented can be difficult because false claims to qualification and authority can and are often made. Moreover, because frequent updates are encouraged, information is often impermanent and there is a sense of “shallow novelty” (Brabazon, 2007).
Causes of information waste are important for developing our understanding of the issue and paving a path to possible solutions. One cause of information waste is that some information providers are biased or lack knowledge and skills. Search engines have difficulty in returning relevant results because much of the useful and valuable information is obscured by content of lower quality. A user’s perception of value is not only determined by what they are seeking, but also why they are seeking it (Rose & Levinson, 2004). The same query by two different persons could have different search goals. Search engine performance could improve significantly if it could understand the intent of a query (Knight & Burn, 2005). Diversity in the nature of the information or its format can also lead to overload and subsequent confusion. Information coming from different perspectives, and with possibly conflicting advice is hard to fit into the user’s cognitive framework (D. Bawden & Robinson, 2008). Hicks (2007) emphasized an efficient, lean flow of information across an information system. He describes four fundamental causes of information waste: (1) information cannot flow because the process is inadequate; (2) information cannot flow because it cannot be identified or shared processes are incompatible; (3) excessive information is generated and maintained; (4) inaccurate information flows, resulting in inappropriate downstream activities, corrective action, or verification.
4.
THE SEMIOTIC FRAMEWORK OF
INFORMATION WASTE
A number of scholars have suggested establishing the foundations of information studies in semiotics (Mai, 2013). Semiotics (from the Greek word for sign) is the doctrine and science of signs and their use (Brier, 2005). There is a common understanding of information as signs used in communication to produce and exchange meaning (Mai, 2013). It is a more comprehensive system than language itself and can therefore be used to understand language in relation to other forms of communication and interpretation, for example, nonverbal forms (Brier, 2005). Stamper’s (1991, 1996) semiotic framework provides an important means for understanding both the physical and social dimensions of information. Information has a distinct meaning that can be assigned to it at each level of structure we give to signs. The six levels in the
semiotic framework unite the technical and social aspects of information. The semiotic framework consists of the following six layers (Stamper, 1991): (1) the physical world; (2) empirics; (3) syntactic; (4) semantics; (5) pragmatics; and (6) the social world. The full model can be found in the appendix (figure A1). Boell & Cecez-Kecmanovic (2010) reinterpreted Stamper’s (Stamper, 1991) model within the sociomaterial view of information. Their model can be found in the appendix (table A1). It is notable that they adopt the knowledge-action-perspective with regard to information. In this view, information is a specific subset of knowledge. Only what is understood by an individual can become information. The moment a message is understood, it becomes part of the individual’s knowledge. Boell & Cecez-Kecmanovic (2010) assume a continuum from the physical/empirics
to the pragmatics/social layers, which is slightly different from Stamper’s framework. Attributes closer to the physical world are more closely associated with technical solutions while attributes closer to the social world focus on information use and how they influence users’ actions.
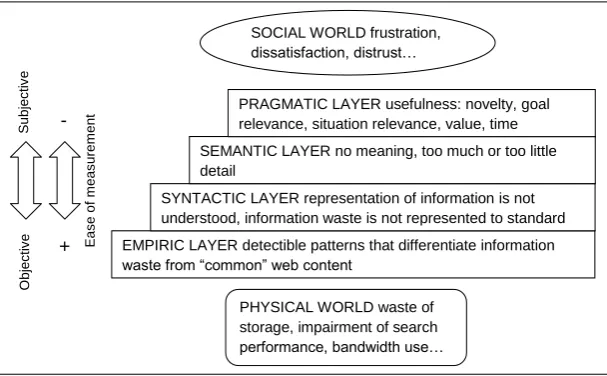
The semiotic framework of information waste (figure 1) is an extended and adapted version of the semiotic framework proposed by Stamper (1991) and the subsequent reinterpretation by Boell & Cecez-Kecmanovic (2010). The models have been adapted to get a comprehensive overview of information waste
according to the level of structure we give to signs. The physical world layer and the social world layer are shown as separate variables. The semiotic layers form steps between these two worlds and information waste is given a precise meaning according to the level of structure. Each layer contains a short description. The two arrows on the left-hand side of the model indicate the nature and associated challenges of analyzing web content at each semiotic level. Measures for determining the value and quality of a web site are objective in the lower semiotic layers, which allows programmatic evaluation by applying established heuristics. There is a relatively high ease of measurement in these lower layers.
When moving up to higher layers, measurements are harder to evaluate automatically, requiring human interpretation. In the pragmatic layer, judgments are highly dependent on personal preferences, making evaluation highly subjective. In addition, obtaining reliable computerized proxies for information quality is difficult. A small literature search within the areas of web spam and related terms was conducted to provide a selection of common detection methods at each of the layers.
4.1
Physical world layer
The physical world is the layer consisting of the physical phenomena shaping our everyday lives. Information waste affects the physical world because information needs a physical carrier and thus has physical effects. These effects are mainly the unneeded use of hardware resources and extra effort needed to sort and filter information. Unneeded and unusable web content takes up storage space which could have been used for better purposes. Also, bandwidth is wasted when bad content is (often inadvertently) accessed. The second physical effect of information waste is that a lot of effort is needed to detect bad content and maintain search engine performance. Algorithms have to be updated constantly to keep up with the stream of information waste. Heavy investment is also needed in hardware resources to cope with these demands.
SOCIAL WORLD frustration, dissatisfaction, distrust…
PHYSICAL WORLD waste of storage, impairment of search performance, bandwidth use…
EMPIRIC LAYER detectible patterns that differentiate information waste from “common” web content
SYNTACTIC LAYER representation of information is not understood, information waste is not represented to standard
SEMANTIC LAYER no meaning, too much or too little detail
PRAGMATIC LAYER usefulness: novelty, goal relevance, situation relevance, value, time dependency, trust
S
ub
jec
ti
v
e
O
bj
ec
ti
v
e Eas
e o
f m
ea
s
urem
en
t
-
[image:4.595.243.547.555.743.2]+
4.2
Empiric layer
To inform, information needs to be detectable. This requires it to be distinguishable from background noise. Information is distinguishable from background noise when patterns can be detected. If there are no distinguishable patterns, there is no message, and there will not be information. Information waste, especially web spam, follows specific patterns that differentiate it from legitimate web content. The general patterns used for web spam detection observe links, the rate of evolution of pages, and behavioral patterns. Detecting questionable websites on the basis of empiric cues has been widely researched as it can be automated and leads to consistent results.
Operational definition: Information waste follows detectable patterns that differentiate it from “common” web content.
Link patterns *(1)Abbasi & Chen (2009) , (2) Geng, Wang, Li & Zhu (2007), (3) Araujo & Martinez-Romo (2010), (4) Fetterly, Manasse, & Najork (2004)
Web graphs provide a structural signature for sites (Diligenti et al., 2000) (1).
Density of connections (to detect link farms) (2)
Number of common pages in in-links and out-links (2)
Recovery degree: number of links that were found back via a search engine to verify their quality (3)
Incoming-outgoing links (3)
External-internal links (3)
Number of broken links (3)
Various features of the host component of a URL (4)
IP addresses referred to by an excessive number of symbolic host names (4)
Outliers in the distribution of in-degrees and out-degrees of the graph induced by web pages and the hyperlinks between them (4)
Evolution patterns *(1) Shen et al. (2006), (2) Fetterly, Manasse, & Najork (2004)
Quick and drastic changes in the number of links to sites indicate link spam (1)
In-link Growth Rate (IGR) (1)
In-link Death Rate (IDR) (1)
The rate of evolution of web pages on a given site (2)
Behavioral patterns *(1) Hayati, Chai, Potdar, & Talevski (2010)
Spammers (humans and bots) repeat operations very often and create content quickly (1)
Action time and action frequency as metrics (1)
Table 1: Empiric detection methods
4.3
Syntactic layer
Syntactics observes how signs relate to other signs (Ryder, 2005), denoting the representation of information. Information needs to be represented in a certain form – a set of principles and rules. In other words, it needs to be represented using a syntax understood by the recipient. This is not limited to the syntax of natural language; it can also be the layout of a page or the scripts running on it. Syntactic attributes are widely used to detect information waste. Information waste is represented in ways that differ from the way legitimate content is displayed. The main categories for detection methods of web spam in the syntactic layer are language-based indicators, source code features (including layout), and content features. Regarding content it is worth noting that in the syntactic layer, only the representational components of the content are examined, not the meaning.
Operational definition 1: Information waste is represented in a way that makes it incomprehensible to recipients.
Operational definition 2: Information waste is represented in a way that differs from the way legitimate information is represented.
Code features *(1) Abbasi & Chen (2009), (2) Prieto, Álvarez, & Cacheda (2013)
HTML source n-grams to distinguish font types, colors, and sizes. (1)
http instead of https (1)
Number of slashes in URLs (1)
URL suffixes (e.g. .org .us .biz): some contain more bad content than others. (1)
Spam programmers often try to hide redirections, functions or content by codifying. (2)
Scripts that generate code from user actions – HTML injection and cross-site scripting have certain pieces of HTML code that are recognizable (2)
Number of keywords in “keywords” and “description” meta tags (2)
Images without ALT attributes (2)
Spam pages tend to have an above-average size in bytes (2)
Spam pages tend to have more bytes of code in relation to their total size (2)
Spam pages’ code strings tend to be longer (2)
META tag redirection patterns (2)
Spam pages have fewer images because their makers spend less attention on it (2)
ALT attributes may be used for keyword stuffing (2)
Less effective heuristics: high amount of hidden text, use of redirections, script functions, dynamic function invocation, active, etc. (2)
Content features *(1) Ntoulas, Najork, Manasse, & Fetterly (2006), (2) Araujo & Martinez-Romo (2010), (3) Sharapov & Sharapova (2011)
Number of words in the page (1)
Number of words in page title (1)
Average length of words (1)
Amount of anchor text (1)
Fraction of visible content (1)
Compressibility (1)
Fraction of page drawn from globally popular words: spam pages were found to draw words from a focused
vocabulary, missing the articles and conjunctions rarely found in queries. (1)
Fraction of globally popular words: stop words are most prevalent in normal text and they should also be diverse. (1)
Independent n-gram likelihoods (1)
Conditional n-gram likelihoods (1)
Anchor text typology: spam pages tend to have anchor text oriented to search engines rather than users. (2)
Links that only contain punctuation marks (2)
Links that only contain digits (2)
Links that only contain a URL (2)
Links that only contain an empty chain (2)
Relation of number of out-links on page to average number of out-links on site (3)
Percentage of out-links compared to page content (3)
Table 2: Syntactic detection methods
4.4
Semantic layer
understood. Too little specificity and depth will not sufficiently inform the recipient, so the message will not be fully understood. On the contrary, too much specificity and depth overwhelms the recipient and the message will also not be understood. Automatic evaluation of semantic attributes of web pages is only possible to a limited degree. There are some methods that can measure the coherence of a web page as well as other language-based features. Algorithms can only make some inferences about the content that can partially distinguish an informative web page from a page created for malicious intent.
Operational definition: Information waste has no meaning to the recipient.
Operational definition 2: Information waste has too much or too little detail to serve the user.
Operational definition 3: Information waste aims to mislead or spam the user.
Thematic nearness *(1) Sharapov & Sharapova (2011), (2) Araujo & Martinez-Romo (2010)
Thematic nearness of link and page (1)
Thematic nearness of linked site and out-linked page (1)
Thematic nearness of neighboring links (1)
Anchor text: large divergence between anchor text and the linked page (Benczúr, Bíró, Csalogány, & Uher, 2006; Mishne, Carmel, & Lempel, 2005). (2)
Surrounding anchor text: text surrounding a link can provide contextual information about a link (Benczúr et al., 2006). (2)
URL terms: URLs should be related to the content of a page. (2)
Title: divergence between title and web page content can be a cue for spam. Titles play a significant role in queries because they capture what the document is about (Eiron & McCurley, 2003; Jin, Hauptmann, & Zhai, 2002). (2)
Page content: disagreement between anchor text and target content is a very useful measure to detect spam (Benczúr et al., 2006). (2)
Meta tags: meta tags are used more rarely, but their usefulness is high when they are used by a web site. (2)
Content features *(1) Prieto et al. (2013), (2) Wang, Zeng, & Tang (2010), (3) Sharapov & Sharapova (2011)
Independent n-gram probability to analyze content grammatically and semantically (Ntoulas et al., 2006) (1)
Specific spam words and phrases (1)
Cohesiveness: metrics in a reference ontology using a vector space classifier. (2)
Links, marked as advertising (e.g. “advertising”, “our partners” in the vicinity of links) (3)
Table 3: Semantic detection methods
4.5
Pragmatic layer
Pragmatics explains the effect of signs on human behavior. These larger structures have a purpose in human communication. Information at this level leads to intentions and actions. For this, the information needs to be useful and valuable to the user. The pragmatic layer therefore consists of several attributes.
Operational definition 1: Information waste is not useful and not valuable to the recipient.
Novelty character of information: informing a recipient of something new is a central attribute of information. A message informing someone of something he or she already knows does not make the recipient any more informed. This is redundancy. However, novelty is not
always essential, and redundant messages can serve as a helpful confirmation in some cases.
Operational definition 1.1: A message is information waste when it does not provide novel information and does not serve as a needed confirmation.
Goal relevance: information must help its recipients to make informed decisions by making sense of situations. Information that can be used to achieve a goal or make an informed decision has relevance to its users. Achieving goals and making informed decisions implies that the information required must be sufficiently accurate and complete for the task at hand.
Operational definition 1.2: Data which does not help its recipients make informed decisions is information waste.
Situational relevance:information may only be useful in certain situations. For example, the gas prices at nearby gas stations will only be useful when you need to refuel your car.
Operational definition 1.3: Information waste is information that is not relevant to the current situation.
Trust: information needs to be trusted by the recipient before he or she takes any actions that depend on it. “Perceived trustworthiness of information can be evaluated in terms of its accuracy, objectivity, validity, and stability” (Kelton et al., 2008, p. 370). Trust can relate to both the content itself and the information source. The qualities of the information source are referred to as credibility (Savolainen, 2011). If someone perceives information not to be trustworthy, decisions and actions will be delayed.
Operational definition 1.4: If information cannot be trusted, it is information waste.
Value to a recipient: value of information can be narrowly defined as instructional and economic value. Instructional value helps people or organizations to make decisions or solve problems. Economic value allows an individual or organization to make profit or avoid costs.
Operational definition 1.4: Information is waste when the recipient is unable to obtain any instructional or economic value from it.
Time dependence: Something might only be information at a certain point in time, while being irrelevant at another time. For example, knowing when the next bus home will leave is very relevant at the end of the day when it is time to go home after work. This information is less useful when you do not intend to go home yet.
Information-quality based evidence *(1) (Wang et al., 2010) In total, there were 16 metrics that could be evaluated by humans. From this list, six measures were found to be widely used and suitable for automatic analysis.
Currency: timestamp of the last modification of the document (1)
Availability: number of broken links on a page divided by the total number of links on the page (1)
Information-to-noise ratio: total length of the tokens after preprocessing, divided by the total size of the document (1)
Authority: Yahoo Internet Life (YIL) reviews gives sites scores from 1-4. If the site was not reviewed, its authority was assumed to be 0. (1)
Popularity: number of links pointing to a web page. Obtained from Alta Vista. (1)
Table 4: Pragmatic detection methods
4.6
Social world layer
At the highest level of the model, there is the social world. This layer consists of the information structures
that constitute our social existence. This layer is affected in a large part by the communications we have with other human beings. Information waste has the effect that people have more difficulty in finding what they are looking for, and online information providers might not be trusted. Web spam and related phenomena have been plaguing the internet for a long time. Web spam mainly misleads search engines, making them less effective. Other forms of unneeded and unusable content also clog up search results and lead to dissatisfaction. The extra effort needed to handle bad content is a form of waste as well, in line with Hicks’ (2007) perspective on
information production within a corporate setting. Moreover, false and misleading information has a negative impact on online transactions (e.g. e-commerce) as it reduces trust. The recent proliferation of web 2.0 platforms has also been misused by spammers, and information quality problems have been more rampant than ever before.
5.
WASTE DETECTOR
PROOF-OF-CONCEPT METHOD
5.1
Kernel theory and propositions
The type of information waste considered in this paper mainly pertains to the semantic and pragmatic layers within the semiotic framework. Existing detection methods intend to find web spam and fraudulent e-commerce sites, which are classified as information waste due to their empiric and syntactic properties. The troubling reality of the current-day internet is that it is filled with irrelevant and false information. Efforts to do something about this type of information waste have been limited so far. One of the reasons for this is that it is difficult to reach consensus on the true meaning of important concepts such as “relevance” and “information quality” (Hjorland, 2010; Mai, 2013). Relevance and information quality were found to be highly subjective and therefore difficult to evaluate automatically. Solid theories of objective and subjective relevance are needed, yet they are complex and riddled with paradoxes (Hjorland, 2010).
As information waste mainly pertains to the semantic and pragmatic layers within the semiotic framework, the subjective value of web pages is very important to examine. Wijnhoven & Amrit (2010) proposed a subjective file questionnaire to
determine the value of files in a file system. However, filling in such a questionnaire is too labor-intensive, so a method for automatically identifying file value is proposed. Five file characteristics were proposed as determinants of file value: (1) frequency of access; (2) file age; (3) last modification time; (3) file type; and (4) user grade (rank of person using the file). The causal relations by Wijnhoven & Amrit (2010) are shown in figure 2. If correlations between these propositions are corroborated, the file characteristics can be used as decision parameters in a file retention method. Rejected propositions should be excluded from the data retention policy.
Web analytics are a popular method to gather user data in order to improve the effectiveness of web sites (Kent, Carr, Husted, & Pop, 2011). Web analytics are gathered with the specific purpose of optimizing web content in order to make it more valuable and useful to users. For example, data gathered by Google Analytics can help web site owners determine which pages are the most popular, what type of information the users are looking for, and how much time they spend on the site (“Google Analytics Official Website – Web Analytics &
Reporting,” n.d.)2
. It can therefore be assumed that web analytics are indicative of pragmatic attributes. A major advantage of web analytics that the information is objective and can easily be obtained. We propose access speed (Eppler & Muenzenmayer, 2002; Palmer, 2002; Yang, Cai, Zhou, & Zhou, 2005), the number of incoming links (Palmer, 2002; Yang et al., 2005), frequency of access, time on site, bounce percentage, global page view percentage, and global user percentage as objective site characteristics. Palmer (2002) developed and validated subjective characteristics: (1) amount of information; (2) ease of obtaining information; (3) information from other pages; (4) usability of the website; (5) layout quality of the site; (6) speed of site; (7) quality of information display; and (8) if people see it as valuable to return to the site. These characteristics resemble the attributes of the pragmatic layer, but they can be assessed more consistently as they apply specifically to web sites.
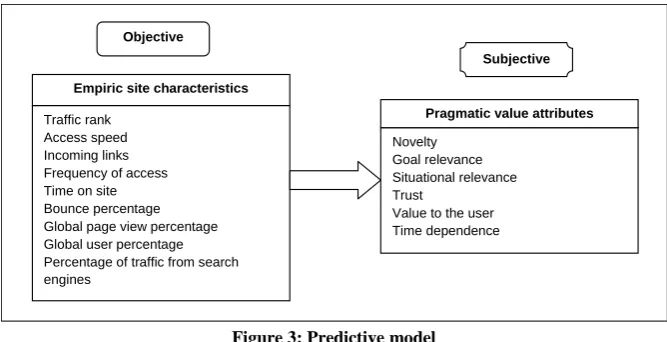
It is not yet clear to what extent these objective measures are indicative of subjective value. If a high correlation between subjective assessment and objective indicators can be found, these objective indicators can be used as proxies for subjective value and information waste. Figure 3 shows the predictive model to be used for this study. The objective, empiric metrics are gathered via web analytics tool that tracks the usage behavior of web users. The subjective value is comprised of the attributes of the pragmatic layer of the semiotic framework. We expect that the way internet users use web pages is indicative of the subjective value they attach to pages. Using objective attributes, a classifier will eventually be given the task to
[image:7.595.233.551.288.411.2]2http://www.google.com/intl/en_uk/analytics/
Traffic rank Access speed Incoming links Frequency of access Time on site Bounce percentage Global page view percentage Global user percentage Percentage of traffic from search engines
Empiric site characteristics
Novelty Goal relevance Situational relevance Trust
Value to the user Time dependence
Pragmatic value attributes Objective
Subjective
identify sites scoring low on subjective attributes. Depending on their effectiveness, objective measures can eventually be used for the development of a tool capable of automatically determining whether certain web content is waste.
5.2
Dataset
5.2.1
Objective metrics
Objective analytics from websites can be obtained in various ways. Site analyzers are scripts installed on web servers to provide web administrators with objective site performance metrics. An alternative is to crawl the internet and generate metrics from the crawled data. Another option is to install a browser add-on to track users’ behavior. Each of these methods has certain disadvantages for analyzing information waste on the web. Using site analyzers requires that every server has the same script if a representative portion of the web needs to be examined. Crawling a large portion of the web requires advanced hardware and is time-consuming. The third option, a browser add-on, may not provide representative data as only a limited number of people will install it. Internet users also generally object to being tracked extensively.
Because we are unable to generate objective metrics by ourselves, data provided by Alexa.com are used. Alexa.com provides analytic resources to web developers and administrators. Alexa.com gives an assessment of a web page by collecting the access speed, the number of incoming links, frequency of access, time on site, bounce percentage, global page view percentage, and global user percentage. The data is mainly gathered via a toolbar that tracks user behavior. Alternatively, web site administrators can install site analyzer scripts on their servers to gather data. Alexa.com does not provide an entirely representative overview of the internet, as their metrics are only accurate for the first 100,000 web pages in their ranking. Beyond this list, there are not enough site visitors to provide accurate statistics. Nevertheless, the sites considered in Alexa’s ranking are approximate to what users will typically perceive. Personal preferences and search engine referrals make that only a certain portion of the web is seen by each user. The following metrics are available via Alexa.com (Fons Wijnhoven, 2012):
Traffic rank: this rank is based on the traffic data provided by the toolbar panel over a rolling three-month period. A site’s traffic rank is composed of a combined measure of unique visitors and page views (“How are Alexa’s traffic rankings determined? – Alexa Support,” n.d.)3.
3 https://alexa.zendesk.com/hc/en-us/articles/200449744-How-are-Alexa-s-traffic-rankings-determined-
Access Speed gives an indication of whether a site feels “fast.” If a site feels slow it is more likely that users might leave the site. Loading speed is also indicative of the technical condition of a web site.
Links. If a website has a lot of incoming links, it is expected to contain good information. When other sites link to the site, it could be because the site contains useful or valuable information. Linking can be seen as a form of endorsement, and this principle is one of the foundations of Google’s PageRank algorithm (Brin & Page, 1998).
Frequency of Access is the number of unique monthly visitors to a site. If a site has a lot of visitors it most likely contains valuable information.
Time on site. If a user stays at a site for a long time, it most likely is good information because the user takes time to read the entire page. Precautions need to be taken with this metric because if a user keeps his browser open at a certain page while he is away or browsing other sites, it will give a false positive. Users also spend a long time on sites such as email and social networks to receive notifications while doing other things.
Bounce percentage is the percentage of unique users who visited only one page on a certain website. If a user only visits one page, it could mean that the page (and the rest of the website) are not interesting. However, it could also be that the page is not exactly what he/she was looking for; the information quality might not necessarily be bad.
Global page view percentage, which gives the percentage of pages viewed from a website compared to the estimated total number of page views.
Global user percentage, which gives an estimation of the percentage of global internet users who visit a specific site.
From search engine indicates the percentage of users who visited the site via a search engine. If a higher portion of users come by entering the URL directly, it could mean that they frequently use the site, therefore being of significant value to them. On the other hand, if many people find the site via a search engine, it could mean that the website has a good search engine ranking and seems relevant to many users.
These metrics are not always conclusive for the assessment of web pages; therefore, a combination of these indicators needs to be used. Only sites in English were selected because a user survey was needed. To prevent further compromising the sample, the top million sites listed by Quantcast.com were used to randomize the sample. One hundred sites were selected from this pool by dividing the complete set into 100 equal subsets, from which one site was selected each time.
5.2.2
Subjective metrics
[image:8.595.55.389.70.241.2]To obtain subjective ratings, a feedback tool was developed. The tool allows someone to open a web page and rate it on a scale of 1 to 5 along the dimensions of content, relevance, and comprehensiveness. All 150 sites were rated by one person. Thirty sites were also independently rated by two other researchers and the inter-rater reliability was computed for verification. Kappa inter-rater reliability tests (Cohen, 1960) are typically performed between two individuals; therefore, two kappa values were computed. Landis and Koch’s (1977) proposal for interpreting kappa values was used to assess the
values we obtained. Cohen’s kappa was 0.24 in one case and 0.22 in the other case, both indicating fair agreement according to Landis and Koch’s interpretation proposal.
5.3
Classifier algorithms
Detecting information waste is a classification problem – a specific object is placed in a set of categories, based on the respective object properties (Gorunescu, 2011). The objective of classification is to analyze historical data stored in a database and automatically generate a model that can predict future behavior (Turban, Sharda, Delen, & King, 2011). In the first stage of the classification process, a classification model is constructed by applying an algorithm on the training set. In this classification model development stage, the chosen model adjusts its parameters starting from the correspondence between input data and corresponding known output (Gorunescu, 2011). The induced model consists of generalizations over the records of a training dataset, which help distinguish predefined classes (Turban et al., 2011). Once the classification function is identified, the accuracy can be verified using the testing set by comparing the predicted output with the observed output. Classification models are typically compared to other models and algorithms to find the best one for the situation. There are four categories of classification algorithms in general: naïve Bayesian, clustering, decision trees, and neural network classifiers (Han, Kamber, & Pei, 2006). Ensemble learning techniques such as boosting and Random Forests combine multiple classifiers to increase the accuracy of classification. Three classification methods will be considered in this paper: Classification and Regression Trees (CART), Support Vector Machines (SVMs), and Random Forest. Each of these classification algorithms has different strengths and weaknesses and it is therefore worthwhile to compare their performance.
CART has the main advantage that it is relatively robust to outliers and noise. CART is also quite intuitive because the models can be visualized and the underlying principle is not excessively complex. However, the weakness of CART is that its structure can be unstable; slight changes in the training set can lead to dramatic changes in the decision tree (Kantardzic, 2011). The principle behind SVMs is based on the solid theoretical background of statistical learning which can effectively handle statistical estimation with small samples (Kordon, 2009). SVMs are currently one of the fastest-growing approaches of computational intelligence. SVMs create a hyperplane that splits the data into two parts. The support vectors are the vectors that lie on the margin of the hyperplane. These vectors are then used to define the decision rule or model. Some of the main advantages of SVMs are explicit model complexity control, repeatable results, and solid theory. The disadvantages of SVMs are that the approach is extremely mathematical and complex. Furthermore, the experience of SVMs in large-scale industrial applications and model support is relatively limited (Kordon, 2009). Random Forests are an example of an ensemble learning method. Random Forests were introduced by Leo Breiman (2001) and serve as an extension of his bagging idea and were also developed as a competitor to boosting (Cutler, Cutler, & Stevens, 2012). Random Forests combine the results of various predictive models generated during training (Kantardzic, 2011). Correct decisions are expected to be reinforced when there are multiple independent “decision-makers.” Ensemble learning is a promising approach for improving the accuracy of a predictive model.
5.4
Classifier training
The objective metrics to be used in the classification model are the following, as previously described in section 5.2.1: (1) Traffic Rank; (2) access speed; (3) number of incoming links;
(4) frequency of access; (5) time on site; (6) bounce percentage; (7) global page view percentage; (8) global user percentage; and (9) percentage of users from search engines. Data mining techniques will be used to determine the best fitting model. The initial dataset was pre-processed to give the classifier as little confusion as possible. Access speed was missing in many instances, so this attribute was removed altogether. This was judged to be appropriate because access speed relates more to the “feel” of a website rather than information quality. Subjective measures for each page pertain to the content, relevance, and comprehensiveness and were expressed with a number from 1 (low) to 5 (high). These ratings were added up to form a composite measure. Web sites that fall below a certain rating (threshold to be determined later) will be considered information waste, while web sites with a rating above this threshold will be labeled as non-waste. This dataset consists of 150 complete records, which is not very large, yet sufficient to train a classifier (Alpaydin, 2004).
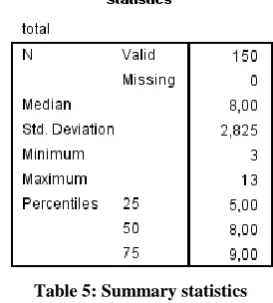
[image:9.595.355.492.389.541.2]The thresholds are determined by analyzing the statistical distribution of the subjective ratings. The distribution of the subjective ratings can be summarized by dividing it into four sections: the lower quartile (the area below the 25th percentile), the median (50th percentile), and the upper quartile (above the 75th percentile). Records in the lower quartile can be considered to be waste, while records in the upper quartile can be considered as non-waste with some certainty. There remains an area of less certainty between these quartiles. The summary statistics of the composite subjective ratings can be seen in table 5.
Table 5: Summary statistics
The waste threshold was set to 5, which initially resulted in 40 waste and 110 non-waste instances. Because such an imbalance in the training set would lead to classification problems, 70 non-waste instances were removed at random. A training set with an equal number of waste and non-waste instances will create a classification model that is not biased towards the class that appears more often. The training of the classifiers is done by using 10-fold cross-validation, also known as rotation estimation. This is more advanced that the simple split methodology and more suitable for a small training set. Positive and negative precision and positive and negative recall were used as metrics for performance evaluation, resulting in a four-way classification of the results:
True positive: a waste page classified as waste
True negative: a non-waste page classified as non-waste
False positive: a non-waste page classified as waste
Given this four way classification of results, the metrics are calculated as follows:
Positive precision is the number of true positives as a fraction of all the waste classifications
Negative precision is the number of true negatives as a fraction of all the non-waste classifications
Positive recall is the number of true positives as a fraction of all the true waste pages
Negative recall is the number of true negatives as a fraction of all the true non-waste pages
5.5
Results
Weka (“Machine Learning Project at the University of Waikato in New Zealand,” n.d.)4
was used as a tool to generate classification models from the training set. The method used for CART is known as “SimpleCart” in Weka, Random Forest was implemented as “RandomForest,” and the “LibSVM” package was used for SVMs. Using all Alexa variables on a training set consisting of 80 records, the classifiers perform as shown in table 6.
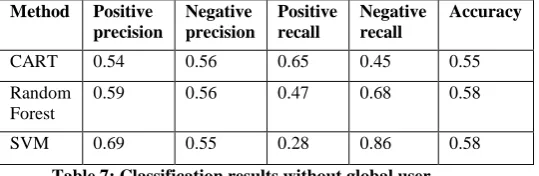
The statistical distributions of global page view percentages and global user percentages were found to be highly skewed and potentially unusable. When these two variables were not included in the classification model, the performance of the classifiers did not change significantly (see table 7). It did give a performance enhancement to the Random Forest classifier. This could mean that the two variables have little meaning or could even confuse the classifier.
5.6
Discussion
The classifier accuracy is lower than expected and the classification model is not yet suitable for implementation as a waste detector. This low performance could be caused by the small training set and outliers in this small set. Removing outliers could improve classification performance substantially, especially in such a small dataset. It is also possible that the variables provided by Alexa.com are not sufficient for predicting the quality of web pages. There may be too few variables, and the data quality may not be optimal. With regard to data quality, it must be noted that data about sites was missing often. The way the data were expressed (views and global users as percentages) also leads to a skewed statistical distribution that makes analysis more difficult. Nevertheless, these classification attempts have some meaning as a proof-of-concept of such a method. Some correlation has been found
4http://www.cs.waikato.ac.nz/ml/weka/index.html
between objective metrics from web analytics and subjective, human ratings. There are currently no other detection models that seek to classify the type of information waste described in this paper. The method applied could therefore break new ground, as existing approaches have focused mostly on the content of pages and their links rather than examining user statistics.
6.
CONCLUSION
The openness and freedom to provide information of all kinds on the World Wide Web has led to frequent information quality problems. The web is riddled with false and irrelevant information, and this is increasingly putting a burden on internet users. In this paper, the concept of information waste
has been thoroughly reviewed. A literature review has also shown the causes and effects of information waste in order to get an understanding of the extent of the problem. Because defining information waste has been difficult due to a lack of external clues and resulting subjectivity, semiotics has been proposed as an approach for getting a comprehensive overview of information waste. Semiotics can be said to form the foundation of information studies. By developing a theory of information waste rooted in semiotics, a specific meaning can be given at each level of the model. This helps to categorize and develop relevant detection methods, which may hold the key to a World Wide Web that is less cluttered with irrelevant and inaccurate information.
There are very few examples of methods that attempt to detect the type of information waste described in this paper (unneeded and usable information). Existing literature has mainly focused on detecting web spam, fake sites, and fraudulent e-commerce sites. In this paper, a novel approach for detecting information waste using web analytics was proposed. The basic reasoning is that the way users use a web page is indicative of its value and usefulness, which are pragmatic attributes within the semiotic framework. A link between objective metrics (web analytics) and subjective metrics (value and usefulness) was expected. By applying data mining techniques for classification, this concept has been partially proven. However, the performance of the model is too low for reliable implementation as a waste detector. More objective variables and a larger dataset are needed to improve the performance of the classifier.
A more sophisticated model could eventually be used to detect information waste. One practical implementation of such a model could be improved search engine performance. Search engines would not only return results that match the search best, but also provide results with the highest information value. Furthermore, the model can give feedback to site administrators and help them identify pages which could be removed.
7.
ACKNOWLEDGEMENTS
This research was conducted as a bachelor thesis for the International Business Administration program at the University of Twente. I would like to thank my supervisors, Fons Wijnhoven and Chintan Amrit, for their admirable guidance and insight into their research. I would also like to credit the work of two students who previously worked on classifying information waste: Sjoerd van der Meer and Sjoerd van der Spoel. Their writing and their datasets have been a very useful reference for this thesis.
Method Positive precision
Negative precision
Positive recall
Negative recall
Accuracy
CART 0.57 0. 62 0. 72 0.45 0.59 Random
Forest
0.46 0.47 0. 40 0. 52 0.46
[image:10.595.47.321.284.379.2]SVM 0.69 0.55 0.27 0.88 0.58
Table 6: Classification results
Method Positive precision
Negative precision
Positive recall
Negative recall
Accuracy
CART 0.54 0.56 0.65 0.45 0.55 Random
Forest
0.59 0.56 0.47 0.68 0.58
SVM 0.69 0.55 0.28 0.86 0.58
[image:10.595.49.319.469.557.2]APPENDIX
Figure A1: Semiotic framework (Stamper, 1996)
Table A1: Attributes of information at different sociomaterial layers (Boell & Cecez-Kecmanovic, 2010)
[image:11.595.147.452.276.484.2]REFERENCES
1. Abbasi, A., & Chen, H. (2009). A comparison of fraud cues and classification methods for fake escrow website detection. INFORMATION TECHNOLOGY & MANAGEMENT, 10(2-3), 83–101. doi:10.1007/s10799-009-0059-0 2. Alexander, J. E., & Tate, M. A. (1999). Web
wisdom: How to evaluate and create information quality on the web. Mahwah, NJ: Erlbaum.
3. Alpaydin, E. (2004). Introduction to machine learning. MIT press.
4. Araujo, L., & Martinez-Romo, J. (2010). Web Spam Detection: New Classification Features Based on Qualified Link Analysis and Language Models. IEEE Transactions on Information Forensics and Security, 5(3), 581– 590. doi:10.1109/TIFS.2010.2050767 5. Arazy, O., & Kopak, R. (2011). On the
Measurability of Information Quality.
JOURNAL OF THE AMERICAN SOCIETY FOR INFORMATION SCIENCE AND TECHNOLOGY, 62(1), 89–99. doi:10.1002/asi.21447
6. Bawden, D., & Robinson, L. (2008). The dark side of information: overload, anxiety and other paradoxes and pathologies. Journal of
Information Science, 35(2), 180–191. doi:10.1177/0165551508095781
7. Benczúr, A. A., Bíró, I., Csalogány, K., & Uher, M. (2006). Detecting nepotistic links by language model disagreement. In Proceedings of the 15th international conference on World Wide Web (pp. 939–940).
8. Berners-Lee, T., & Fischetti, M. (1999). Weaving the Web the original design and ultimate destiny of the World Wide Web by its inventor. San Fransisco: HarperSanFrancisco. 9. Bizer, C., & Cyganiak, R. (2009).
Quality-driven information filtering using the WIQA policy framework. JOURNAL OF WEB SEMANTICS, 7(1), 1–10.
doi:10.1016/j.websem.2008.02.005 10.Boell, S., & Cecez-Kecmanovic, D. (2010).
Attributes of information. In 16th Americas Conference on Information Systems 2010, AMCIS 2010 (Vol. 1, pp. 561–571). Retrieved from
http://www.scopus.com/inward/record.url?eid=2 -s2.0-84870531345&partnerID=tZOtx3y1 11.Breiman, L. (2001). Random forests. Machine
Learning, 45(1), 5–32.
12.Brier, S. (2005). Semiotics: Nature and Machine. In Encyclopedia of Science, Technology, and Ethics.
13.Brin, S., & Page, L. (1998). The anatomy of a large-scale hypertextual Web search engine.
Computer Networks and ISDN Systems, 30(1), 107–117.
14.Cohen, J. (1960). A coefficient of agreement for nominal scales. Educational and Psychological Measurement, 20, 37–46.
15.Cutler, A., Cutler, D. R., & Stevens, J. R. (2012). Random Forests. In C. Zhang & Y. Ma (Eds.), Ensemble Machine Learning (pp. 157– 175). Berlin, Heidelberg: Springer.
16.Davis, G. B., & Olson, M. H. (1987).
Management Information Systems: Conceptual Foundations, Structure, and Development (2nd ed.). Singapore: McGraw-Hill Book Co. 17.De Kunder, M. (2014).
WorldWideWebSize.com | The size of the World Wide Web (The Internet). Retrieved May 06, 2014, from
http://www.worldwidewebsize.com/
18.Diligenti, M., Coetzee, F., Lawrence, S., Giles, C. L., Gori, M., & others. (2000). Focused Crawling Using Context Graphs. In VLDB (pp. 527–534).
19.Eiron, N., & McCurley, K. S. (2003). Analysis of anchor text for web search. In Proceedings of the 26th annual international ACM SIGIR conference on Research and development in informaion retrieval (pp. 459–460). 20.Eppler, M. J., & Muenzenmayer, P. (2002).
Measuring Information Quality in the Web Context: A Survey of State-of-the-Art Instruments and an Application Methodology. In C. Fisher & B. N. Davidson (Eds.), IQ (pp. 187–196). MIT.
21.Fetterly, D., Manasse, M., & Najork, M. (2004). Spam, damn spam, and statistics: Using statistical analysis to locate spam web pages. In
Proceedings of the 7th International Workshop on the Web and Databases: colocated with ACM SIGMOD/PODS 2004 (pp. 1–6). 22.Floridi, L. (2005). Is semantic information
meaningful data? Philosophy and
Phenomenological Research, 70(2), 351–370. 23.Geng, G.-G., Wang, C.-H., Li, Q.-D., & Zhu,
Y.-P. (2007). Fighting link spam with a two-stage ranking strategy. In Amati, G and Carpineto, C and Romano, G (Ed.), Advances in Information Retrieval (Vol. 4425, pp. 699–702). HEIDELBERGER PLATZ 3, D-14197 BERLIN, GERMANY: SPRINGER-VERLAG BERLIN.
24.Google Analytics Official Website – Web Analytics & Reporting. (n.d.). Retrieved June 21, 2014, from
http://www.google.com/intl/en_uk/analytics/ 25.Gorunescu, F. (2011). Data Mining: Concepts,