
Analytical model of a mold dependent production line: Applied to future thermoplastic skin panel production for Gulfstream G650 tail wings
95
0
0
Full text
(2) Master Thesis IEM Summary version. J. Veijer. Analytical model of a mold dependent production line: Applied to future thermoplastic skin panel production for Gulfstream G650 tail wings. SUMMARY VERSION. Jarne Veijer Master: Industrial Engineering and Management, University of Twente Specialization: Production and Logistics. Supervision University of Twente Dr. Ir. A. Al Hanbali Dr. P.C. Schuur. Supervision Fokker Technologies Drs. G.H.J. Jeurink Ir. M.C.A van Herpt. November 2015,. Property of Fokker Aerostructures. ii.
(3) Master Thesis IEM Summary version. J. Veijer. Management summary Introduction In the aerospace industry thermoplastic composites are also coming up more and more in the aerospace as well in the automotive industry because of their economic and technical advantages. A program, called TAPAS, has been established by several Dutch industrial companies and research institutes to further research thermoplastic composites applications. Fokker Technologies has over 25 years of experience with thermoplastic composites and is involved in this program. Fokker has done a lot of research on material properties, production techniques and on applications. One of those applications are the skin panels of the Horizontal Tail Plane of the Gulfstream G650. Fokker also made several prototypes of thermoplastic skin panels with success.. Problem description The project of thermoplastic skin panels is broken down in several steps aiming at consecutive Technological Readiness Levels. To reach level 6, the industrialization must be investigated. This research project is part of reaching that level. My research project investigates what a current state production line (as used for the prototypes) is capable of, in terms of throughput and Total Cost of Ownership. The production line should be able to reach a rate of 100 skin panels per year. The production line does not exist yet, so all input data are estimated by Fokker experts. The designed production line is a serial line, with a mold-dependent part (or closed network). The skin panels are made on expensive molds in a closed network. After consolidation, the skin panels are released from the molds and further inspected and finished. The mold dependent processes are the critical part of the production line. The activities in the closed network also include handling many different parts, that must be assembled making up the product and some afterward dis-assembled as they support production.. Approach The problem is tackled by building and applying an analytical model (referred to as AMDA) in Excel. Input data like processing times, degree of variability, failure and repair times are included. The AMDA model is able to calculate the yearly throughput and the yearly TCO, for different scenarios. Several analyses are performed to investigate the sensitivity and the robustness of the production line. Also, these analyses give an indication where and what to improve for the future state. In the future state, several process improvements are applied. The AMDA model is used to find the best values of number of decision variables that minimize the TCO for a predetermined throughput target per year. Only the costs that related to the decision variables are taken into account. The following decision variables are used: -. Number of resources per station (include operators for labor intensive processes or machines + operators for non-labor intensive processes) Number of molds Number of shifts per station. The AMDA and its optimization are implemented in an Excel tool using VBA and the Excel SOLVER and validated.. Property of Fokker Aerostructures. 3.
(4) Master Thesis IEM Summary version. J. Veijer. Findings The production of the prototypes is called the current state and also the starting point of this research. This current state is modelled and several conclusions can be made: -. -. When considering 2 molds in the closed network, the current state production line is capable of a throughput of 260 panels (130 sets) per year. A maximum throughput of 700 panels (350 sets) per year with multiple molds can be reached in the current state. The TCO for a yearly throughput target of 100 panels (50 sets) is M€ 1,5. The number of molds is a very important factor which determines the performance of the production line. Therefore, the mold is the bottleneck. A lot of molds, however, results in a ‘saturated’ production line. Therefore, the production processes must by improved as well. The most critical production process is the Automatic Fiber Placement (AFP) station and therefore the best candidate for process improvements. The processing time of the AFP station is namely 42% of the total processing time of the mold dependent processes.. Based on the model results of the current state, several process improvements are proposed. This results in a future state which is also modelled and the following conclusions can be made: -. The future state is capable of producing 560 panels (280 sets) per year with 2 molds in the closed network. The TCO for a yearly throughput target of 100 panels (50 sets) is M€ 1,4. Process improvements result in higher investment costs because some processes will be (partly) automated. However, the calculated TCO of the future state is even lower than the TCO of the current state. The additional investments are not proportional to the increase of the throughput. The maximum improvement in TCO, compared to the current state, at 640 panels (320 sets) per year, is 58%. The maximum improvement in throughput, compared to the current state, with 10 molds is 176%. Therefore, the process improvements, proposed in the future state, are definitely worth considering when designing the production line.. Finally, some things are recommended: -. -. The production of thermoplastic skin panels requires lots of different parts (+/-1000 parts). This number must be reduced to improve the robustness of the production line. It will also improve the affordability and manufacturability. Standardization of the production line should therefore be further elaborated. During the early stages of a design process, one should focus more on Design to Costs. This way the production costs can be reduced and better controlled. The AMDA model can be used for multiple other mold dependent (future) Fokker production lines. Process improvements are worth considering. The proposed design should be further elaborated. It requires some investments, but for relatively high production rates these investments will be worth it.. Property of Fokker Aerostructures. 4.
(5) Master Thesis IEM Summary version. J. Veijer. Preface In 2013, I have gained my Bachelor of Applied Science degree in Mechanical Engineering. After a great experience abroad in Malaysia for this study, I started with the premaster and master Industrial Engineering and Management. I have never regretted this choice and highly enjoyed this IEM program. My specialization is Production and Logistics which has been right choice after Mechanical Engineering. I became mostly interested in manufacturing research areas. My interests and background study fitted perfectly with this research project. Besides, I highly enjoyed working for Fokker Technologies. I have always had a great interest in aircrafts. So this company was perfect for finalizing my master IEM program. What I also admire is the down-to-earth mentality at Fokker. This made information gathering a lot easier. I have liked the research project very much, as it is linked to my education and interests. To share my enthusiasm, I have put some sidesteps in this thesis. These sidesteps describe some interesting things, not directly related to this research, but nice to know. Additionally, some interesting problems were solved, e.g. the calculation of the number of shifts. A solution was hard to verify in the literature. Therefore, an assumption was made and proven by a simulation study. I would like to thank all Fokker employees for helping me during my graduation period. Without their knowledge and experience I would have never reached these results. Especially I want to thank Marc Koetsier and Michael Wielandt for initializing this research project. Thanks for your efforts and for getting me started and helping me with this research project. Furthermore, I would like to thank Hans Jeurink and Marc van Herpt for their supervision during my stay at Fokker. Hans, I appreciate your time and effort to review all the draft versions of my master thesis. I also appreciate the interesting discussions we have had, which helped me understanding the matter. I also thank John Hoogenboom, Andre van Homoet and Bert Bron for providing me with the right input data and for their time to help me. Last, but not least, I thank my supervisors at the University of Twente, Ahmad Al Hanbali and Peter Schuur for their feedback. Your advice and knowledge have been really helpful. Ahmad, I appreciate the help to apply the AMDA method. Additionally, the feedback on this research project is appreciated as well. My time as a student has come to an end. It was a great and interesting experience. But I am eager to use my gained knowledge and experiences in practice now. I am grateful for the past, and looking forward to the future.. Jarne Veijer. Property of Fokker Aerostructures. 5.
(6) Master Thesis IEM Summary version. Property of Fokker Aerostructures. J. Veijer. 6.
(7) Master Thesis IEM Summary version. J. Veijer. Table of Contents Management summary ........................................................................................................................... iii Preface ...................................................................................................................................................... v List of Abbreviations ................................................................................................................................ ix List of Symbols ........................................................................................................................................... x List of Tables ............................................................................................................................................ xi List of Figures ......................................................................................................................................... xii 1.. 2. 3. 4. 5. Introduction ..................................................................................................................................... 1 1.1. Company description ............................................................................................................... 1. 1.2. Problem description ................................................................................................................. 2. 1.3. Research objective and research questions ............................................................................. 4. 1.4. Research scope ........................................................................................................................ 6. 1.5. Solution approach .................................................................................................................... 6. 1.6. Deliverables ............................................................................................................................. 7. Current industrialization situation .................................................................................................... 9 2.1. Thermoplastic composites ....................................................................................................... 9. 2.2. Industrialization examples ..................................................................................................... 12. 2.3. Production of the skin panel ................................................................................................. 13. 2.4. Summary ............................................................................................................................... 14. Literature review ........................................................................................................................... 15 3.1. Classification of the problem ................................................................................................. 15. 3.2. Modelling approaches ........................................................................................................... 17. 3.3. Analytical model .................................................................................................................... 18. 3.4. Optimization method ............................................................................................................ 21. 3.5. Design improvements ........................................................................................................... 23. 3.6. Summary ............................................................................................................................... 24. Modeling the production line ........................................................................................................ 27 4.1. Assumptions .......................................................................................................................... 27. 4.2. Parameters ............................................................................................................................ 28. 4.3. Model validation ................................................................................................................... 35. 4.4. Summary ............................................................................................................................... 37. Result and Improvement ............................................................................................................... 39 5.1. Initial results .......................................................................................................................... 39. 5.2. Optimization ......................................................................................................................... 40. Property of Fokker Aerostructures. vii.
(8) Master Thesis IEM Summary version. J. Veijer. 5.3. Results for 50 sets per year ................................................................................................... 41. 5.4. Sensitivity of the input parameters ....................................................................................... 43. 5.5. Sensitivity of the decision variables ....................................................................................... 45. 5.6. Cost efficient frontier ............................................................................................................ 46. 5.7. Improvement potential ......................................................................................................... 48. 5.8. Conclusion ............................................................................................................................. 50. 6. Facility layout ................................................................................................................................. 53. 7. Conclusions and Recommendations .............................................................................................. 61 7.1. Conclusions ........................................................................................................................... 61. 7.2. Limitations and Future Research ........................................................................................... 63. 7.3. ample and validation of the number of shifts calculations .............................................................. 67 Re co B. Availability of the stations .............................................................................................................. 68 m C. Sensitivity Analyses on SCV and decision variables ......................................................................... 69 m en D. VBA programs ................................................................................................................................ 71 da E. Simulation model ........................................................................................................................... 73 tio ns .......................................................................................................................................... 62 F. Yearly TCO for different number of molds ..................................................................................... 74. Biblio G. Sensitivity of decision variables with 6 molds in the network ......................................................... 76 graph H. Validation of the Excel SOLVER ...................................................................................................... 77 y ............................................................................................................................................................ 65 Number of machines required for the current state ...................................................................... 79 A. E I. x. Property of Fokker Aerostructures. 8.
(9) Master Thesis IEM Summary version. J. Veijer. List of Abbreviations TAPAS. Thermoplastic Affordable Primary Aircraft Structures. TRL. Technological Readiness Level. HTP. Horizontal Tail Plane. NLR. Nationaal Lucht-en Ruimtevaartlaboratorium. AFP. Automatic Fiber Placement. NDI. Non-Destructive Inspection. CMS. Coordinated Measurement System. AMDA. Approximate Marginal Distribution Analysis. WIP. Work In Process. CQN. Closed Queueing Network. SCV. Squared Coefficient of Variation. GUI. Graphical User Interface. SA. Simulated Annealing. FMS. Flexible Manufacturing System. TCO. Total Costs of Ownership. Property of Fokker Aerostructures. 9.
(10) Master Thesis IEM Summary version. J. Veijer. List of Symbols n. Number of molds in the system. N. Maximum number of molds in the system. cj. Number of machines at station j. SCVj. Squared Coefficient of Variation of the processing time of station j. EPj. Expected Processing time of station j. EPrem,j. Expected time between arrival and first departure given that all servers are busy or expected remaining time. ELj(n). Expected number of molds at station j. ETCQj(n). Expected time to clear the queue of station j. EWj(n). Expected cycle time a station j. THj(n). The throughput of station j. TH0(n). The throughput of the network. Vi. Visit ratio. pj(l|n). The stationary probability of having l molds at station j with n molds in the network. PAB(c). Probability when the neighbor solution is accepted (Simulated Annealing algorithm). AS. Current solution. BS. Neighbor solution. cp. Cooling parameter. A. Availability. MTTF. Mean Time To Failure. MTTR. Mean Time To Repair. EPnom,j. Nominal processing time. EPe,j. Effective processing time. ρ. Utilization. Rj. Number of resources at station j. Sj. Number of shifts at station j. MDj. Mold dependency of station j (binary). Property of Fokker Aerostructures. 1.
(11) Master Thesis IEM Summary version. J. Veijer. List of Tables Table 2-1. Overview of material related terms ...................................................................................... 10 Table 4-1. Number of machines and processing times in hours ............................................................ 29 Table 4-2. Variation classes and SCV per station ................................................................................... 31 Table 5-1. Utilization of all mold dependent processes ......................................................................... 39 Table 5-2. Production settings for a yearly throughput target of 50 sets .............................................. 42 Table A-1. Numerical example of processing time calculation, using fictive numbers .......................... 67 Table B-1. The aggregate availability per station is calculated by multiplying the availabilities of the disturbances .......................................................................................................................................... 68 Table F-1. Yearly costs per mold for different yearly target of skin panels capable of producing ......... 74 Table H-1. Best solution for both optimization methods after a deep search ....................................... 77. Property of Fokker Aerostructures. 1.
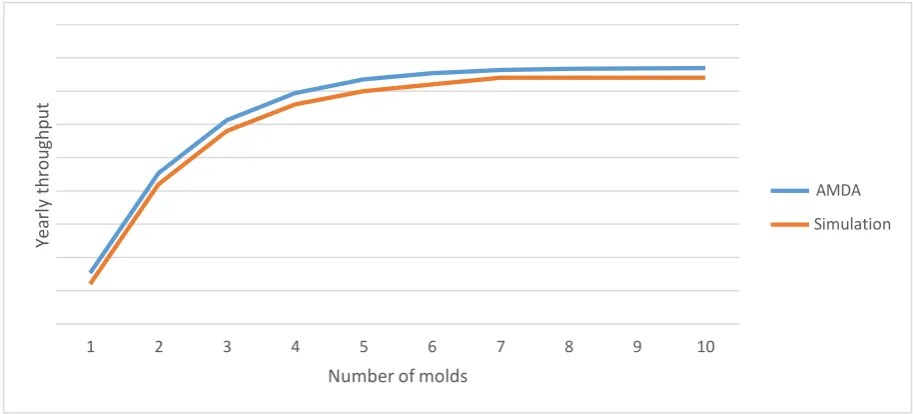
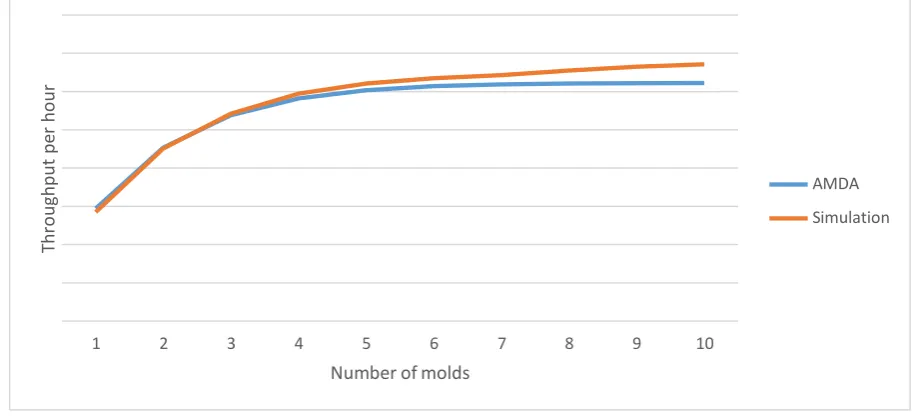
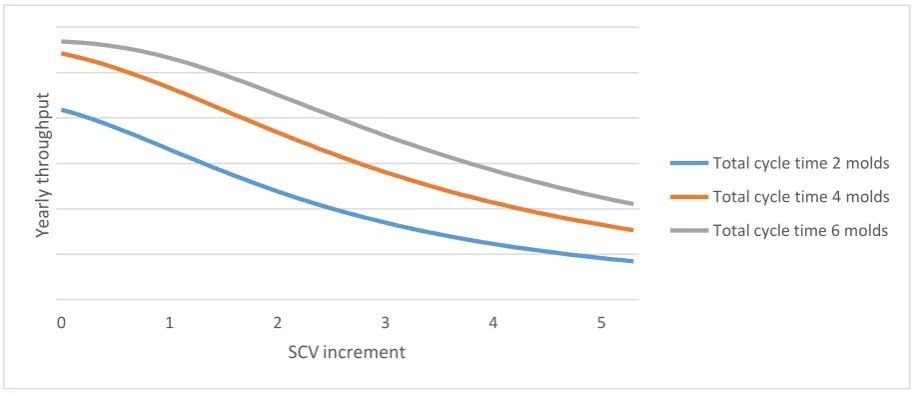
(12) Master Thesis IEM Summary version. J. Veijer. List of Figures Figure 1-1. Anthony Fokker in his ‘spider’ ................................................................................................ 1 Figure 1-2. Position of this assignment within Fokker Technologies ........................................................ 2 Figure 1-3. Horizontal Tail Plane .............................................................................................................. 3 Figure 1-4. Ribs of HTP with lower skin .................................................................................................... 3 Figure 1-5. Skin with stiffeners ................................................................................................................. 4 Figure 2-1. AFP placing the skin on top of the mold by robot for a prototype ....................................... 10 Figure 2-2. Stiffeners in the mold (green), supported by tooling blocks (red) ........................................ 11 Figure 2-3. Autoclave ............................................................................................................................. 11 Figure 2-7. Production steps for the production of the thermoplastic skin panel for the current state 13 Figure 3-1. Overview of the two parts within the production line ......................................................... 16 Figure 3-2. Different classes of hybrid approaches ................................................................................ 18 Figure 4-1. Overview of mold-dependent and mold-independent processes ........................................ 27 Figure 4-2. Different parameters ........................................................................................................... 28 Figure 4-3. Processing times in hours .................................................................................................... 29 Figure 4-4. Yearly throughput comparison between both models using 1 shift..................................... 36 Figure 4-5. Average cycle time comparison between both models using 1 shift. .................................. 36 Figure 4-6. Average throughput comparison between both models using 1 shift. ................................ 37 Figure 5-1. Number of skin panels produced per year per iteration ...................................................... 40 Figure 5-2. Number of skin panels produced per year per iteration for 50 sets with 2 molds ............... 42 Figure 5-3. TCO per panel for different number of molds ...................................................................... 43 Figure 5-4 Number of skin panels yearly produced for different SCV of stations in the total closed network.................................................................................................................................................. 44 Figure 5-5. TCO per panel for different SCV of stations in the total closed network .............................. 44 Figure 5-6. Yearly costs based per mold for different target of skin panels to be produced yearly ....... 47 Figure 5-7. Throughput increase for different reduction of processing time ......................................... 49 Figure 5-8. Throughput increase when making processes mold-independent....................................... 49 Figure A-1. Yearly throughput comparison between both models using 3 shifts ................................... 67 Figure C-1. Number of skin panels yearly produced when changing the predetermined SCV per station for 2 molds ............................................................................................................................................. 69 Figure C-2. TCO per panel when changing the predetermined SCV per station for 2 molds .................. 69 Figure C-3. Effect on throughput when changing the number of resources per individual station ........ 69 Figure C-4. Effect in resource costs when changing the number of shifts.............................................. 70 Figure C-5. Effect on throughput when changing the number of shifts ................................................. 70 Figure C-6. Effect in resource costs when changing the number of shifts.............................................. 70 Figure F-1 Costs per panel for different number of molds and for different targets .............................. 75 Figure G-1. Effect when changing the number of resources per individual station for 6 molds in the closed network....................................................................................................................................... 76 Figure H-1. Performance of both optimization methods for different targets ....................................... 77 Figure H-2. Results of methods improving each other with yearly throughput target of 100 ................ 78. Property of Fokker Aerostructures. xii.
(13) Master Thesis IEM Summary version. J. Veijer. “When everything seems to be going against you, remember that the airplane takes off against the wind, not with it.” - Henry Ford. Property of Fokker Aerostructures. 13.
(14) Master Thesis IEM Summary version. Property of Fokker Aerostructures. J. Veijer. 14.
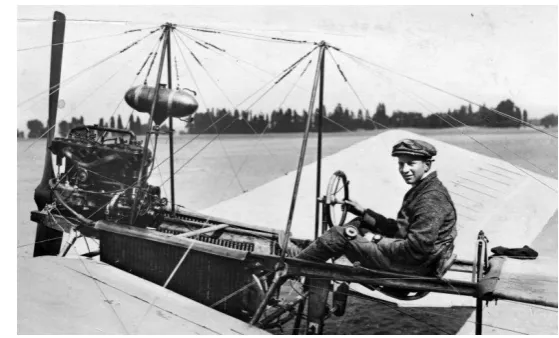
(15) Master Thesis IEM Summary version. Introduction. J. Veijer. 1. Introduction This thesis is part of the Master assignment for my study Industrial Engineering and Management at the University of Twente with specialization Production and Logistics. This chapter gives a broad view on Fokker Technologies in section 1.1. After that, the problem description, research objective and the research questions are given in section 1.2 and 1.3. Finally, the research scope and the solution approach is described in section 1.4 and 1.5. The purpose of this chapter is to inform about the Fokker organization and what the master thesis assignment looks like.. 1.1. Company description. In 1911, Anthony Fokker built his first home-made aircraft which he called ‘the Spider’ see Figure 1-1. Eight years later he was one of the first who saw the opportunities of aviation and founded the Dutch airplane factory. By 1925, Fokker had grown to be the world’s largest aircraft manufacturer and had plants in the Netherlands and the USA. For years, Fokker manufactured successfully military and commercial airplanes. In the First World War, Fokker provided the German government with military airplanes Figure 1-1. Anthony Fokker in his ‘spider’ which became famous by the Red Baron. In Second World War, Fokker provided the Dutch government with airplanes like the Fokker G1. In 1955, Fokker made one of its greatest accomplishments namely the introduction of the F27 Friendship. 750 F27s have been manufactured and it is the best-sold turboprop airplane in Western Europe of all times. This success was followed by the Fokker 50, Fokker 70 and Fokker 100 which were produced in the eighties and nineties. In 1996, Fokker had to adapt from aircraft integrator to specialist supplier due to market changes. In the same year, Fokker was acquired by Stork. Today Fokker uses innovative technologies, her experience and expertise to develop distinctive products and services. This approach in the aerospace industry is called ‘Aircrafting’ by Fokker. Fokker Technologies is divided into four business units: -. Aerostructures: light weight Aerostructures like tails, wing components, and the like. Elmo: Electrical wiring- and interconnect-systems Landing Gear: Landing gear of aircrafts and helicopters Services: Aircraft- and parts-availability services. Property of Fokker Aerostructures. 1.
(16) Master Thesis IEM Summary version. Introduction. J. Veijer. On 31 December 2014 Fokker Technologies counted 4688 employees. Approximately 75% of these employees work in the Netherlands. The total amount in revenue in 2014 was €762 million and the EBIT totaled €47 million. This assignment belongs to Fokker Aerostructures. This business unit has facilities in the Netherlands, USA, and Mexico. In the Netherlands, Fokker Aerostructures is located in Papendrecht, Hoogeveen and Helmond. Within Fokker Aerostructures, there are several Business lines like Large Commercial Aircrafts, Business Jets, Defense USA and EU and Special Products. Customers within these programs are Airbus, Boeing, Lockheed Martin, Patriot systems, Ariane V, etc. In Figure 1-2 an overview is shown of the position of this assignment within Fokker. The assignment belongs to the industrialization department within Fokker Aerostructures. The topic of the assignment was originated at the R&D department and most of the required information comes from that department. Manufacturing Engineering is also a part of New Concept Development and also delivers input to this assignment. In the next section, the problem for this assignment is described.. Fokker Technologies. Fokker Services. Fokker Technology. New Concept Development. Manufacturing. Engineering. Fokker. Aerostructures. Fokker Elmo. Fokker Landing Gear. Operations/Supply Chain Management. Industrialization. R&D. (problem owner). Input. This master thesis. project. Figure 1-2. Position of this assignment within Fokker Technologies. 1.2. Problem description. Fokker Aerostructures is involved in a program called TAPAS (Thermoplastic Affordable Primary Aircraft Structures). Currently, TAPAS has twelve partners in its collaboration. The focus of the program is on a decentralized partnership with Dutch industrial enterprises in cooperation with Airbus. The TAPAS program is further explained in chapter 2. Property of Fokker Aerostructures. 2.
(17) Master Thesis IEM Summary version. Introduction. J. Veijer. One of the products developed within TAPAS is a Horizontal Tail Plane HTP: Demonstrator 2. This Demonstrator 2 is a heavily loaded torsion box. The demonstrator represents an airliner’s trailing edge flap or the tail of a business jet. One skin panel of a typical box construction was produced in thermoplastic composite. The actual demonstrator is a redesign of the horizontal tail of the Gulfstream G650 business jet. Fokker Aerostructures headed up the development, design and construction of this demonstrator. The product was built in 2011 and then successfully underwent a complete certification testing program in 2012. This test program on skin panels included static testing, fatigue testing, damage tolerance testing, and a maximum load test. In anticipation of the full-scale test program, fatigue was first studied extensively at panel level. The result of the testing program concluded that thermoplastic stiffened skin panels are approximately 10 per cent lighter in weight than conventional thermosetting composite skin panels. Moreover, the cost of a thermoplastic panel is forecast to be lower, due to a number of factors, including the simplicity of producing butt-joint stiffeners. Key technology elements include the automatic placement of skin panels plus stiffeners, and the coconsolidation of the stiffeners. In the TAPAS2 project a complete thermoplastic torsion box is being developed, in which ribs will be joined onto the skin panels. The HTP consist of a grid of ribs see Figure 1-4. On both sides a thermoplastic skin will be mounted. These two skins are called a set. Each skin consists of stiffeners which guarantee strength and stiffness. Figure 1-5 shows the skin with the stiffeners, placed in the longitudinal direction of the wing. Note that the inner part of the skin in Figure 1-5 is darker. This part is used for the prototype. The production process of the skin includes four main production steps: -. Figure 1-3. Horizontal Tail Plane Tool preparation: Stiffeners are placed in a mold and positioned with special tooling blocks. Automatic Fiber placement (AFP): Robots place tapes of thermoplastic material over the mold. Consolidation: Material consolidates at a specific temperature and pressure. Machining and inspection: The shape of the skin must be milled and specific holes must be drilled. Finally, the skin is inspected.. This master thesis assignment is focused on the industrialization of the skin of the HTP. The structure of the HTP and the production steps are further elaborated in chapter 2 of this thesis. The technical design of the thermoplastic HTP is researched and developed at R&D. Now it is transferred to the industrialization department in order to design and manage the production process.. Property of Fokker Aerostructures. Figure 1-4. Ribs of HTP with lower skin. 3.
(18) Master Thesis IEM Summary version. Introduction. J. Veijer. The production strategy is ‘make to order’ because the production of a skin will start if Gulfstream gives an order. Other characteristics of the production are further described in chapter 3. Currently, there is no factory space available and a number of production equipment, currently used at Fokker, are not suitable for the new material and the size of the HTP. The length of the HTP could be up to 11 meters which makes it hard to handle. The production equipment must be able to deal with that. How to deal with the resources of the production process is an important issue. The TAPAS goal is to develop the HTP so it can be offered to the customers by the end of 2015. The objective for this assignment is to develop a production plan which must be able to produce 50 sets per year. Before this plan can be developed, the Figure 1-5. Skin with stiffeners. best production process must be determined, further. explained in section 1.4. This assignment includes two problem-areas namely the capacity and facility planning. The capacity planning problem is about the optimization of production steps. Important aspects are the number of resources (machines, operators and other tools), production policies (overtime, multiple shifts), variability, buffering and transportation of the product. The facility planning is about the design of the production line. Important aspects are logistic flows of the mold and tools.. 1.3. Research objective and research questions. How to solve the problem, stated in the previous section, is described in this section. The objective is to deliver Fokker with the most effective and efficient production process for the skins. This production process is characterized by the minimum Total Costs of Ownership (TCO) with a production target of 50 sets per year. The starting point is 50 sets per year, but it is also important to determine the upper production limits. From this objective the following research question can be formulated: ‘What is the most effective and efficient production process for the production of skin panels for horizontal tail plane of the Gulfstream G650, from a green field scenario, which satisfies the requirements and what should such a facility layout look like?’ In order to get answers to this main research question, several sub-research questions should be asked. Answering these research questions lead to an answer of the main research question. These sub- research questions are: 1. What relevant Fokker internal information is available and what does the production process of the thermoplastic skin look like? Before the production line can be designed and analyzed, some general information is needed in order to understand the production steps and possibilities. Specific data are available within the TAPAS program. The answer to this research question give insight in the technical situation the production steps for the skin panel. This internal information is gathered by consulting documents, interviewing Fokker experts for specific information and analyzing similar production lines. This research question is answered in chapter 2.. Property of Fokker Aerostructures. 4.
(19) Master Thesis IEM Summary version. Introduction. J. Veijer. 2. What literature on planning and modeling is available on this matter and can help with the production line design? After answering research question 1, the right method(s) must be found to solve this particular problem. Lots of literature is published about capacity planning problems, but most of them solve the problem partially. Problems with similar characteristics might help to solve this specific problem. These similar characteristics are determined by classifying the problem. There are two different techniques to solve the problem namely analytically or to use simulation techniques. The reason to do the literature study after answering research question 1 is to find relevant literature concerning this specific matter. This way the search process becomes more specific. This research question is answered in chapter 3. 3. What is the appropriate model for modelling the production process and how to build the model? In research question 2, several methods for planning and modeling a production process are investigated. This knowledge is used in research question 3 to find the appropriate model for modeling this production process. This research question is answered in chapter 3 and 4. 4. What parameters and input data are important for modeling the production process? Dependent on the modelling approach, the right parameters must be chosen and the best value must be found. Data like type of machines, processing times and setup times are available. Because the production line must be designed from scratch, some data are unknown. Therefore, a number of estimations need to be made based on experts’ opinion. The answer to this research question provides the input parameters and data necessary for solving the problem. Also, the uncertainty of the input data is taken into account. This research question is answered in chapter 4. 5. What is the most efficient and effective production process for 50 sets per year with a maximum of 350 sets? a. What is the most effective and efficient production process, what is its performance and how to validate the outcome? b. What is the robustness of the production line? c. What are the critical stations in the process and need to be improved? With the right method(s) and parameters, the production line should be modeled and evaluated. This research question is answered in several steps. First the process must be further optimized and validated (research question 5a). After that, the sensitivity of the line and machines must be determined to find the robustness of the line (research question 5b). Finally the most critical production steps concerning processing times, complexity and variability must be identified (research question 5c). A proposal is made what to do with these stations e.g. improve the process, add or change the resources. This research question is answered in chapter 5. 6. What should a green field production facility of skin panels look like? The answer to this research question is a good way to present and visualize the findings of research question 5. Additionally, it is very important for Fokker to know how the design of a facility should look like. This research question is answered in chapter 6.. Property of Fokker Aerostructures. 5.
(20) Master Thesis IEM Summary version. 1.4. Introduction. J. Veijer. Research scope. There are multiple areas to focus on when optimizing and designing a new production facility. This includes research areas e.g. capacity planning, facility planning, supplier selection, equipment selection, facility location and supply chain management. As described in section 1.3, the main focus of this master assignment is on the capacity problem. After optimizing the production process, a preliminary facility layout is determined. This assignment was originated at the R&D department of Fokker Hoogeveen. Therefore, it has been developed from a technical point of view. Things like material characteristics, production techniques and resource types are therefore known and serve as input for this assignment. This project uses the technical information to solve the problem from a logistical point. From this logistical point of view, the production steps are designed, analyzed, optimized and evaluated. Two of the production processes described in section 1.2 is mainly focused on in this assignment. These processes are Tool preparation and Automatic Fiber placement (AFP). These two processes are relatively new to Fokker because they have not been used on production lines for thermoplastic products. The other production processes are already used for other production lines and therefore well-known at Fokker. Important aspects to be taken into account are the logistic processes (e.g. how to place the tooling blocks in the mold), process variability and processing times. Another important aspect to take into account is the lead times of new equipment which is to be purchased. The outcome of the latter is critical in order to reach readiness level by the end of 2015. This level concerns a prototype demonstration in a relevant environment on the ground or in space (Minning, Moynihan, & Stocky, 2003). Finally the Total Costs of Ownership, as described in chapter 3, are related to the decision variables. Other costs like material, warranty, interest, engineering and quality costs, are not taken into account. This is because costs have no influence in finding the most effective and efficient production process. For this reason, a Return on Investment is not calculated because it requires the actual cost prices.. 1.5. Solution approach. This section describes how the research questions, stated in section 1.3, can be solved taking into account the preconditions, stated in section 1.2. Before the production process can be optimized, relevant information should be gathered and interpreted from internal sources and literature. This information helps to get a clear view of the situation and what has been researched already. This view is obtained by answering research question 1, 2, 3 and 4. Documentations and knowledge of these TAPAS researches are also used as input for this project in order to start the optimization steps of the process. The optimization steps start with an analysis of the current state of the production process by the data gathered in research question 1 and 4. These data are used for modelling and analyzing the production line for thermoplastic HTP skin panels. The upper throughput bound and the sensitivity on the throughput is researched. This step gives insight in critical production steps. After that, an optimization tool is used to find the most effective and efficient production line. If the current state is determined, the requirements for the future state can be determined and optimized by the solving. Property of Fokker Aerostructures. 6.
(21) Master Thesis IEM Summary version. Introduction. J. Veijer. technique and model, chosen from the literature study. The output of this model is validated and evaluated. The output should also be robust enough to give recommendations and a good conclusion. The answer of research question 5 finally gives most efficient and effective production process. Finally, a layout of the facility is proposed. Research question 6 focusses on this problem. The results of the model and analyses from chapter 5 are used as input for the layout of the factory. This layout is called the future state. Finally, the current and the future state are compared.. 1.6. Deliverables. In this research project the following products will be delivered: -. Excel tool which can model and optimize the performance of the production line for thermoplastic HTP sets in terms of capacity and TCO. Upper production limits, sensitivity of the production line and improvement potential for each production station. Factory layout and rough design concepts with applied improvements.. Property of Fokker Aerostructures. 7.
(22) Master Thesis IEM Summary version. Property of Fokker Aerostructures. Introduction. J. Veijer. 8.
(23) Master Thesis IEM Summary version. Current industrialization situation. J. Veijer. 2 Current industrialization situation The first chapter described the problem and the research questions. The second chapter gives an answer to the first research question. It gives an overview of the information at Fokker internally available concerning all aspects of the production of thermoplastic skin panels. Information is acquired by interviewing employees of Fokker and consulting (TAPAS) documentation. In section 2.1 an overview of the thermoplastic composites, their characteristics, equipment and the TAPAS program is given. Section 2.2 focusses on some industrialization projects and examples. Section 2.3 is about the skin panel and gives a description of the production steps of the skin panel of thermoset and the production process for the thermoplastic skin panel. The chapter ends with a summery in section 2.4. The purpose of this chapter is to inform on the thermoplastic properties and how the HTP and its production processes look like. These processes are defined as the current state (see section 2.3.3). The future state is described in chapter 6.. 2.1. Thermoplastic composites. To understand the production process of the skin panel, some general knowledge must be shared about the required material, equipment and tools. This section provides that general knowledge. First the characteristics of thermoplastic composites are described and why thermoplastics are used for the TAPAS HTP. Second the TAPAS program is further explained. A small overview of the material related terms is given. Third the equipment for the production of thermoplastic components is further explained. This section is not about the thermoplastic skin panel but about thermoplastic components in general. From section 2.4 the focus is on the production of the thermoplastic skin panel.. 2.1.1. Material characteristics. Before the TAPAS program can be explained, some material related definitions should be explained and are given in table 1. These definitions are frequently used in this thesis and therefore useful to understand. Thermoplastic composites are a combination of carbon, glass or aramid fibers and thermoplastic polymer. The thermoplastic polymer is impregnated into the fiber woven layers. Thermoplastic polymers have the property to melt when heated. Therefore, these composites are suitable for welding and that provides production opportunities. Thermoplastics are characterized by e.g. short production processing times, relative lower production costs, less maintenance, good reuse opportunities, high toughness and improved corrosion resistance. The fibers make the material strong in relation to weight. Thermoplastic composites are therefore lighter and stronger than metals. Applications of this material will make aircrafts lighter, stronger, safer, less noisy and more costeffective. That is an important advantage. (Fokker Aerostructures). Thermoset composites, on the other hand, become cured when heated. Once thermoset composites are formed into a shape, it is fixed and irreversible. This material property is an essential difference between thermoplastic and thermoset composites. Due to these differences and characteristics, thermoplastic composites will be used producing TAPAS HTP.. Property of Fokker Aerostructures. 9.
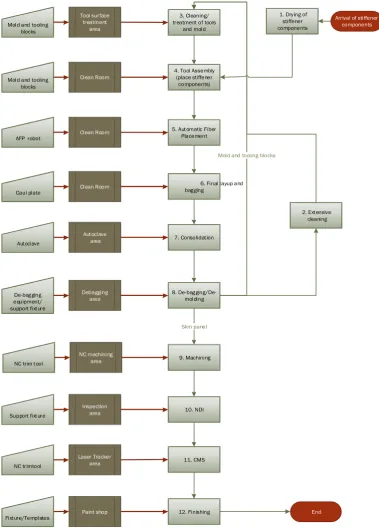
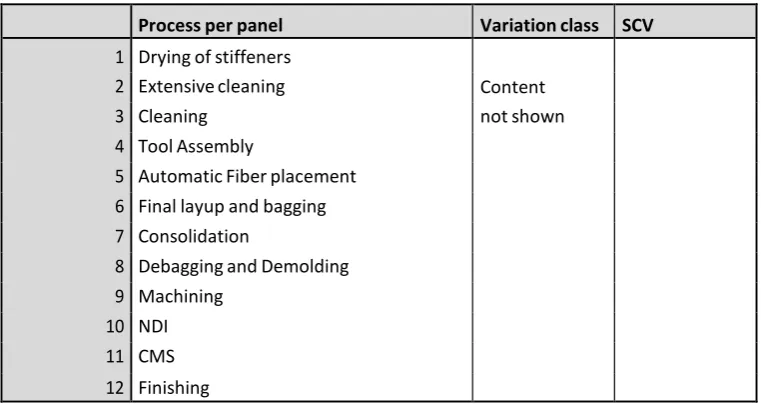
(24) Master Thesis IEM Summary version. Current industrialization situation. J. Veijer. Table 2-1. Overview of material related terms. Term Fiber woven layers Thermoplastic polymer Thermoplastic composite Thermoplastic component Thermoset polymer Thermoset composite Stiffeners. 2.1.2. Definition Fabric made of woven carbon, glass or aramid fibers Plastic material that melts when heated Thermoplastic polymers reinforced with fiber woven layers Aircraft component made of thermoplastic composites e.g. skin panel Plastic material that irreversibly cures when heated Thermoset polymers reinforced with fiber woven layers Extra material to stiffen the product.. TAPAS Program. Fokker Aerostructures developed aerospace components made from thermoplastic composites for over 25 years. The emphasis on the use of thermoplastic composites comes from both weight and cost reductions. Today Fokker is the worldwide leader in this thermoplastic technology and the number of applications is growing steadily. A Thermoplastic Affordable Primary Aircraft Structures (TAPAS) program has been founded by Fokker together with other partners e.g. University of Twente. Within the TAPAS program, Fokker develops affordable components like wings, tail planes and fuselages together with Airbus and several other Dutch companies. Thermoplastic composites are already used in the aircraft industry, but the number of applications is still limited. The objective of the TAPAS program is to further research and develop applications made of thermoplastic composites. The main focus is on primary structural parts for aircrafts. The TAPAS program involves several stages. The initial TAPAS program finished in 2013. In this program, a thermoplastic composite skin panel prototype was developed, manufactured and tested see Figure 2-1. The successful outcome of this program resulted in a follow-up program which is called TAPAS2. This program covers more than half of the R&D budget of Fokker Aerostructures. The outcome of this project is important for the future growth of Fokker Aerostructures. The TAPAS2 program Figure 2-1. AFP placing the skin on top of the mold by robot for consists of five work packages. Each work a prototype package concerns the development of a specific aircraft component. Work package 3 (WP3) is about the development of a Horizontal Tail Plane (HTP) made of thermoplastic composite. In the initial TAPAS program, a prototype of the HTP was successfully manufactured and tested at the Nationaal Lucht- en Ruimtevaartlaboratorium (NLR). In the TAPAS2 program, this project is further elaborated so it can be offered to the customers by the end of 2015 (Tapas Project, sd). Therefore, the industrialization of the HTP skin is an important aspect. SIDESTEP 2: The TAPAS program involves € 24, 4 million and is supported by a major grant from the Dutch Ministry of Economic Affairs. The Dutch and French prime ministers were present at the contract signing.. Property of Fokker Aerostructures. 10.
(25) Master Thesis IEM Summary version. 2.1.3. Current industrialization situation. J. Veijer. Equipment. This subsection describes the different tools and equipment which are used for the production of thermoplastic components within the TAPAS program. In section 2.3 it is described how the HTP skin panel is produced, using these tools. Mold and Tooling blocks Because of the melting behavior of thermoplastics, a mold can be used for the production of thermoplastic components. In the mold, the stiffeners for the skin panel are built up. Tooling blocks are used to keep the stiffeners on the right place in the mold as shown in Figure 2-2. (not shown) After that, the skin panel needs to be placed on the mold. Picture not shown Between the thermoplastic composite and the mold, a special release foil is placed to separate the product from the mold after consolidation. The mold Figure 2-2. Stiffeners in the mold (green), supported by is expensive and it is also involved in most others tooling blocks (red) steps of the production steps of thermoplastic components. This makes the mold the most critical piece of equipment of the total production process. Tape placement Another tool used for the production of thermoplastic components is an AFP robot. This robot is equipped with a special tool to place tapes on the mold (an example is shown in Figure 2-1). The tapes are small strips, made from the thermoplastic composite. The tape is supplied to the tool on the robot. This tool places the tape over the mold, using ultrasonic welding to fixate it in place. The material becomes hot due to high frequent local vibrations and this way it is welded to the layer below. Several layers of tape can be placed. Finally, the mold with the skin panel is packed in a vacuum bag and brought to vacuum to remove excess air. Another method is to use a tape layer. A tape layer can lay wider tapes and is faster, but only in one direction. The AFP robot can make bends but is slower compared to the tape layer. Autoclave After the intended thermoplastic composite layers of have been placed, the product must be consolidated in an autoclave. To do that the skin panel and mold must be bagged. An autoclave is a pressure chamber which uses a specific temperature and pressure to consolidate the product see Figure 2-3. The thermoplastic composite melts and the pressure consolidates the thermoplastic polymers with the fibers by fusing the layers. Once all layers are fused, the product can be removed from Figure 2-3. Autoclave the autoclave and be debagged.. Property of Fokker Aerostructures. 11.
(26) Master Thesis IEM Summary version. Current industrialization situation. J. Veijer. SIDESTEP 3. Thermoplastic products are consolidated at a temperature of 380 degree Celsius and at a pressure of 6 bar. Therefore, the autoclave requires a lot of energy to consolidate the product. The total amount of energy an autoclave uses per product is approximately 4.6 Megawatt. Beside energy costs, the investment costs for an autoclave is also high. The expected price for an autoclave for the HTP panels is approximately 4 million euro.. Non-Destructive Inspection After consolidation, the product must be tested for product defects. This testing is done by a NonDestructive Inspection (NDI). This means that the quality of the product can be determined without destroying the product. Several methods are suitable for such inspection like ultrasound, or X-ray equipment. For thermoplastic composites, this is usually done with ultrasound. An ultrasonic pulse with known intensity is released on the product and it moves through the material. When the pulse exits the product, its intensity is measured and compared. This way defects can be identified. Machining and measuring equipment After consolidation and inspection, the edges of the product must be machined. Also the holes must be drilled. During machining, clamping of the product is important because thermoplastic products can be flexible. Therefore, good clamping reduces variability. After machining, the dimensions are measured. Measuring can be done by Laser-tracker or CMM equipment. Tolerances of dimensions, capacity of equipment and type of product are important aspects for choosing the right measuring equipment. Finally, the product is painted with primer and coating. To increase the bonding of the primer, the product is grit-blasted. This section described the technical input for the assignment. In the next section, several industrialization projects and examples are explained and is analyzed on how these problems were approached.. 2.2. Industrialization examples. Within Fokker, there is little information available on the industrialization of production lines. Most of the information must come from the knowledge of Fokker experts. Therefore, most information must be obtained by interviewing these experts which were Industrial and Manufacturing Engineers. To assure the manufacturability of these products, manufacturing concepts are made. These documents give technical details on the product and how it should be manufactured. Aspects as product handling, logistics, tooling and equipment used are further described. These documents are useful for this master assignment to obtain relevant information. This section describes industrialization aspects of projects for Airbus and what can be learned from it.. 2.2.1. Airbus A320 rudder. A recent Fokker study on a thermoplastic product is a rudder for the Airbus A320. A deep research on industrialization has not been done for this product. Excel was used to visualize the production flow and calculate processing times and takt-times. An important conclusion of the information which was gained is that the mold is the most critical part. The mold is critical because several production steps depend on it (Gijseman, 2014). These production steps are further called ‘mold-dependent’ processes.. Property of Fokker Aerostructures. 12.
(27) Master Thesis IEM Summary version. 2.3. Current industrialization situation. J. Veijer. Production of the skin panel. In the previous sections, general information about the material, its production techniques and some industrialization projects within Fokker are given. This section builds on that information and applies it to the HTP skin panel. This section starts with the current production process of the thermoset skin panel. After that, a description of the structure or layout of the HTP is given. The section ends with the production steps of the thermoplastic skin panel. These steps are considered as the main result of this chapter. But they are also necessary to classify the problem for the second research question which is described in chapter 3.. Mold and tooling blocks. Mold and tooling blocks. AFP robot. Tool surface treatment area. 3. Cleaning/ treatment of tools and mold. Clean Room. 4. Tool Assembly (place stiffener components). Clean Room. 5. Automatic Fiber Placement. 1. Drying of stiffener components. Arrival of stiffener components. Mold and tooling blocks. Caul plate. Clean Room. 6. Final layup and bagging. 2. Extensive cleaning. Autoclave. De-bagging equipment/ support fixture. Autoclave area. 7. Consolidation. Debagging area. 8. De-bagging/Demolding. Skin panel. NC trim tool. NC machining area. 9. Machining. Support fixture. Inspection area. 10. NDI. Laser Tracker area. 11. CMS. Paint shop. 12. Finishing. NC trimtool. Fixture/Templates. End. Figure 2-4. Production steps for the production of the thermoplastic skin panel for the current state. Property of Fokker Aerostructures. 13.
(28) Master Thesis IEM Summary version. 2.4. Current industrialization situation. J. Veijer. Summary. This chapter provides an answer to the first research question. Fokker Technologies is part of the TAPAS program and is worldwide leader in thermoplastic technology. Thermoplastic composites reduce weight and costs of aerospace components compared to thermoset composites. Thermoset production of the skin panel is not comparable with the thermoplastic production process of the skin panel. The production process of the thermoplastic fuselage panels, however, has many similar production steps. The latter production process will therefore be used to generate ideas for the facility layout, described in chapter 6. From the industrialization project for A320 rudder, it is concluded that the mold is the most critical part in the total production process. The skin panel is strengthened by multiple stringers. These stringers consist of webs, caps and fillers. And last but not least, the skin panel has a wingspan of 11 meters. The final section of this chapter gives the current state of the production line. Figure 2-4 and Figure 4-1 gives an overview of the production processes. The next chapter describes what external information is available, such as relevant literature and studies which can be used for modeling and planning of this particular situation.. Property of Fokker Aerostructures. 14.
(29) Master Thesis IEM Summary version. Literature review. J. Veijer. 3 Literature review Now the problem has been described in chapter 2, a solution to the problem must be found. A literature study helps to find this solution and provide the answers to research question 2 and 3. This chapter describes what literature is available on planning and modelling and what an appropriate model would look like. First the problem is classified which is described in section 3.1. Section 3.2 elaborates three approaches to model the production line: analytical, simulation or a hybrid approach. Section 3.3 describes the analytical model which is used for this master assignment. After that, the optimization method is described in section 3.4. Finally, some ideas for the design of a production line are presented in section 3.5. The chapter ends with a summary in section 3.6. The purpose of this chapter is to present some useful ideas from literature which can help modelling and optimizing the production line. Additionally, ideas are given for the design of a future state factory.. 3.1. Classification of the problem. To determine the right model for this production line, it is important to classify the problem. There are several reasons for problem classification according to Good (1965). First the mental clarification and communication will be improved. Second it might discover new fields of research. Third it will help for the planning of an organizational structure or machine (Good, 1965). Problem classification is also important since this research is part of the design phase of the production line. This means that there are many design uncertainties. Problem classification can help to clear these uncertainties and clarify the problem. Finally, the search process becomes more efficient since it is better known what to look for. Like it is stated in chapter 2, current production lines at Fokker are not based on specific modelling techniques and laws. When an engineer designs a machine, laws of physics and metallurgy can help to make an efficient design. But there are no such laws for production engineers for designing an efficient production design. There is also no appropriate classification available which can classify real production systems (Maccarty & Flavio & Fernandes, 2000). Therefore, they made a review of several classifications for production systems and came up with a set of realistic classification dimensions. This section describes several classification dimensions which can be applied to the production of the skin panels.. 3.1.1 Classification dimensions Production systems can be classified by several dimensions e.g. physical organization, key resources and product flow control. These dimensions are important to develop a model (Askin & Goldberg, 2002). An elaborated study on production system classifications has been performed by MacCarty et al (2000). His conclusion is that each production system classification must choose between the level of detail and aggregation. MacCarty et al (2000) performed a study in which eight classification dimensions are identified. These dimensions are grouped in four characterizations namely general, product, process and assembly (Maccarty & Flavio & Fernandes, 2000). The purpose of their study is to facilitate a better understanding of real production systems which is also proved in their research. Property of Fokker Aerostructures. 15.
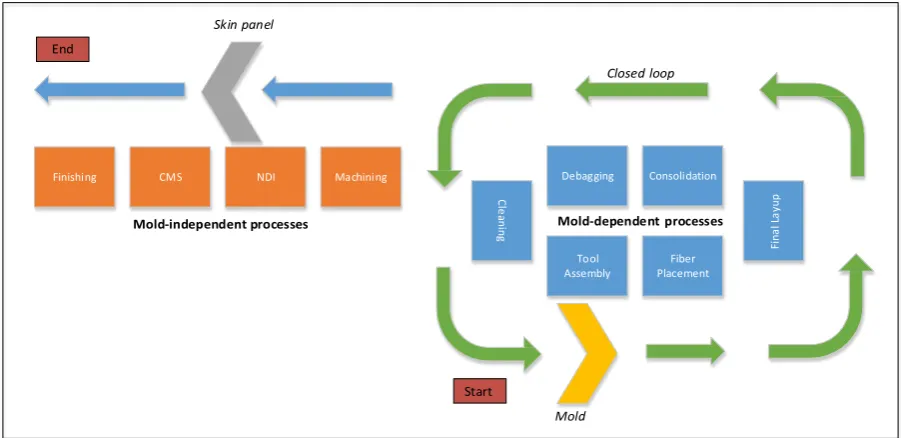
(30) Master Thesis IEM Summary version. Literature review. J. Veijer. paper. Several dimensions used in the studies just mentioned, can be applied to the production line of the skin panels and are stated below: Layout Production systems can have different layouts e.g. process, product, cellular or fixed position. The production line for the skin panels is an example of a product layout. This layout is mainly characterized by high volumes and short distances (Askin & Goldberg, 2002). The skin panels go from the first station to the next. The production line is therefore an example of a serial production line. This means that each station in the line depends on the previous station. If one station finishes its job, then and only then the skin panel can move to the next station. Product flow control Along the production line the skin panel moves from one station to the next. Since the skin panel is one product and not a continuous mass that flows through pipes or along conveyors, this production system is classified as a discrete production line. Order initiation Like it is stated in chapter one, a skin panel is produced when Gulfstream gives the order. Therefore, the products are made according to the ´Make-To-Order’ This means that no inventory is used policy. to store finished products. After the product is finished, it will be transported for assembly somewhere else. Open or closed loop network In the production line, two parts in the production processes can be identified. First the processes dependent on the mold and its equipment. Second the processes independent on the mold and equipment (see Figure 3-1). A detailed overview of the two parts can be seen in Figure 4-1. The first part is an example of a closed loop which means that the mold and its equipment highly influences the total throughput. The second part is an open network which means that the skin panels are produced and then leave the production line. Since the mold-dependent processes are most critical and have the longest processing times (see section 5.2), the focus is on this closed loop network.. Mold and Equipment Production processes. Figure 3-1. Overview of the two parts within the production line. Product variety The production line must produce two different skin panel types, namely the upper and lower skin panel. But the differences between both skin panels in the closed loop are negligible. The mold dependent processes are similar for both skin panel types. Therefore, the mold dependent processes Property of Fokker Aerostructures. 16.
(31) Master Thesis IEM Summary version. Literature review. J. Veijer. belong to a single-class system. However, the total production line is a multi-class network because some mold-independent processes steps differ per skin panel type. Product volume The target is to produce 50 sets per year, which is equal to 100 skin panels per year. Since the two skin panel types are similar, the production system is classified as a dedicated production line. The processing times per station are estimated by Fokker experts. The processing times are also subject to a certain degree of variation. The model should therefore take into account variability of processing times. Fabrication of Flow type The production consists of several production stages or stations. The product moves in one direction and therefore the production line should be modelled as a unidirectional multi-stage production system.. 3.2. Modelling approaches. There are mainly two approaches to model a production system namely analytically or using simulation software. Since the production line for the skin panels is relatively simple, the analytical approach would be obvious. But the production line is still in its design phase and consists of several stochastic elements. In that case, simulation software would be a better option to model the production system. Both options are examined in this chapter.. 3.2.1. Analytical approach. When the complexity of the production process is relative low, an analytical method is better (Law, 2007). Analytical models provide an exact solution which is better than the output of simulation software. Another advantage is that analytical models can be solved rapidly (Dallery & Gershwin, 1992). Law (2007) partly confirms it when he states that simulation software is time-consuming (Law, 2007). Nyhuis (2005) concludes that analytical methods have a statistical nature while simulations have a better level of detail. Besides, analytical methods require a higher modeling effort and it is harder to look from different perspectives. (Nyhuis, von Cleminski , & Fischer, 2005). 3.2.2. Simulation approach. Simulation models are capable of describing complex real-world systems. Additionally alternative policies can be compared by several experiments and a simulation project can be modelled for a long time frame. However, there are several disadvantages like the fact that each run is an estimation. This disadvantage can be tackled by running the model several times. Besides, simulation models are expensive and time-consuming. Finally simulation results can be impressive. The persuasive impact of a simulation might tend to place greater confidence than justified (Law, 2007). According to Nyhuis et al (2005) simulation can be a good method for exploring, designing and optimizing a complex system. It is a dynamic process which creates a higher level of detail compared to analytical methods. The amount of construction effort of simulation methods is reasonable and finally simulations are widely accepted according to Nyhuis et al (2005).. Property of Fokker Aerostructures. 17.
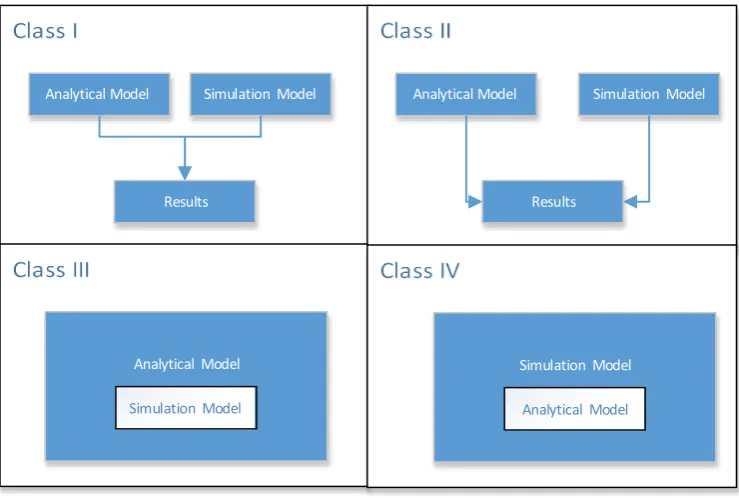
(32) Master Thesis IEM Summary version. 3.2.3. Literature review. J. Veijer. Hybrid approach. Both approaches have their advantages and disadvantages. Analytical models are exact and static while simulation models are approximations and dynamic (Hsieh, 2002). A combination of both approaches into one approach is another option. This is called a hybrid approach. Such approach gives different perspectives of the production system. A combination of analytical and simulation models might offer some of the advantages and avoid the disadvantages (Byrne & Bakir, 1999). Sargent (1994) defines a hybrid model as a mathematical model that combines simulation and analytical models. He proposes four different classes which are shown in Figure 3-2: Class I: Model behavior is obtained by alternating between the simulation and the analytical model Class II: Simulation and analytical model operate parallel with interactions Class III: Simulation model is used in a subordinate way for an analytical model Class IV: Simulation model is used as an overall model and requires analytical solutions as input.. Analytical Model. Simulation Model. Results. Analytical Model. Simulation Model. Results. Analytical Model. Simulation Model. Simulation Model. Analytical Model. Figure 3-2. Different classes of hybrid approaches. Because the production line for the thermoplastic skin panel is relative simple, an analytical model is preferred. The production line is also in design phase which makes it hard to retrieve reliable data. Therefore, a simulation approach might be useful for validation of the analytical model. Therefore, the Class III hybrid model suits best for this master assignment. An analytical model is made to answer the research questions because it is less complex and time-consuming. A simulation model is made for validating the analytical model so that the outcome is reliable.. 3.3. Analytical model. A manufacturing system with uncertain processing times can be analytically modeled as a network of queues (Zijm, 2012). A network can be open- or closed. As explained in section 3.1, the production line. Property of Fokker Aerostructures. 18.
(33) Master Thesis IEM Summary version. Literature review. J. Veijer. is an example of an open network with an internal closed network. The mold dependent processes must be modelled as a closed network. According to Zijm (2012), the closed network is an example of a Workload Controlled Manufacturing System. By controlling the Work in Process or WIP of these systems, the time a job is in the system can be reduced. A Flexible Manufacturing system is an example where the number of pallets limits the number of jobs in the system. Therefore, Closed Queuing Networks (CQN) do not imply statistical independence of the number of jobs in the system. The number of jobs is dependent on the number of pallets available. In the mold dependent processes, the mold can be seen as a pallet which limits the number of skin panels in the production line. There are several direct methods to find the mean performance measures of a CQN. These methods are the Mean Value Analysis algorithm (MVA) and the Marginal Distribution Analysis algorithm (MDA). MVA is only applicable for single-machine stations and MDA for multi-machine stations. In both models expected cycle time is found on the Arrival Theorem. This theorem roughly states that an arriving job at any workstation observes the whole system as being a system in a steady-state with one less job (Zijm, 2012). Both algorithms assume exponential processing times (Zijm, 2012). Additionally, the algorithm assumes that there is an infinite buffer capacity between the stations. Because the production line of the skin panels is not running yet, the probability distribution of the processing times is unknown. Therefore, the assumption of exponential processing times cannot be applied and a general distribution is used instead. In most real-world manufacturing systems, processing times are not-exponential distributed. Therefore, Zijm (2012) proposes an Approximation of the Marginal Distribution Analysis algorithm (AMDA). This algorithm uses general distributed processing times and is for single-class systems. The AMDA algorithm can be used for multi-machine systems. Since the number of machines is a decision variable in our optimization model (see chapter 5), this algorithm is chosen. The AMDA algorithm uses the following parameters: n= N= Cj = SCVj = EPj = EPrem,j = ELj (n) = ETCQj (n) = EWj (n) = THj (n) = TH0 (n) = Vi = pj (l|n) = network.. Number of molds in the system. Maximum number of molds. Number of machines at station j. Squared Coefficient of Variation of the processing times of station j. Expected processing time of station j. Expected time between arrival and first departure given that all servers are busy or expected remaining time. Expected number of molds at station j. Expected time to clear the queue of station j. Expected cycle time at station j (including processing times) The throughput of station j. The throughput of the network Visit ratio of The stationary probability of having l molds at station j with n molds in the. The AMDA algorithm is a recursive procedure to calculate the performance measures of the CQN. Each iteration a mold is added to the network. This process continues till N molds are in the network. Because the production line is unidirectional and serial, the visit ratios for all stations are 1. Each iteration 5 key performance indicators are calculated:. Property of Fokker Aerostructures. 19.
(34) Master Thesis IEM Summary version. 1. 2. 3. 4. 5.. Literature review. The expected cycle time at each station The throughput of the network The throughput per station The expected number of molds at each station The marginal probabilities. J. Veijer. (EWj (n)) (TH0 (n)) (THj (n)) (ELj (n)) (pj(l|n)). The expected time at a station depends on expected remaining time when a mold has to wait in the queue. The remaining time at each station can be formulated as follows (see Zijm (2012) section 3.2.): ��𝑗𝑗. �����,� = (1 − ���� ) (� 𝑗𝑗𝑗𝑗. +1). �� 𝑗𝑗. + ����. �. Where the squared coefficient of variation is calculated as follows and has a different value for each different probability distribution:. ����. 2 𝑗𝑗 � 2 𝑗𝑗. =. The expected time at a station also depends on the expected number of molds in the queue. This number can be calculated by the following formula: �=. �� �� (� − 1) = ∑�−1 (� − ��)�� (�|� − 1). Where the stationary probability of having l molds at station j with n molds in the network can be calculated as follows:. ��(�|�). ��� ��� (�) �. min(� � , �). �� (� − 1|� − 1). =. ��(0|�) = 1 − ∑ ��(�|�) � =1. The time it takes to clear the queue before a station is given by the product of the expected number of molds in the network and the mean processing time divided by the number of machines. This is can be calculated as follows: ����� (�) = �� (� − 1). �� 𝑗𝑗 �𝑗𝑗. The expected time at a station is given by the following formula: ��� (�) = �� (�|� − 1) ∗ �����,� + �� �,� (� −. ��𝑗𝑗 �𝑗𝑗. + ���. 1). The throughput time of respectively the network and the station is calculated as follows: ��0(�) =. Property of Fokker Aerostructures. ∑𝑀𝑀. 20.
(35) Master Thesis IEM Summary version. �. Literature review. J. Veijer. � �� (�). �=0 �. �. ��� (�) = ��0(�). Because the production line is serial, the visit ratios (Vi) are one. The algorithm consists of the following steps: 1. Initialization (j=1,...,M, n=0, pj(0|0) = 1). Property of Fokker Aerostructures. 20.
Figure


+7
Outline
Related documents
In addition to Chubb’s industry leading Watercraft coverage and claim service, we are pleased to offer your customers a 5% Multi Line credit on their Watercraft premium
6 | P a g e included size, deflections, material consumption of members in RCC and steel sections as compared to Composite sections was also studied closely and
Characterization of gyrA and parC mutations in ciprofloxacin-resistant Pseudomonas aeruginosa isolates from Tehran hospitals in Iran.. Rosetta Moshirian Farahi 1 , Ahya Abdi Ali
It examined the determinants of female's involvement and commitment in the higher education institutions in Saudi Arabia and the relationship between females'
The association between epilepsy and palmoplantar fibromatosis was first described in 1941 by Lund where he noted an incidence of Dupuytren's disease reaching 50% in 190 men and 25%
Experiments were designed with different ecological conditions like prey density, volume of water, container shape, presence of vegetation, predator density and time of
In the present study anatomical and chemical properties of Dendrocalamus memberceus Munro species results are shows that number of vascular bundle frequency and
2015 IX Conferencia Internacional Guide Página 2 Importance of researching biotechnology’s open educational resources Malajovich (2011, p. 2) defines biotechnology,
