http://www.scirp.org/journal/jep ISSN Online: 2152-2219
ISSN Print: 2152-2197
DOI: 10.4236/jep.2017.812095 Nov. 29, 2017 1541 Journal of Environmental Protection
Evaluating and Improving the Effectiveness of
Vehicle Inspection and Maintenance Programs:
A Cost-Benefit Analysis Framework
Ying Li
Department of Environmental Health, College of Public Health, East Tennessee State University, Johnson City, USA
Abstract
Motor vehicle inspection and maintenance (I/M) programs are designed to identify high-emitting vehicles and mitigate their impacts on air quality and climate. I/M programs have been traditionally ranked superior among various vehicle emission control measures by the results of cost-benefit analysis, based on the assumption that these programs will achieve the targeted emission re-duction outcomes. However, the actual effects of I/M programs may be greatly uncertain and when this uncertainty is taken into account, these programs may become suboptimal. This study develops a new a cost-benefit analysis framework that links various program design consideration, such as program participation rate, identification rate and effective repair rate, to the public health benefits as well as costs of the programs. This framework helps decision makers to investigate minimum implementation requirements that at least ensure the benefits are greater than the costs of implementing the programs in order to improve the overall effectiveness of the I/M programs. To illustrate the applications of the framework, it was applied to a particulate matter oriented I/M program targeting all diesel-fueled vehicles in the city of Bang-kok, Thailand, a large metropolitan area that has been suffering from severe ambient PM pollution mainly attributable to its wide use of diesel-fueled ve-hicles and motorcycles. It was found that the health benefits achieved from the program are sensitive to several key program design elements, including par-ticipation rate and problem vehicle identification rate, fraction of effective re-pairs and illegal operation rate. Other variables, such as the testing cut-points and vehicle population growth rate, only have modest effects on the overall emission reduction and consequent health benefits. Overall, the performance of multiple variables associated with I/M program design needs to be im-proved simultaneous in order to achieve the targeted benefits of the program. How to cite this paper: Li, Y. (2017)
Eva-luating and Improving the Effectiveness of Vehicle Inspection and Maintenance Pro-grams: A Cost-Benefit Analysis Framework. Journal of Environmental Protection, 8, 1541-1566.
https://doi.org/10.4236/jep.2017.812095
Received: September 29, 2017 Accepted: November 26, 2017 Published: November 29, 2017
Copyright © 2017 by author and Scientific Research Publishing Inc. This work is licensed under the Creative Commons Attribution International License (CC BY 4.0).
http://creativecommons.org/licenses/by/4.0/
DOI: 10.4236/jep.2017.812095 1542 Journal of Environmental Protection
Keywords
Inspection and Maintenance Programs, Cost-Benefit Analysis, Effectiveness, Program Design
1. Introduction
Motor vehicle inspection and maintenance (I/M) programs are designed to identify high-emitting vehicles and mitigate their impacts on air quality and cli-mate [1]. In western developed countries such as the United States (US), these programs have been considered to be cost-effective and are required by the Clean Air Act Amendments of 1990 in regions with the most challenging air pollution problems [2][3]. The main purpose of I/M programs is to encourage better maintenance for in-use vehicles and to assure the vehicle emission control systems are functioning properly through periodic inspections. The rationale for an I/M program is that the emission distribution among a vehicle population is highly skewed: A small portion of vehicles (estimated at 5% - 10%), sometimes called gross polluter vehicles, is responsible for a substantial fraction (variously estimated at 50% to 80%) of total vehicle emissions [4][5]. Moreover, not only old vehicles can be gross polluters, but also vehicles of all model years may in-clude some proportion of gross polluters [5], due to the factor that vehicle emis-sion levels are heavily dependent on maintenance. This problem can be even more pronounced in developing countries, where vehicles have a long lifetime and are often poorly maintained [6]. In this case, upgrading maintenance prac-tices and replacing the worst engines should be considered first before moving on to better technology [7]. In addition, despite technological and regulatory advances, new vehicle standards are not sufficient to achieve pollution abate-ment goals if vehicles deteriorate rapidly, resulting in increasing emission rates [6]. Therefore, to control rapidly growing vehicle emissions, governments must not only affect the behavior of vehicle manufacturers and fuel suppliers, but also the actions of drivers in terms of how well they maintain their vehicles regardless of their vehicle ages [8].
DOI: 10.4236/jep.2017.812095 1543 Journal of Environmental Protection among the drivers of a region [8].
Due to these challenges, the actual cost-effectiveness of I/M programs often remain uncertain. In theory, vehicular emission reductions available from I/M programs are mainly determined by the failure thresholds, or cut points, used to identify problem vehicles, but are also quite sensitive to a variety of factors, such as the actual percentage of problem vehicles identified, the percentage of prob-lem vehicles waived from repairs or operating illegally, the emission reduction achieved by repairs, the durability of repairs, and so on [2]. In practice, these factors are often overlooked in designing and evaluating a regional I/M program.
This paper aims at developing a cost-benefit analysis framework for evaluat-ing the effectiveness of vehicle inspection and maintenance programs, on the ba-sis of the emission reduction assessment tool called “I/M Design” developed by [2] (referred to as EISINGER2005 hereafter), and the health benefit analysis tool developed in our previous study [9]. This combined analysis framework incor-porates various factors that affect the level of emissions achieved by an I/M pro-gram, and links emission reduction with health benefits (avoided mortality and illnesses). The new framework is then applied to a hypothetical particulate mat-ter (PM) oriented I/M program targeting all diesel-fueled vehicles in the city of Bangkok, Thailand, a megacity that has been suffering from severe adverse health effects attributable to PM for a few decades, to illustrate how the frame-work may help to evaluate the cost-effectiveness of I/M programs.
2. Methods and Data
2.1. Theoretical Framework
I/M programs are one of the essential policy tools to control emissions from in-service vehicles in severely polluted urban areas [2]. An I/M program has the potential to reduce emissions in a number of ways, such as better maintenance of vehicles by motorists as a result of the program, repairs made in anticipation of an I/M inspection (referred to as pre-test repairs) or as a result of failing the test, and early scrapping of vehicles that are not worth repairing [3]. Figure 1 il-lustrates the sources of emissions reductions resulting from an I/M program.
Based on this conceptual framework, EISINGER2005 developed a spreadsheet tool to evaluate the effectiveness of I/M programs in terms of levels of emission reductions achieved by those programs. The theoretical basis of this tool is that the amount of vehicle emission reductions resulting from an I/M program is a function of the following variables [2]:
• Pre-I/M test repair work: potential vehicle repairs motivated by instituting
I/M for the vehicles that would otherwise be identified as problems.
• Post-I/M test repair work: emission reductions from repair work for the
DOI: 10.4236/jep.2017.812095 1544 Journal of Environmental Protection Figure 1. Sources of emission reductions from I/M programs (Partial information source: [3]).
• Vehicles scrapped: emission reductions will be generated from scrapping
gross polluting vehicles that would otherwise continue to be used, and re-placing them by low emission vehicles. This variable also includes high-pol- luting vehicles that are transferred outside the I/M region due to the imple-mentation of the programs.
Based on this theoretical basis, this study modified the equations developed by EISINGER2005 and included six equations in the Spreadsheet used to estimate the benefits and costs of an I/M program as follows (all six equations Equations (1)-(6) were originally developed by EISINGER2005, and adopted in this study with minor modifications):
Equation (1) describes the percentage of all problem vehicles that are identi-fied by an I/M program. This variable is a function of the program participation rate and problem vehicle identification rate:
ProbVeh=PartiRate IndenRate× (1)
where:
ProbVeh: Percent of all problem vehicles that are identified by an I/M pro-gram.
PartiRate: Percent of total required vehicles that participate in an I/M pro-gram.
IndenRate: Percent of problem vehicles inspected that fail the test.
Equation (2) describes the percentage of problem vehicles that are both iden-tified by I/M and subsequently undergo repair work:
(
) (
) (
)
PercentRep=ProbVeh×1 ScrapFrac− × −1 VehWaive × −1 IllegalVeh (2)
where:
DOI: 10.4236/jep.2017.812095 1545 Journal of Environmental Protection ProbVeh: Fraction of problem vehicles (vehicles emitting above certification standards) identified by the I/M program test (this is a function of false pass rates).
ScrapFrac: Percent of failed vehicles that are retired from the fleet within one year of failing their I/M test.
VehWaive: Fraction of problem vehicles (vehicles emitting above certification standards) identified by the I/M program test but allowed a waiver from needed repair work (a function of money spent on repairs).
IllegalVeh: Fraction of problem vehicles (vehicles emitting above certification standards) operating without obtaining the requisite repairs or certifications needed to pass or waive out of the I/M inspection process.
Equation (3) describes the percent of a vehicle’s total emissions that are re-duced through repair work:
PercentRed=GoodRep ExEm DurRep EmisFrac× × × (3)
where:
PercentRed: Percent of total vehicle emission reductions achieved by repairs, for the vehicles failing I/M and getting repaired (does not include vehicles that fail I/M and are scrapped, waived, or illegally operating).
GoodRep: Fraction of repairs that are “good” (effective), as measured by per-cent of repaired vehicles that immediately pass a retest.
ExEm: Fraction of excess emissions (where “excess” means emissions above allowable levels, usually referred to as the “cutpoint”) reduced from identified problem vehicles that receive good repairs (I/M does not address all excess emis-sions, for example cold start emission problems).
DurRep: Durability of good repairs, as measured by percent of vehicles with good repairs that pass retests at 12 or 24 months.
EmisFrac: Fraction of total vehicle emissions represented by pre-repair excess emissions (this is a function of the “cutpoint” used to define the point at which a vehicle is allowed to pass I/M; emissions above the passing cutpoint are consi-dered excess). In other words, emissions below I/M cutpoints are essentially ac-ceptable, emissions above cutpoints are excess; this variable represents the per-cent of total vehicle emissions considered excess.
Equation (4) describes the benefits of repair work after I/M test:
BenefitsRep=PercentRep PercentRed× (4)
where:
BenefitsRep: The percentage of vehicles repaired (PercentRep), multiplied by the percentage reduction achieved per repair (PercentRed); units are in percent of total vehicle emissions reduced.
Equation (5) describes emission reduction benefits from vehicle retirements due to I/M test failures:
BenefitsScrap=ProbVeh ScrapFrac ScrapEmis× × (5)
DOI: 10.4236/jep.2017.812095 1546 Journal of Environmental Protection BenefitsScrap: Percent reductions from all problem vehicles, due to vehicles that are scrapped (considering emissions from the replacement vehicles).
ScrapEmis: Percent of total vehicle emissions reduced, for each vehicle retired from the fleet, after accounting for replacement vehicle emissions.
Equation (6) describes total program benefits, in terms of the percent emis-sion reduction in total vehicle emisemis-sions from the I/M program:
BenefitsTotal=BenefitsGrow+BenefitsRep+BenefitsScrap (6)
where:
BenefitsGrow: Percent emission reductions achieved due to the changes in ve-hicle population growth as a result of I/M enforcement. It is calculated by using the projected total number of vehicles under the baseline and the I/M scenarios, as well as the fleet-average emission rates. This variable is not in the original “I/M Design” spreadsheet, but is developed by this study to reflect future I/M effectiveness as vehicle fleets change over time.
The unit for BenefitsTotal is percent of total vehicle emissions reduced, for the entire problem vehicle fleet.
This spreadsheet tool, developed by modifying the tool given in EISINGER2005, allows users to adjust the values of parameters in the model and obtain the re-sulting percentage of emission reductions in total vehicle emissions. Although the tool is developed in the US for the most common gasoline vehicle I/M pro-grams, the fundamental ideas of vehicle I/M programs are universal and thus the theoretical modeling framework applies to I/M programs targeting other pollu-tants in other regions. However, the values of the variables must reflect the spe-cific contexts and issues of concern with respect to the interested area and pro-grams1.
The present study used this spreadsheet tool as a cost-benefits framework that links I/M design considerations with health benefits associated with the pro-grams in order to understand the impacts of some key issues regarding I/M de-sign, such as compliance rates, testing cut-points and effectiveness of repairs, on the potential health benefits of the programs.
Our previous study estimated the potential health benefits associated with the proposed PM-oriented I/M programs targeting all diesel-fueled vehicles and motorcycles in the city of Bangkok, Thailand, a megacity in Asia that has been suffering from severe adverse health effects attributable to ambient PM for dec-ades [9]. In that study, the health benefits as a function of different levels of PM10 (all particulates with an aerodynamic diameter of less than or equal to 10 μm) emission reductions were analyzed and compared with the social costs of the I/M programs (these different levels of reductions were considered due to the significant uncertainty involved in the actual emission reduction benefits of I/M programs). It was found that a minimum of about 4% reduction of the total PM10 emissions from motor vehicles is required in order for the total benefits to
DOI: 10.4236/jep.2017.812095 1547 Journal of Environmental Protection be greater than the total costs of implementing the programs. On the basis of that study, the main purpose of the current study is to examine how key va-riables affect PM10 emission reductions available from the same I/M programs, and the desirable performance of these variables in order to achieve the 4% minimum emission reduction objective. The best available information about I/M experience in Thailand and elsewhere were used as the inputs to the models in spreadsheets.
2.2. A Framework to Estimate the Effectiveness of I/M Programs
Empirical evidence on the performance of I/M programs and on the important elements affecting I/M emission reductions is fairly limited. Evidence on the performance of PM-oriented I/M is even less available given that these programs are still relatively new. In Thailand, the data collected by a World Bank study [10] on their pilot motorcycle inspection and upgrade project in Bangkok are the most comprehensive dataset on I/M programs in the Bangkok Metropolitan Re-gion (BMR). Very little information is available on the performance of I/M tar-geting diesel-fuel vehicles including buses and trucks. Given the limitation of data, in running the spreadsheet developed by EISINGER2005, the values of most variables in the tool are derived based on the best available information in the U.S. and some extrapolation is performed to the BMR. Definitions of the va-riables in “I/M Design” and their input values used in this study are presented in Table 1.
In addition to the input variables listed in Table 1, the spreadsheet also needs the following inputs related to the characteristics of the vehicle population stu-died: 1) Problem vehicles as percent of total vehicles: The values used in the spreadsheet were consistent with the assumptions made in our previous study— 10% of buses and heavy trucks, 17.5% of light trucks and 25% of motorcycles in the BMR are problem vehicles [9]. In the uncertainty analysis, the upper and lower bounds of this parameter were assumed to be 1.5 times and half of the mean estimate, respectively. In lack of empirical evidence to support the form of PDF of this parameter, the uniform distribution was selected based on the au-thors own judgment; 2) Problem vehicles as percent of total PM emissions: Stu-dies usually suggest that the gross-polluting vehicle pool is responsible for a sub-stantial fraction—ariously estimated at 50% to 80%—of total vehicle emissions [4][5]. Based on this, this study assumes that 50% and 80% are the lower and upper limits, respectively, and the mean value of them, 65%, is the best estimate of total vehicular emissions are generated by problem vehicles. Also, the uniform distribution was selected in the uncertainty analysis based on the author’s own judgment; 3) Number of vehicles (under both the baseline and the I/M scena-rios), average annual vehicle kilometers traveled (VKT) per vehicle and baseline fleet-average emission rates (in the unit of g/km-vehicle).
DOI: 10.4236/jep.2017.812095 1548 Journal of Environmental Protection Table 1. Variables governing I/M program emission reductions (All variables in this table were developed and defined in EISINGER2005 unless noted).
Variable name and definition
Variable
explanation EISINGER2005Values used in 1
Values used in this study
(Range, PDF) Discussion
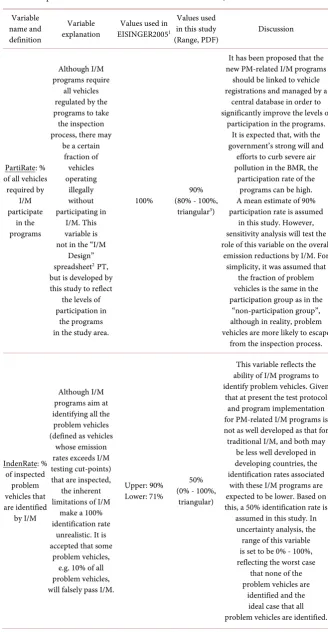
PartiRate: % of all vehicles
required by I/M participate in the programs Although I/M programs require all vehicles regulated by the programs to take
the inspection process, there may
be a certain fraction of vehicles operating illegally without participating in I/M. This variable is not in the “I/M
Design” spreadsheet2PT,
but is developed by this study to reflect
the levels of participation in
the programs in the study area.
100% (80% - 100%, 90% triangular3)
It has been proposed that the new PM-related I/M programs should be linked to vehicle registrations and managed by a
central database in order to significantly improve the levels of
participation in the programs. It is expected that, with the government’s strong will and efforts to curb severe air pollution in the BMR, the
participation rate of the programs can be high. A mean estimate of 90% participation rate is assumed
in this study. However, sensitivity analysis will test the role of this variable on the overall
emission reductions by I/M. For simplicity, it was assumed that
the fraction of problem vehicles is the same in the participation group as in the “non-participation group”, although in reality, problem vehicles are more likely to escape
from the inspection process.
IndenRate: % of inspected problem vehicles that are identified by I/M Although I/M programs aim at identifying all the problem vehicles (defined as vehicles
whose emission rates exceeds I/M testing cut-points) that are inspected, the inherent limitations of I/M
make a 100% identification rate
unrealistic. It is accepted that some
problem vehicles, e.g. 10% of all problem vehicles, will falsely pass I/M.
Upper: 90% Lower: 71%
50% (0% - 100%,
triangular)
This variable reflects the ability of I/M programs to identify problem vehicles. Given
that at present the test protocol and program implementation for PM-related I/M programs is not as well developed as that for traditional I/M, and both may
be less well developed in developing countries, the identification rates associated
with these I/M programs are expected to be lower. Based on this, a 50% identification rate is assumed in this study. In
uncertainty analysis, the range of this variable is set to be 0% - 100%, reflecting the worst case
that none of the problem vehicles are
DOI: 10.4236/jep.2017.812095 1549 Journal of Environmental Protection Continued ScrapFrac: % of failed vehicles that are scrapped
Early scrappage of problem vehicles results in emissions
reduction, if the replacement vehicles generate less emission. For simplification, “I/M
Design” does not account for replacement vehicle
deterioration, and all replacement
vehicles are assumed to pass
I/M two years following their
purchase.
Upper: 13.3% Lower: 6.7%
5% (0% - 10%)
for motorcycles,
2.5% (0% - 5%) for
light duty trucks, 0.5% (0% - 1%) for
buses and heavy trucks
(Triangular distribution)
A World Bank study
[10] predicts that 5% of failed motorcycles will
be scrapped. This result indicates that the early scrappage rates attributable to I/M programs may be lower in
developing countries than in developed countries.
5% is applied to motorcycles in
this study, and a 2.5% scrappage
rate is assumed for light-duty trucks and
0.5% for buses and heavy trucks,
given that these vehicles are generally more
expensive and thus less
likely to be scrapped. VehWaive: % of identified problem vehicles waived by an I/M program
I/M design in the U.S. generally allows some
fraction of problem vehicles to be waived from
the programs, usually because
of economic hardship.
Upper: 1%
Lower: 4% 1% (0-2%, uniform)
In Bangkok, the government may also consider
waivers in the implementation of
I/M programs. In particular, for public transit such as buses, high repair costs are likely to result
in significant increases in bus fares, which
may prevent low income people from using them. However, given the
severity of the air pollution
problem in the area, a high waiver rate should be
DOI: 10.4236/jep.2017.812095 1550 Journal of Environmental Protection Continued IllegalVeh: % of identified problem vehicles operate illegally
There may be some fraction of vehicles operating illegally without undergoing the requisite repairs or certifications
needed to pass or be waived from the I/M inspection process. Upper: 6.6% Lower: 13% Motorcycles and light trucks: 20% (0% - 40%); buses and heavy trucks:
10% (0% - 20%) (Triangular distribution)
The illegal operating rates may be higher
in the BMR since the I/M programs are less mature. It was assumed that for motorcycles and
light trucks, the rates are both 20%,
and for public transits and heavy
trucks, the rates are 10% since it should be easier to identify the violations by these
vehicles on road.
GoodRep: % of repair work initially
effective
Some fraction of repairs are not
effective but falsely pass re-tests. For example, random
roadside tests show that a portion
of the vehicle fleet fails I/M immediately after
being repaired but then pass
an official I/M test.
Upper and Lower: 80%
72% (44% - 100%,
triangular)
Available information related to this variable is very limited.
A study by Land Transport Department
of Thailand randomly selected 21 private inspection centers in
Bangkok and requested two problem motorcycles
to be tested by these inspection stations [7]. The two motorcycles were failed by 12 of
the 21 stations whereas passed by
the remaining 9 stations [7]. This study indicates
that only 58% (1 9 21− ÷ ) of
testing vehicles may properly pass the I/M. It was assumed
that the updated I/M in the BMR considered here will improve the performance of this variable and
achieve 90% of the US level. Therefore, the value of this variable is:
DOI: 10.4236/jep.2017.812095 1551 Journal of Environmental Protection Continued
ExEm: % of excess emissions (emissions above allowable levels) from identified problem vehicle reduced by good repairs (repairs that properly pass
an I/M test immediately)
Effective repairs motivated by I/M do not address all excess emissions. For example, I/M tests do not address emissions from cold starts, since vehicles are tested after the engine and catalyst are warm. US EPA
estimated that a model IM240 program identifies
92% of HC, 68% of carbon monoxide (CO), and 83% of nitrogen oxides
(NOx) excess
emissions.
Upper: 92% Lower: 81%
81% (62% - 100%,
triangular)
This variable is highly uncertain for I/M programs targeting PM without further research. In lack of further information, the rates of the three pollutants HC (92%), CO (68%), and NOx (83%)
are averaged (equal to 81%) and used for PM. The range is 62% - 100%.
DurRep: % of good repairs that
remain durable
Some of the good repairs may deteriorate fast and not be durable
enough to pass another I/M test after one or two years (depending on
the frequency of testing required). Therefore, they will
generate excess emissions in be-tween two tests.
Upper: 94% Lower: 79%
86.5% (73% - 100%,
triangular)
Diesel vehicles may deteriorate rapidly without proper maintenance.
On the contrary, a well-maintained diesel vehicle
will generally retain a good emissions performance throughout
its operating life
[11]. It is expected that the updated I/M programs in the BMR should be able to motivate
vehicle owners to better maintain their vehicles in anticipation
of the effective inspection process.
In lack of more available information,
the US values were used in this study.
DOI: 10.4236/jep.2017.812095 1552 Journal of Environmental Protection identify the worst polluters and minimize false failures [2]. In reality, vehicle emission rates usually span a wide spectrum. Conceptually, if an I/M targets a 25% reduction of the total emissions from motor vehicles, a cut-point equal to 75% of the current fleet-average emission rate will reduce the emission rates of all vehicles to 75% of the current level or lower, and thus ensure that the 25% emission reduction target is reached with confidence. However, given that the emission rates of the large portion of “good” vehicles (e.g. 90% of total vehicles) are usually much lower than the small portion of problems vehicles (e.g. 10% of total vehicles), it is not necessary, or probably not feasible either, to cut the emission rates of all vehicles to 75% of the current average level or lower in or-der to achieve the 25% reduction goal2. More stringent cut-points may be able to fail more vehicles, in particular those with emission rates close to the failure cut-points. However, more stringent cut-points are also likely to increase the so-cial costs of I/M programs, and to suffer from problems such as technological infeasibility and motorist acceptance of the programs. While how to select and modify testing cut-points in I/M design to optimize the program effectiveness is beyond the scope of this study, this study uses the “ideal” cut-points discussed above, i.e. cut-points equal to 75% of the baseline fleet-average emission rates for each vehicle type in the BMR for the “best estimate” case, followed by an exami-nation of the impacts of alternative cut-points on overall emission reduction le-vels. Just for comparison, the enhanced I/M in southern California’s South Coast Air Basin studied in EISINGER2005 used a rate of 86% of the baseline the fleet-average emission rate as the failure cut-point (the baseline rate was 1.25 g/mi and the cut-point was 1.08 g/mi). Table 2 summaries the fleet-average
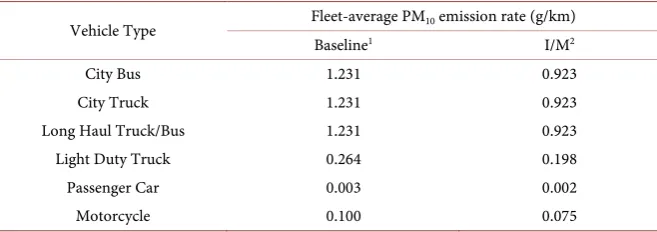
Table 2. Fleet-average PM10 emission rate in the BMR under the baseline and I/M
Scena-rio (Year: 2008).
Vehicle Type Fleet-average PM10 emission rate (g/km)
Baseline1 I/M2
City Bus 1.231 0.923
City Truck 1.231 0.923
Long Haul Truck/Bus 1.231 0.923
Light Duty Truck 0.264 0.198
Passenger Car 0.003 0.002
Motorcycle 0.100 0.075
Notes: 1The baseline emission rates were derived from data published in [9] using PM
10 emission rates in the year 2000 and the assumption that a 5% annual PM emission factor decrease rate for all types of vehicles in the BMR. 2The emission rates under the I/M scenario were calculated as baseline rate × 75%, assuming cut-points equal to 75% of the baseline fleet-average emission rates for each vehicle type.
2A hypothetical example is provided here: Assuming that a vehicle fleet has an average emission rate
DOI: 10.4236/jep.2017.812095 1553 Journal of Environmental Protection PM10 emission rates for various vehicle type under the baseline scenario and the I/M scenario.
EISINGER2005 considered that a small fraction (in the range of 0% - 7.5%) of the initial problem vehicles seek repairs in anticipation of I/M tests, and they were assumed to be “good” vehicles in inspection and pass the I/M test. Al-though the emission reductions resulting from this kind of “pre-test” repairs were taken into account in EISINGER2005, these reductions are only responsible for a small fraction of total emission reduction benefits achieved by I/M pro-grams, approximately ranging from 0% - 2%. It is expected that the fraction of problem vehicles seeking emission repairs before I/M will be even smaller in a developing country than that in the US, given that people are generally less wealthy and less able to afford the costs of maintenance and repairs. For simplic-ity, this study did not consider the emission reductions resulting from pre-test repairs.
3. Results and Discussion
3.1. Estimating Emission Reduction Effectiveness of the
PM-Related I/M Programs in the BMR
Using the “best estimate” values of the variables listed in Table 1 and the esti-mated 2008 vehicle population, emission rates and VKT [9], the “I/M Design” spreadsheet was run for the year 2008. The results show that the PM-oriented I/M programs are expected to reduce total PM10 emissions from motor vehicles in the BMR by 10.6%. Table 3 summarizes the findings.
Therefore, in the “best estimate” case, the proposed PM-oriented I/M pro-grams in the BMR are expected to yield health benefits that exceed the social costs of the programs (the “threshold” for achieving this goal is a 4% overall PM emission reduction achieved by the programs, as found in [9].
3.2. Examining the Roles of Key Design Elements on the Emission
Reduction Benefits of I/M Programs
A series of sensitivity analyses were conducted to examine the sensitivity of the effectiveness of the I/M programs in terms of the percent of overall PM10 emis-sion reduction to the key design elements.
3.2.1. The Effects of Testing Cut-Points on Overall Emissions Benefits
DOI: 10.4236/jep.2017.812095 1554 Journal of Environmental Protection Table 3. Estimated PM10 emission reduction benefits of PM-related I/M programs in the
bangkok metropolitan region.
Vehicle Type
Variables City Bus City Truck
Long Haul Truck/Bus
Light Duty
Truck Motorcycle Total
Percent of all problem vehicles
indentified by I/M (ProbVeh) 45% 45% 45% 45% 45%
Percent of problem vehicles
failed and repaired (PercentRep) 40% 40% 40% 35% 34%
Percent reductions from all problem vehicles, achieved by
post-test repairs (PercentRed) 45% 45% 45% 40% 36%
Percent reductions due to the decrease in vehicle
growth (BenefitsGrow) 0.1% 0.3% 0.3% 1.4% 0.6%
Benefits of post-test
repair wok (BenefitsRep) 17.8% 17.8% 17.8% 13.9% 12.1%
Percent reductions from all problem vehicles due
to scrap (BenefitsScrap) 0.2% 0.2% 0.2% 0.9% 1.6%
Total reductions, as percent of total emissions from all problem
vehicles (BenefitsTotal) 18.1% 18.3% 18.3% 16.2% 14.3%
Total reductions achieved by each type of vehicles
(in tonnes per year) 385 210 75 1253 258 2180
Percent reductions achieved
within each type of vehicles 11.8% 11.9% 11.9% 10.4% 9.2% 10.6%
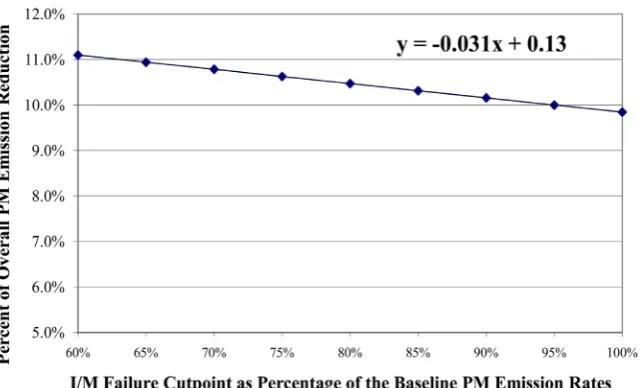
was assumed that slight changes in cut-points do not change the values of the two variables (this may be true in the case that the majority of good vehicles have emission rates much lower than the cut-points, and the majority of prob-lem vehicles have emission rates much higher than the cut-points), so in this case failure cut-points only affect the new emission rates of problem vehicles af-ter repairs and retests. Based on this assumption, a cut-points sensitivity analysis was conducted. Figure 2 shows the results.
DOI: 10.4236/jep.2017.812095 1555 Journal of Environmental Protection Figure 2. Effects of testing cut-points on the percentage of overall emission reduction by I/M programs.
baseline emission rates in this case) only have modest effects on the overall emission reduction benefits (the percent of overall PM10 emission reductions changes from approximately 10% to 11% as the result of changing the failure cut-points from 60% - 100% of the baseline emission rates), because most ve-hicles are considered to emit at levels well outside the range (either higher or lower the cut-points). This study considers that other I/M design elements may have more significant effects on the emission reduction benefits achieved by I/M programs. In general, important variables in I/M design that policy makers need to address include program participation rate, problem vehicle identification rate, effective emission repair rate and problem vehicle illegal operation rate. In the following section, the impacts of these variables on emission reduction were analyzed.
3.2.2. Key Variables Affecting I/M Effectiveness
1) Participation rate and problem vehicle identification rate associated with I/M programs. Participation rate (PartiRate) and problem vehicle identifi-cation rate (IdenRate) are two key elements to address in designing I/M pro-grams. Participation rate represents the levels of program enforcement. A suc-cessful I/M program minimizes vehicle violations (vehicles required by an I/M program do not participate in the program). The “best estimate” case in Section 3.1 assumes the majority (90%) of vehicles in the BMR required by I/M will par-ticipate in the programs, i.e. they will undertake appropriate emission inspection (reasons discussed in Table 1). However, if a large fraction of vehicles subject to I/M tests escape from the inspection process, the emission reduction benefits of I/M are expected to decrease considerably. Problem vehicle identification rate represents the ability of I/M programs to identify vehicles that exceed the emis-sion standards and thus need emisemis-sion repairs.
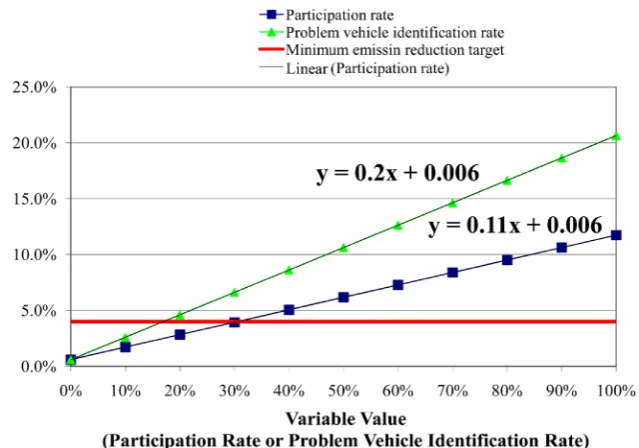
DOI: 10.4236/jep.2017.812095 1556 Journal of Environmental Protection input value of one variable while holding all other inputs constant (presuming that all input variables are independent of each other). The goal is to examine the sensitivity of the percent of overall emission reduction to program participa-tion rate (PartiRate) or problem vehicle identificaparticipa-tion rate (IdenRate). Figure 3 shows the results.
[image:16.595.219.539.466.690.2]The square-marked and the triangle-marked lines represent the percent of overall PM emission reductions achieved by I/M programs as a function of pro-gram participation rate (PartiRate) and problem vehicle identification rate (IdenRate), respectively (as noted in the figure). Each of the two lines was generated by incrementing the value of an individual variable (PartiRate or IdenRate) by 10% at a time (starting from 0% and ending at 100%), while setting all other inputs to their best estimates. And the red solid line represents the minimum percentage of emission reduction required in order for the benefits of the programs to outweigh the costs (the value was 4% as found in [9]).
Figure 3 indicates that both participation rate and problem vehicle identifica-tion rate are important determinants of overall PM emission reducidentifica-tion benefits achieved by I/M programs. For participation rate, when the value of this variable increases from 0% (lower bound) to 100% (upper bound), the percent of overall emission reductions from vehicles increases from 0.6% to 11.7%; for problem vehicle identification rate, the percent of overall emission reductions from ve-hicles increases from 0.6% to 20.6% when the variable’s value changes from the lowest to the highest. Comparing the effects of the two variables in Figure 3 shows that problem vehicle identification rate has a greater impacts on the over-all emission reduction benefits than program participation rate, since for the same increment (e.g. 10%) in the two variables, the incremental emission reduc-tion benefits resulting from the change in the problem vehicle identificareduc-tion rate
DOI: 10.4236/jep.2017.812095 1557 Journal of Environmental Protection are greater.
In order to achieve the goal of 4% PM emission reduction from motor ve-hicles, the participation rate is required to be greater than 30%, if all other inputs remain the same values as in the “best estimate” case. And the requirement for problem vehicle identification rate is 17% when setting the other variables in the spreadsheet to their “best estimate” values.
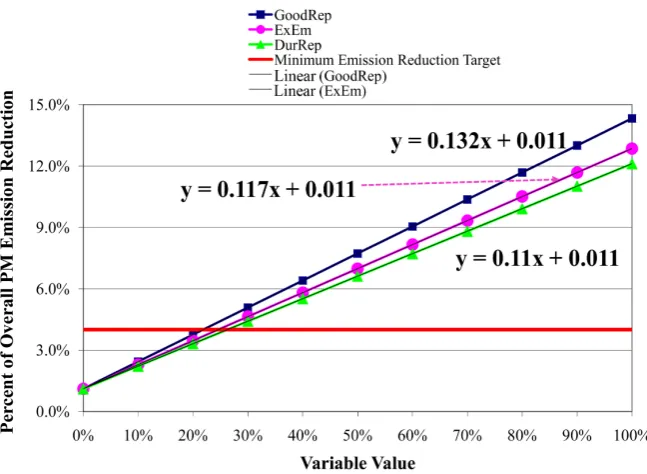
2) The impacts of the effectiveness of problem vehicle repairs. Repairing problem vehicles to meet emission standards is the major source of emission reduction available from I/M programs. Three variables in the I/M Design spreadsheet are related to the effectiveness of repairs: GoodRep—Percent of re-pair work initially effective; ExEm—Percent of excess emissions (emissions above allowable levels) from identified problem vehicles reduced by repairs that properly pass an I/M test immediately; and DurRep—Percent of good repairs that remain durable until the next I/M inspection. Figure 4 shows the impact of each individual variable on the levels of emission reduction achieved by I/M programs.
[image:17.595.211.535.458.695.2]The three marked lines (named as GoodRep, ExEm and DurRep) were gener-ated using the same approach as used to generate Figure 3: Each line is generat-ed by incrementing the value of the individual variable it represents (GoodRep, ExEm or DurRep) by 10% at a time (starting from 0% and ending at 100%), while setting the other inputs to their “best estimate” values. The red solid line also represents the minimum PM emission reduction target of 4%.
Figure 4 illustrates that the increase in the values of any of the three variables related to problem vehicle repairs results in considerable improvement in emis-sion reduction performance by the I/M programs, as these variables are key
DOI: 10.4236/jep.2017.812095 1558 Journal of Environmental Protection determinants of the effectiveness of emission repairs. Comparing the three marked lines in Figure 4 shows that while the same increment in any one of the three variables results in approximately similar incremental emission reduction benefits, the impact of initially effective repair rate (GoodRep) is slightly greater than the impacts of the other two variables. The 4% emission reduction target requires a minimum of 22% of repair work initially effective (GoodRep), or 25% of excess emissions from identified problem vehicles reduced by repairs (ExEm), or 26% of repairs that properly pass an I/M remain durable until the next I/M in-spection (DurRep).
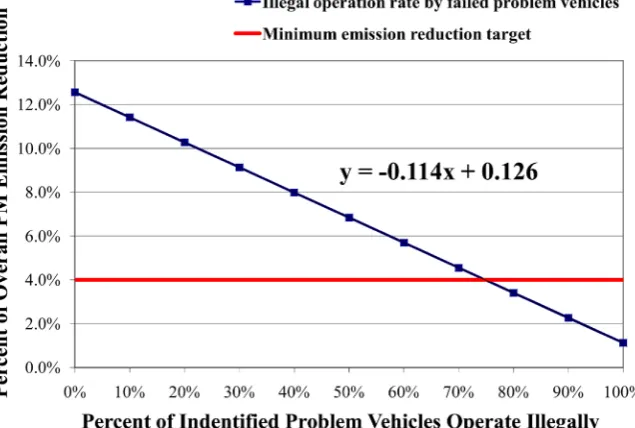
3) The impacts of illegal operation by problem vehicles. Illegal operation here refers specifically to failed vehicles that continue to run on roads without appropriate repairs or certificates of waiver (the variable IllegalVeh in Table 1). There are other types of illegal operation in I/M program implementation. For example, vehicles may run on roads without taking the inspection required by the programs. This latter type of illegal operation is considered in the program participation rate variable, so it is not taken into account here. Illegal operation by failed vehicles may considerably damage the performance of I/M programs, since these vehicles are identified as gross emitters. Using the same sensitivity test approach as in Figures 3-5 was generated, which shows the effects of failed vehicle illegal operation rate on the levels of overall emission reduction achieved by I/M programs.
[image:18.595.215.533.475.689.2]Therefore, the increases in illegal operation rate by failed problem vehicles can substantially reduce the emission reduction benefits achieved by I/M programs. In order to achieve the goal of 4% PM10 emission reduction from motor vehicles, the rate of failed problem vehicle illegal operation should not go over 75%, pre-suming that the performance of the other variables is at the level of the “best
DOI: 10.4236/jep.2017.812095 1559 Journal of Environmental Protection estimate”. In reality, it may be unrealistic to achieve 0% illegal operation by failed problem vehicles. However, minimizing the problem vehicle illegal opera-tion rate is an essential I/M design element to improve the effectiveness of I/M programs.
3.3. Improving the Emission Reduction Effectiveness of I/M
Programs
For the PM-oriented I/M programs in this study, a 25% PM10 emission reduction in the BMR was originally proposed as an upper bound target of the I/M pro-grams based on the past experience of similar propro-grams in the US [9]. Also as discussed earlier, the levels of PM10 emission reductions actually achieved by the programs are significantly uncertain. The results in Figures 3-5 indicate that based on the assumptions made in Table 1, the improvement in the perfor-mance of any individual element is not sufficient to achieve the upper bound target of 25% overall emission reduction initially expected in proposing the pro-grams to be adopted in the BMR.
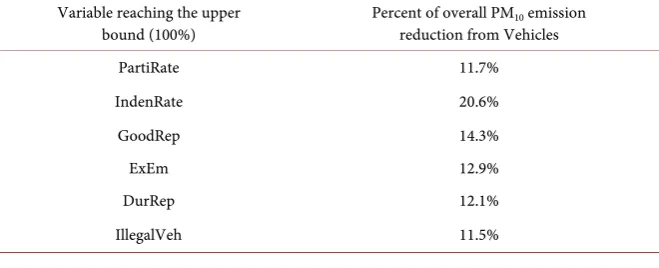
For example, when one of the key variables discussed above reaches the upper bound, i.e. 100% (for IllegalVeh, the upper bound is 0%), while holding the oth-er variables the same as in the “best estimate” case, the poth-ercent of ovoth-erall PM10 emission reduction is summarized in Table 3.
The results in Table 4 show in the case that only one variable in the spread-sheet increases while the values of the others remain the same as assumed in Ta-ble 1, even if the variables achieve complete success, the maximum level of PM emission reduction benefits is 20.6% (when IndenRate reaches 100%). Therefore, the performance of more variables needs to be improved simultaneously.
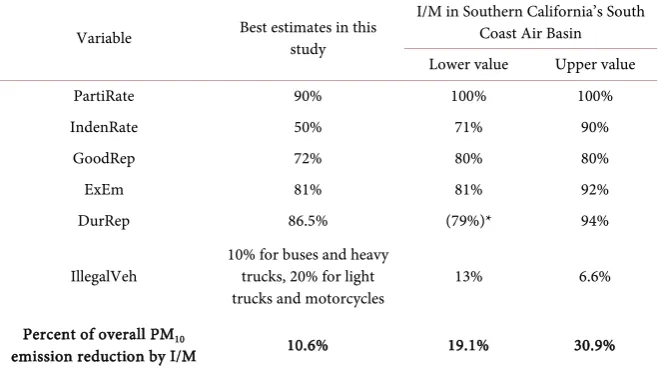
[image:19.595.208.538.596.730.2]As two illustrations, when the values of PartiRate, IndenRate, IllegalVeh, GoodRep, ExEm and IllegalVeh were replaced by the lower levels found in the I/M program in southern California’s South Coast Air Basin [2], the percent of PM emission reduction from motor vehicles increased to 19.1%; and when the values of all the key variables discussed above (PartiRate, IndenRate, IllegalVeh, GoodRep, ExEm, and DurRep) were set to the upper values found in California’s I/M, the percent of PM reduction increased to 30.9%. Table 5 summarizes the
Table 4. Emission reduction benefits in the case that one key variable reaches the upper bound.
Variable reaching the upper
bound (100%) Percent of overall PMreduction from Vehicles 10 emission
PartiRate 11.7%
IndenRate 20.6%
GoodRep 14.3%
ExEm 12.9%
DurRep 12.1%
DOI: 10.4236/jep.2017.812095 1560 Journal of Environmental Protection Table 5. Improving the effectiveness of the I/M Programs in the BMR by increasing the values associated with key design elements.
Variable Best estimates in this study
I/M in Southern California’s South Coast Air Basin Lower value Upper value
PartiRate 90% 100% 100%
IndenRate 50% 71% 90%
GoodRep 72% 80% 80%
ExEm 81% 81% 92%
DurRep 86.5% (79%)* 94%
IllegalVeh 10% for buses and heavy trucks, 20% for light
trucks and motorcycles 13% 6.6% Percent of overall PM10
emission reduction by I/M 10.6% 19.1% 30.9%
*Note: Data in parentheses were not used in the calculation since they are smaller than the “best estimate” in this study.
replaced variable values used and the new emission reduction estimates.
3.4. Emission Reduction Benefits Due to the Change in Vehicle
Population Growth
The “best estimate” in Table 3 was based on the assumption that the implemen-tation of the new PM-related I/M programs causes 10% decrease in average an-nual vehicle growth rate in the BMR [9]. This assumption is associated with the variable BenefitsGrow (the percent of emission reductions achieved due to the changes in vehicle population growth as a result of I/M enforcement). Sensitivity test was conducted by changing the percentage decrease in annual vehicle growth rate from 10% to 0% (no change in the annual growth rate), 20% or 30%, while holding all other input unchanged. Figure 6 summarizes the results.
Past experience in rapidly developing metropolitan areas in Asia shows that the introduction of vehicle I/M programs may slightly slow down the fast growth of motor vehicles in these areas and it is expected that the percent decrease in average annual vehicle growth rate falls into the range of 0% - 30%. Figure 6 in-dicates that the change in the assumption about the percent decrease in annual vehicle growth rate has modest impact on the overall emission reduction bene-fits, when the change falls into the range of 0% - 30%.
3.5. Uncertainty Analysis Results
Ta-DOI: 10.4236/jep.2017.812095 1561 Journal of Environmental Protection ble 6 summarizes the top 10 variables that contribute the most significantly to the uncertainty in the percent of overall PM10 emission reductions. The analysis was conducted using Monte Carlo simulation based on the variable PDFs listed in Table 1, and were performed in the Oracle Crystal Ball software. The sample size was set as 5000.
Table 6 indicates that the problem vehicle identification rate of light-duty trucks showed the greatest contribution to variance. The contribution to va-riance of this premise is large probably both because the overall PM10 emission reductions are sensitive to this variable (as found in Figure 3), and because the
Figure 6. Impact of the change in vehicle growth rate on the overall PM10 emission
re-ductions by the I/M programs.
Table 6. Variables showing the greatest contribution to variance.
Rank Variable Contribution to Variance
1 Problem vehicle identification rate of light-duty trucks (IdenRate) 58.4%
2 Problem vehicle as percent of total PM10
emission of light-duty trucks 10.0% 3 Problem vehicle identification rate of buses (IdenRate) 6.4%
4 Percent of repair work initially effective of light-duty trucks (GoodRep) 5.5%
5 Problem vehicle identification rate of motorcycles (IdenRate) 3.3%
6 Percent of excess emissions reduced by repairs of light-duty trucks (ExEm) 3.1%
7 Problem vehicle illegal operation rate of light-duty trucks (IllegalVeh) 2.4%
DOI: 10.4236/jep.2017.812095 1562 Journal of Environmental Protection uncertainty in this premise is large (falls into the range of 0% - 100%, see Table 1). Moreover, the problem vehicle identification rates of several other vehicle types (buses, city trucks and motorcycles) are also among the top 10 premises that contribute the greatest to the total uncertainty. Therefore, policy design considerations need to focus on increasing problem vehicle identification rate in order to narrow its uncertainty and improve its effectiveness.
3.6. Summary of Sensitivity Test Results
Table 7 summarizes the sensitivity test results. It indicates that the level of PM10 emission reductions available from the I/M programs is the most sensitive to the variable “problem vehicle identification rate (IdenRate)”, since when increasing a variable from its lower limit to the upper limit while holding all the other va-riables constant, the greatest change happened with this variable (increased from 0.6% to 20.6%). Also, the uncertainty analysis demonstrates that the same varia-ble “IdenRate” contributes the greatest to variance. Moreover, the variavaria-bles as-sociated with light-duty trucks play a relatively major role on the effectiveness of the I/M programs due to its role as the largest contribution to total PM10 emis-sions from motor vehicles. These findings suggest that program effectiveness can be improved by narrowing the uncertainty in the problem vehicle identification rate and by identifying a greater percentage of problem vehicles. Also, attention should be directed toward the light-duty diesel vehicle fleet in introducing the programs.
Over all, the sensitivity analysis performed here indicates that, in order to in-crease the problem vehicle identification rate, a key point is to improve testing procedure to maximize the ability of the programs to detect vehicles that need emission repairs. Second, studies have suggested that using more stringent test-ing cut-points can increase the percent of problem vehicles that are discovered by the inspection [2]. Further research on how to maximize the problem vehicle identification rates associated with I/M programs is warranted.
4. Conclusions
DOI: 10.4236/jep.2017.812095 1563 Journal of Environmental Protection Table 7. Sensitivity test of the percent emission reductions to the key design variables.
Variable Estimate Best Test Range Sensitivity
Minimum Performance
to Achieve the 4% PM10
Emission Reduction
Target
Sensitivity Tests Result (Change in %
Emission Reductions)
Failure cut-points
75% of the baseline emission rates
60% - 100% of the baseline emission rates
N/A 11.1% - 9.8%
Program participation rate 90%
0-100%
>30% 0.6% - 11.7% Problem vehicle
identification rate 50% >17% 0.6% - 20.6%
Effectiveness of failed vehicle repairs Percent of repair work initially effective
72% >22% 1.1% - 14.3%
Percent of excess emissions reduced by good repairs
81% >25% 1.1% - 12.9%
Percent of good repairs
that remain durable
86.5% >26% 1.1% - 12.1%
Failed vehicle illegal operation rate 10% for buses and heavy trucks; 20% for light trucks and motorcycles
<75% 1.1% - 12.6%
Vehicle population growth
10% decrease in average annual growth rate under the baseline scenario
0% - 30% decrease in average
annual growth rate
N/A 10.1% - 11.6%
Giv-DOI: 10.4236/jep.2017.812095 1564 Journal of Environmental Protection en this, this study developed a new cost-benefit analysis framework for evaluat-ing the effectiveness of I/M programs. This framework takes into account the ef-fects of various program design considerations, such as program participation rate, identification rate and effective repair rate, on the health benefits of policy implementation, and examines what are the minimum implementation re-quirements that at least ensure the benefits are greater than the costs of imple-menting the programs.
Applying the framework to a PM-oriented I/M program targeting all diesel- fueled vehicles in the city of Bangkok, Thailand, it was found that the health benefits achieved from the program are sensitive to several key program design elements, including participation rate and problem vehicle identification rate, fraction of effective repairs and illegal operation rate. Other variables, such as the testing cut-points and vehicle population growth rate, only have modest ef-fects on the overall emission reduction and consequent health benefits. Overall, the performance of multiple variables associated with I/M program design needs to be improved simultaneous in order to achieve the targeted benefits of the program.
The main limitation of using the new analysis framework to evaluate the ef-fectiveness of the I/M programs is that presently there is very limited informa-tion on the performance of the important program design elements globally. The findings from running the “I/M Design” spreadsheet could be improved when more empirical data worldwide for the input variables are collected. Secondly, one source of emission reductions achieved by the I/M programs is improved maintenance of vehicles in anticipation of the required inspection process, but this kind of emission reduction relative to the baseline is not considered in esti-mating the emission reductions delivered by the programs. This portion of emission reductions can be large for diesel-fueled vehicles since pollution levels from these vehicles are heavily dependent on maintenance, perhaps resulting in an underestimate of the emission reduction benefits of the programs. Given the information gap, further research is warranted to examine the potential emission reductions due to improved maintenance by vehicle owners in anticipation of required I/M testing. Finally, further research needs to concentrate on the ques-tion that how to design and implement a PM-oriented I/M program in order to improve the performance of the key variables found in this study, e.g. the prob-lem vehicle identification rate associated with an I/M program, so that more concrete and practical advice is provided to decision makers based on the theo-retical conclusions of the present study.
References
[1] Posada, F., Yang, Z. and Muncrief, R. (2015) Review of Current Practices and New Developments in Heavy-Duty Vehicle Inspection and Maintenance Programs. The International Council on Clean Transportation White Paper, Washington DC. [2] Eisinger, D.S. (2005) Evaluating Inspection and Maintenance Programs: A Policy-
DOI: 10.4236/jep.2017.812095 1565 Journal of Environmental Protection 147-162. https://doi.org/10.1080/10473289.2005.10464609
[3] National Research Council (2001) Evaluating Vehicle Emissions Inspection and Maintenance Programs. National Academies Press, New York.
[4] Harrington, W. (1997) Fuel Economy and Motor Vehicle Emissions. Journal of En-vironmental Economics and Management, 33, 240-252.
https://doi.org/10.1006/jeem.1997.0994
[5] Beaton, S.P., Bishop, G.A., Zhang, Y., Ashbaugh, L.L., Lawson, D.R. and Stedmam, D.H. (1995) On-Road Vehicle Emissions: Regulations, Costs, and Benefits. Science, 268, 991-993. https://doi.org/10.1126/science.268.5213.991
[6] Sterner, T. (2003) Policy Instruments for Environmental and Natural Resource Management. Resource for the Future Press, Washington DC.
[7] World Bank (2001) Vehicular Air Pollution: Setting Priorities, South Asia Urban Air Quality Management Briefing Note No. 1.
http://siteresources.worldbank.org/PAKISTANEXTN/Resources/UrbanAir/Vehicul arAirPollution.pdf
[8] PA Government Services, Inc. (2004) Vehicle Inspection and Maintenance Pro-grams: International Experience and Best Practices. Report, The US Agency for In-ternational Development Office of Energy and Information Technology, Washing-ton DC.
[9] Li, Y. and Crawford-Brown, D.J. (2011) Assessing the Co-Benefits of Greenhouse Gas Reduction: Health Benefits of Particulate Matter Related Inspection and Main-tenance Programs in Bangkok, Thailand. Science of the Total Environment, 409, 1774-1785. https://doi.org/10.1016/j.scitotenv.2011.01.051
[10] World Bank (2003) Thailand: Reducing Emissions from Motorcycles in Bangkok. Report 275/03, World Bank Energy Sector Management Assistance Programme. [11] USEPA, United States Environmental Protection Agency (2007) Cleaner Diesels:
Low Cost Ways to Reduce Emissions from Construction Equipment. United States Environmental Protection Agency National Center for Environmental Innovation. [12] Crawford-Brown, D.J. (1999) Risk-Based Environmental Decisions: Methods and
Culture. Kluwer Academic Publishers, Boston, MA.
DOI: 10.4236/jep.2017.812095 1566 Journal of Environmental Protection
List of Abbreviations
BMR: Bangkok Metropolitan Region CBA: Cost-Benefit Analysis
CEA: Cost-Effectiveness Analysis CO: Carbon Monoxide
I/M: Inspection and Maintenance NOx: Nitrogen Oxides
HC: Hydrocarbon
PDF: Probability Density Function PM: Particulate Matter
![Figure 1. Sources of emission reductions from I/M programs (Partial information source: [3])](https://thumb-us.123doks.com/thumbv2/123dok_us/48373.504980/4.595.123.537.72.279/figure-sources-emission-reductions-programs-partial-information-source.webp)