WAN, BAOHONG. Traffic Simulation Failure Detection and Analysis. (Under the Direction of Dr. Nagui M. Rouphail.)
Microscopic, stochastic traffic simulation may yield simulation failures under multiple replications. The failed runs are not valid in the estimation of traffic performance and should be excluded from the final simulation output analysis. On the other hand, these failure runs provide important clues to perform a simulation flaw diagnosis. An unconventional failure detection and analysis methodology was proposed to comprise three layers: time series inspection, spatial analysis, and causal analysis. The process of time series inspection traces the variation of indicator variables over the time domain for the purpose of detection of simulation failures. The spatial analysis identifies failure occurrence patterns, and the subsequent causal analysis judge contributing factors to simulation failures using a tabular method in combination with other tools.
A widely-used traffic simulator, CORSIM, is used as the test-bed simulator. Three real-world traffic networks were simulated as the case studies for the proposed method. The study results indicated that the proposed failure detection and analysis method is valid and effective to improve traffic simulation from multiple perspectives. Its application in the evaluation of networks testified its utility in multiple aspects. The proposed procedure helped uncover the existing deficiencies in the current simulation models, and, therefore, provide important guidance for the organized model improvement efforts. On the other hand, the procedure was also applied in the analysis of a projected traffic scenario to testify its value in the identification of critical sites on the network from the traffic engineering perspective.
Traffic Simulation Failure Detection and Analysis
Dissertation
Presented in Partial Fulfillment of
the Requirements for the Degree Doctor of Philosophy
in the Graduate School of
North Carolina State University
By
Baohong Wan, B.S., M.S.
Department of Civil Engineering
North Carolina State University
2004
Approved by
________________________ ________________________
Nagui M. Rouphail Joseph E. Hummer
(Chair of Advisory Committee)
________________________ ________________________
Billy M. Williams Leonard A. Stefanski
VITA
1973 ……….. Born in Shandong, China
1995 ……….. B.S. from Beijing (Northern) Jiaotong University, Beijing, China 2002 ……….. M.S. from North Carolina State University, Raleigh, NC
2004 ……….. Ph.D. from North Carolina State University, Raleigh, NC
PUBLICATIONS
Rouphail, Nagui, B. Wan, and J. Sacks, Micro-Simulation Traffic Model: Failure Detection and Analysis. Proceedings of 2004 Huntsville Simulation Conference. Huntsville, LA. October 2004.
Wan, Baohong, N. Rouphail, Simulation of Pedestrian Crossing in Roundabout Areas Using Arena. Presented in the 2004 Transportation Research Board Annual Meeting, Session 309, Paper No. 04-2252. Accepted for publication in the Transportation Research Record (TRR), Journal of the Transportation Research Board. January 2004.
Wan, Baohong, Empirical Comparison of Simulation Models with Different Input Data Structures. MS Thesis. August 2002. Available as an ETD from NCSU libraries. <
ACKNOWLEDGEMENTS
There are lots of people I would like to thank for a huge variety of reasons.
Firstly, I would like to thank my Supervisor, Dr. Nagui M. Rouphail. I could not have imagined having a better advisor and mentor for my PhD, and for the last four years without his common-sense, knowledge, perceptiveness and cracking-of-the-whip I would never have finished my research and study.
Thank-you to my committee members, Dr. Joseph Hummer (traffic operation and safety), Dr. Billy Willams (ITS) and Dr. Lenard Stefanski (statistics), for managing to read the whole thing so thoroughly, for supporting me academically and technically, and for a surprisingly enjoyable Viva. Special thanks to Dr. Jerome Sacks in Duke University, who has advised and sponsored this entire research.
I would also like to thank all the rest of the academic and support staff of the Institute of Transportation Research and Education, the NCSU Department of Civil Engineering, and the National Institute of Statistical Sciences, particularly those who have put up with my drifting a long way away from my original title.
The most thanks to my family: My wife Qing, and my two-years-old daughter Cassie. Without them I could not have gone thus far in my career and my life.
TABLE OF CONTENTS
List of Tables...…... vii
List of Figures...…... ix
Executive Summary...…... x
Chapter 1 Introduction ...…... 1
1.1 Problem Statement ……….……… 1
1.2 Simulation Failure Study …...……….……… 3
1.3 Analysis of Simulation Failures ……… 8
1.4 Objectives of Research……….………...……… 13
1.5 Organization of the Dissertation ………...………… 14
Chapter 2 Literature Review……….……… 17
2.1 Traffic Anomaly Detection Technologies ………..……… 17
2.2 Simulation Failure Research ………...……… 22
2.3 Summary of Literature ...………...………….. 25
Chapter 3 Methodology ……….………...……… 28
3.1 Overview ……….………..………..………… 28
3.2 Data Preparation ………..………. 30
3.3 Layer 1: Time Series Inspection……...………. 35
3.4 Layer 2: Spatial Analysis ……… 41
3.5 Layer III: Causal Analysis ………..……… 43
4.1 CORSIM Simulator ……… 51
4.2 Methodology Implementation with CORSIM …...………. 59
4.3 Case Studies ………..……….. 65
Chapter 5 Evaluation of Simulators ………... 67
5.1 Simulator Description and Study Design ……… 67
5.2 CORSIM 4.32 Results ………... 75
5.3 CORSIM 5.0 Results ………... 78
5.4 CORSIM 5.1 Results ………... 80
5.5 Summary and Discussion ………... 83
Chapter 6 Evaluation of Networks I: PM Chicago Network ……… 85
6.1 Network Description and Study Design ………. 83
6.2 Base Network Study ………... 88
6.3 Sensitivity Test for Failure Mitigation ….………... 97
6.4 Tuned Network Study …..………... 109
6.5 Summary .……… 112
Chapter 7 Evaluation of Networks II: AM Chicago Network ……….. 114
7.1 Network Description and Study Design ………. 114
7.2 Base Case Study ………... 116
7.3 Tuned Case Study ………... 119
7.4 Test Case Study ………... 121
7.4 Supplemental TIP Study ………... 126
Chapter 8 Evaluation of Networks III: NCSU Campus Network ………. 131
8.1 Case Study Description ………... 131
8.2 Initial Case Study ………... 135
8.3 Base Case Study ………..………. 139
8.4 Adjusted Case Study…….………... 142
8.5 Tuned Case Study ………... 145
8.5 Summary ………. ……... 155
Chapter 9 Synthetic Summary of Application Results ………. 158
9.1 Summary of Results …….………... 158
9.2 Findings and Conclusions ………... 164
9.3 Limitations and Further Actions ……..………170
Chapter 10 List of References ………... 166
Appendix 1: Case Simulation Input Files………... 178
LIST OF TABLES
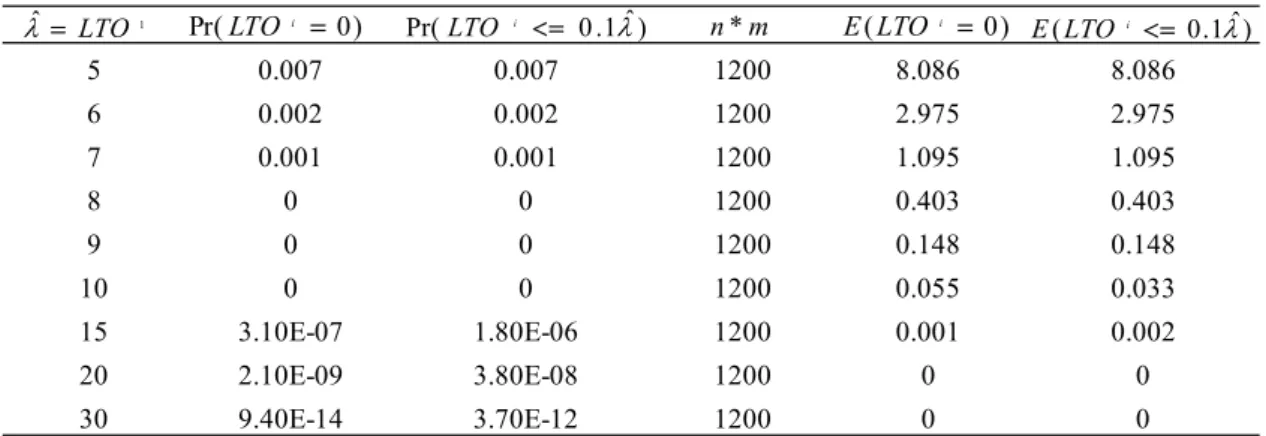
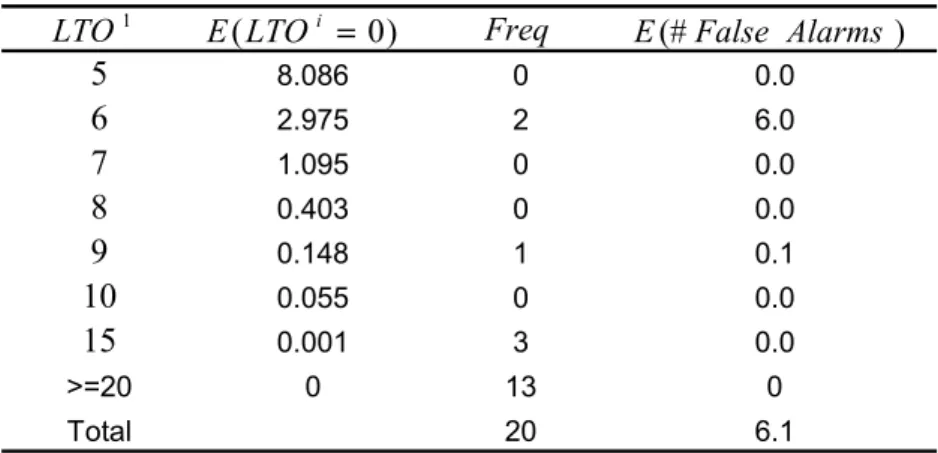
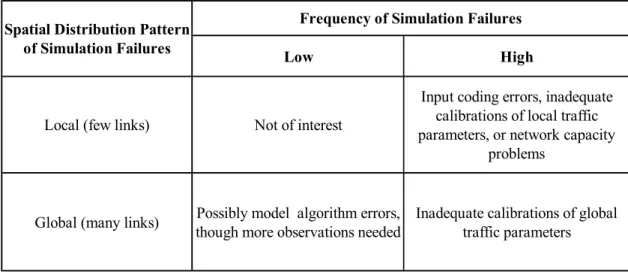
3.1 Probability Values of LTO for Various First Interval Vehicle Counts 39 3.2 Example Calculation of the Expected Number of False Alarms 40 3.3 Exploratory Causal Analysis with Simulation Failure Occurrence Patterns 44 3.4 Summary of Detailed Simulation Failure Causal Analysis 48
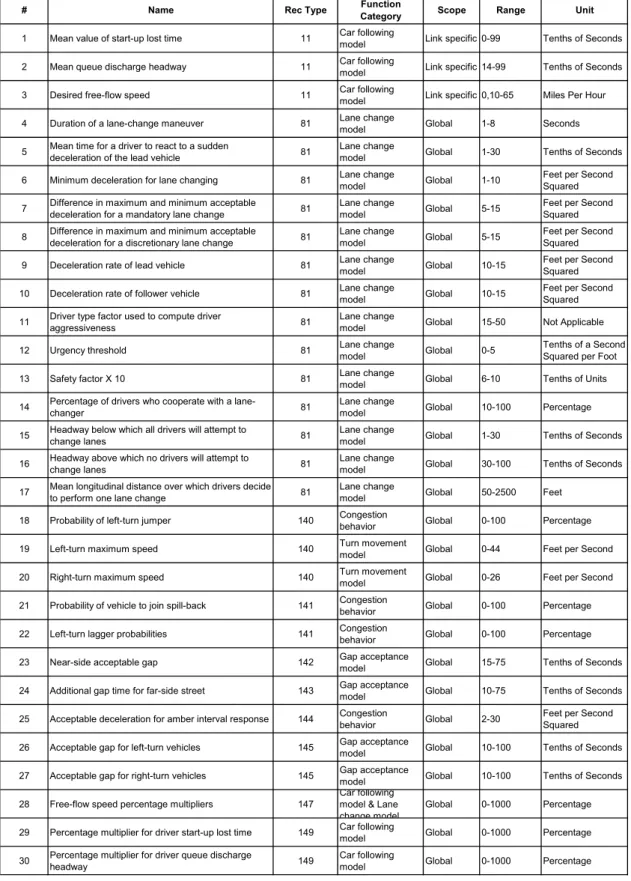
4.1 Key Driver Behavioral Parameters in CORSIM 59
4.2 Selected Driver Behavior Parameters for Sensitivity Test 65
5.1 Study Design Regarding Three Recent CORSIM Releases 74
6.1 Critical First-Failing Links in the Base Case Study 95
6.2 Critical First-Failing Nodes in the Base Case Study 95
6.3 Key Behavioral Parameters Chosen for Failure Mitigation Study 100
6.4 Two Dimensional Projection of the SLTxQDH Design 102
6.5 Experimental and Regression Results in Local Parameter Studies 103
6.6 SAS Analysis Results in the Local Parameter Test 104
6.7 Design Values in the Test of Global Variation Parameters 107 6.8 Experimental and Regression Results in the Global Parameter Test 108
6.9 SAS Analysis Results in the Global Parameter Test 109
6.10 Critical First-Failing Links in the Tuned Case Study 112 6.11 Critical First-Failing Nodes in the Tuned Case Study 112
7.1 Critical First-Failing Links in the Base Case Study 119
7.2 Critical First-Failing Nodes in the Base Case Study 119
7.3 Critical First Failing Links in the Test Case Study 124
7.5 Critical First Failing Links in the TIP Case Study 128
7.6 Critical First Failing Links in the TIP Case Study 129
8.1 Critical First-Failing links in the Initial Case Study 138 8.2 Critical First-Failing Nodes in the Initial Case Study 139
8.3 Critical First-Failing Links in the Base Case Study 142
8.4 Critical First-Failing Nodes in the Base Case Study 142
8.5 Critical First-Failing Links in the Adjusted Case Study 145 8.6 Critical First-Failing Nodes in the Adjusted Case Study 145 8.7 Critical First-Failing Links in the Tuned Case Study 155 8.8 Critical First-Failing Intersections in the Tuned Case Study 155
9.1 Summary Results in the Evaluation of Simulators 160
9.2 Summary Results in the Evaluation of Chicago PM Peak Network 161 9.3 Summary Results in the Evaluation of Chicago AM Peak Network 162 9.4 Summary Results in the Evaluation of NCSU Campus Network 164
LIST OF FIGURES
3.1 Multilayer Simulation Failure Analyses 28
3.2 Relationships between LTI, LTO and MTO 33
4.1 Simulation Process in CORSIM 54
4.2 Flowchart of Simulation Failure Detection Process in CORSIM 63
5.1 Test-bed Network in Chicago 72
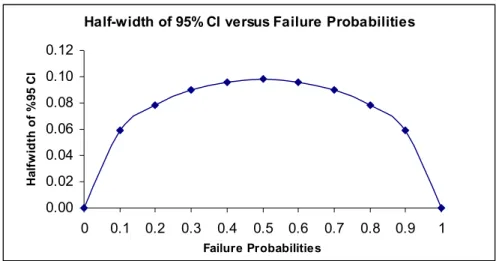
5.2 Half-width of 95% CI versus Failure Probabilities 76
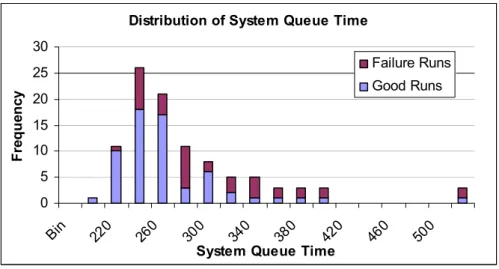
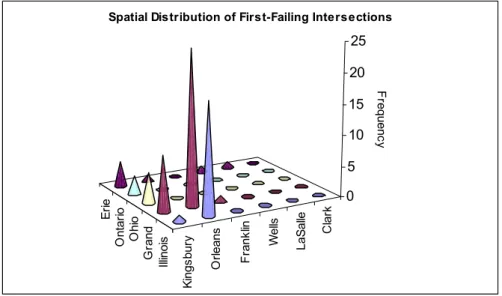
5.3 Distribution of System Queue Time in CORSIM 4.32 Simulation 77 5.4 Distribution of First-Failing Intersections in CORSIM 4.32 Simulation 78 5.5 Distribution of System Queue Time in CORSIM 5.0 Simulation 80 5.6 Distribution of First-Failing Intersections in CORSIM 5.0 Simulation 81 5.7 Distribution of System Queue Time in CORSIM 5.1 Simulation 82 5.8 Distribution of First-Failing Intersections in CORSIM 5.1 Simulation 83
6.1 Link-Node Map of the Chicago Simulation Network 87
6.2 Distribution of SQT in the Base Case Simulation 90
6.3 Snapshot of Failure Detection Output in the Base Case Study 92 6.4 Classified Distribution of SQT in the Base Case Study 94 6.5 Spatial Distribution of First-Failing Nodes in the Base Case Study 96 6.6 Distribution of SQT in Simulation with Adjusted Parameters 111
6.7 Spatial Distribution of FFF on the Tuned Network 113
7.1 Illustration of Demand Changes between AM and PM Periods 115
7.2 Distribution of SQT in the Base Case Simulation 118
7.4 Distribution of SQT in the Tuned Case Simulation 121 7.5 Effect of Traffic Demand Growth on Simulation Failures 123
7.6 Distribution of SQT in the Test Case Simulation 124
7.7 Spatial Distribution of the First Failure Frequencies in the Test Case Study 126 7.8 Distribution of System Queue Time in the TIP Case Study 128 7.9 Spatial Distribution of the First Failure Frequencies in the TIP Case Study 129
8.1 Link-Node Map of the NCSU Campus Network 133
8.2 Distribution of SQT in the Initial Case Simulation 137
8.3 Spatial Distribution of the First Failure Frequencies in the Initial Case Study 139
8.4 Distribution of SQT in the Base Case Simulation 141
8.5 Spatial Distribution of the First Failure Frequencies in the Base Case Study 142 8.6 Distribution of SQT in the Adjusted Network Simulation 144 8.7 Spatial Distribution of the First Failure Frequencies in the Adjusted
Case Study 146
8.8 Effects of SLT, QDH, and SbPr Test 148
8.9 Effects of Critical Gap Test 149
8.10 Effects of Roundabout Circulating Speed Test 150
8.11 Effects of Roundabout Circulating Lane Width Test 152
8.12 Effects of Pullen Free Flow Speed Test 153
8.13 Distribution of System Queue Time in the Tuned Case Study 154 8.14 Spatial Distribution of the First-Failing Intersections in the Tuned
EXECUTIVE SUMMARY
Microscopic, stochastic traffic simulation may yield unrecoverable traffic gridlock (referred to as simulation failures in this research) under multiple replications. The failed runs are not valid in the estimation of traffic performance and should be excluded from the final simulation output analysis. On the other hand, these failure runs provide important clues to perform a simulation flaw diagnosis.
The detection and diagnosis of failure runs is a challenging task, particularly when conducting a large number of replications. In contrast to the traditional methods of failure detection, we propose a times series analysis method to identify the occurrence of simulation failures through traffic flow anomaly detection. The observed phenomenon is a severe malfunction of one or more internal traffic links where outgoing vehicles can no longer discharge.
Once failure replications are identified, they are examined to determine the contributing factors to their occurrence. These factors can be attributed to three components, namely simulator-related, simulation-related, and network-related. If the right category can be determined, users can take appropriate actions to mitigate simulation failures by rectifying the choice of simulator (for simulator-related factors), improving user modeling process (for simulation-related factors), or proposing traffic improvement plans (for network-related factors).
spatial analysis. The process of time series inspection traces the variation of indicator variables over the time domain for the purpose of detection of simulation failures, while the spatial analysis identifies failure occurrence patterns and is the basis for the subsequent causal analysis using a tabular method.
A widely-used traffic simulator, CORSIM, is used as the test-bed simulator. Hence, the proposed methodology is actually implemented with CORSIM’s particular features. Three real-world traffic networks were simulated as the case studies for the proposed method. The first and the second network were geometrically identical to each other, except that they had different traffic demand features and traffic control plans. The first network testified to the utility of the failure detection method as a pre-calibration procedure, while the second network demonstrated its application for the purpose of network analysis. The third network had considerably different features from the previous two networks in both geometry and traffic demand features. These differences enabled us to test the transferability of the method between different networks.
The study results indicated that the proposed failure detection and analysis method is valid and effective to improve traffic simulation from multiple perspectives. Its application in the evaluation of networks testified its utility in the analysis of simulator features. In the network studies, the proposed procedure helped uncover the existing deficiencies in the current simulation models, and, therefore, provide important guidance for the organized model improvement efforts. Assuming a valid model and a competent simulator, the procedure was applied in the analysis of a projected traffic scenario to
testify its value in the identification of critical sites on the network from a traffic engineering perspective.
In conclusion, the method is valid and effective to help simulation users and model developers alike to identify existing flaws and deficiencies in the simulator, the modeling process, and the study network. The current findings led us to believe that continuing research along this direction is necessary and rewarding.
CHAPTER 1: INTRODUCTION
1. 1 Problem Statement
Simulation is a key tool widely used in transportation engineering analyses. In order to properly reflect the random nature of traffic in the real world, most microscopic simulations are stochastic in nature. That is, traffic movements are described by statistical distributions as opposed to having fixed values. Correspondingly, repeated runs are necessary to explore the behavior of the system being studied.
Reliable use of traffic simulations is limited by a lack of methods for the assessment of their validity. Decision-makers frequently ask: can simulation fully represent the real world traffic situations? The answer to such a sweeping request is usually “no” (Bayarri, et al., 2002). Nevertheless, simulation can be used for making reliable predictions of traffic performance in particular settings.
When a simulation needs a large number of replicates, the problem becomes more complicated since some replications may result in unrealistic traffic congestion (herein called simulation failures). Obviously these failure runs (runs containing simulation failures) should be excluded from a traditional statistical analysis for the estimation of means and variances of particular traffic performance measures. Further, the occurrence of simulation failures may indicate flaws in the simulator or unaccounted factors in the simulation. The question is then how to sort out the possible explanations for these. Specifically:
2) How can the consequences of simulation failures be addressed?
Detection and analysis of simulation failures should be a primary task in the successful use of traffic simulation. However, traditional traffic simulations are incapable of executing process surveillance and control in this field. Observation of animation files is commonly used to diagnose simulation. However, with the increased use of a large sample size, animation observation of many replicates may turn to an infeasible task.
This research is intended to providing quantitative solution paths for these questions. Specifically, the phenomena of simulation failures are to be studied to clarify the definition and patterns of them. In contrast to traditional methods (such as animation observation, etc.), a new method is to be devised that utilizes time histories of measured traffic variables to detect traffic anomalies for each simulation replication. This method identifies 1) the occurrence of failure and 2) the time of occurrence. The failure occurrence patterns are then aggregated across replications to derive 3) the critical places of failure occurrence. Occurrence patterns including factors 1), 2) and 3), are to be analyzed in an attempt to relate failures to potential contributing factors.
The significance of this research is threefold. First, successful detection of simulation failures can help simulation users to ascertain the validity of stochastic simulations and, therefore, improve the quality of simulation analysis by excluding bad data. Second, successful analyses of unexpected simulation failures (failures due to user/simulator errors) can provide hints to improve simulation by uncovering existing problems in the model and its use. Finally, successful analyses of expected simulation failures (failures
due to network capacity problems) can provide an alternate approach to the analysis of transportation capacities, which is often one of the major objectives of a simulation study.
1.2 Simulation Failure Study
Definition of Simulation Failures
To clarify the scope of this study, we define simulation failures as follows. In a stochastic traffic simulation, traffic gridlock may appear at one or more locations in the network. If these traffic gridlocks cannot recover in a reasonably short period, incoming traffic to the problem areas will contribute to added congestion and finally form “permanent” gridlocks on the network. Since the occurrence of permanent gridlocks contradicts engineering knowledge of real world traffic behavior, it is seen as unusual and referred to as simulation failures.
Simulation failures can be caused by a variety of factors, such as simulator algorithms, user coding errors, inadequate calibration, network capacity limits, etc. According to these different possibilities, the occurrence of simulation failures can be seen as unexpected and expected. Different contributing factors call for different user actions, as described below.
If the subject network under study is known to have no traffic gridlocks, the occurrence of simulation failures is seen as unexpected. In this case, failure occurrence is mostly due to inadequate, inaccurate, or even incorrect information in the process of simulation model development. Accordingly, the analysis of unexpected simulation failures is
intended to locate the contributing factors of simulation failures. The elimination of these factors can help to improve the validity of the subject simulation model.
On the other hand, if the subject network is known to have capacity problems, the occurrence of simulation failures is seen as expected. In this case, the goal of failure analysis is to find out critical locations on the network that are experiencing capacity problems, based on which specific traffic improvement plans can be proposed to rectify them.
Basic clues about the expectations of failure occurrence are obtained from the status of the subject simulation. Conventionally, the procedure of traffic simulation contains a series of stages such as simulator selection, data preparation, model construction, model calibration, model validation, and model application. If failures occur in an early stage of simulation (e.g., prior to model calibration), users should first assume the occurrence of simulation failures as unexpected, and then utilize the failure analysis results to improve their modeling efforts. In the study of a late stage simulation model, by contrast, users should assume the model as correct, and attribute simulation failures to capacity problems of the study network.
In reality, however, the occurrence of simulation failures is mostly due to a combined effect. That is, part of simulation failures is due to inadequate or incorrect modeling efforts, while others may be due to the network capacity problems. This is a common situation when an insufficiently calibrated model is used to predict a projected traffic scenario. In such cases, the failure occurrence patterns need to be studied to associate
them to different possible causes. This process begins with and is based on the successful detection of simulation failures.
Detection of Simulation Failures
By definition, simulation failures are both error-inducing and irrecoverable. Thus, the occurrence of simulation failures will yield invalid results in a stochastic simulation. Successful detection of simulation failures, therefore, can be used to refine a simulation by identifying these failures and evaluate the impact of them.
Use of conventional methods (such as animation observation) is infeasible if there are many replications to examine. In this research, we propose a new method to utilize the time histories of key link performance in order to quantitatively identify the occurrence of simulation failures. The proposed method and two conventional methods are discussed below.
Animation Observation
Modern simulators are typically equipped with animation tools to allow for a visual examination of vehicle trajectory details. With a close examination, users can utilize these simulation animations to visually identify traffic anomalies and simulation failures in a simulation. However, when a stochastic simulation requires a large sample size, it is tedious and laborious to visually examine the extensive animations for all replications.
Further, in case of a large sample size simulation experiment, batch-mode running is frequently used to accelerate the simulation process by skipping the generation of large animation files. In this case, the method of animation observation consumes simulation
efficiency since analysts need to re-run the simulation in a normal mode using saved random number seeds.
In all, for a large-sample-size simulation, animation observation is not considered a practical approach since simulation animations are not only hard to generate, but also difficult to analyze. On the other hand, simulation animations are typically considered the “reality” of simulation. Observation of them is often seen as the final and most reliable way to solve any complicated problems in simulation. Therefore, when the occurrence of simulation failures is detected using another method, animation observation can serve as a supplementary tool for the purpose of failure analysis
Outlier Detection
The second method, outlier detection, identifies simulation failure runs by finding out their corresponding distributional outliers during the process of simulation output analysis. The success of this method is based upon the assumption of a one-to-one correspondence between failure replications and outlier data in simulation outputs. In other words, the outlier detection method assumes that all failure runs generate outlier simulation outputs, and, conversely, all outlier simulation outputs are generated by these failure runs. As long as this assumption holds true, failure runs in a simulation can be identified using this method.
The techniques of outlier detection are mature in the sense that there are currently some standard statistical methods, such as Dixon’s Test (e.g., Han, 2001), etc., that are readily available for the detection of distributional outliers. Other simplified methods exist, as well. For example, as an effective and easy-to-apply approach, a histogram can be
constructed to allow for the visual identification of outliers on a graphical plot.
Although the method of outlier detection is straightforward and easy to apply, its disadvantages are obvious as well. First of all, the outlier detection method is only capable of identifying failure replications. It needs supplementary methods to locate the site and the onset time of failure occurrence. Thus, the method alone is incapable to execute a high-level causal analysis which is based on such information.
Also, the assumption that the method is based upon is sometimes unrealistic. For example, simulation failures may occur very late in a simulation period; in such cases, they may have only minimal effects on the final simulation outputs (appearing not to be outliers). Conversely, some non-failure simulation runs may generate very poor traffic performance (appearing to be outliers) simply because of the coincidence of some adverse factors. The method of outlier analysis is inflexible in differentiating these extreme situations since it is based on the analysis of final simulation outputs only. Thus, this method would generate inaccurate results if such cases exist in a simulation.
Traffic Anomaly Detection
By definition, the occurrence of simulation failures can be signaled by unrecoverable traffic gridlocks that will result in abnormal traffic behaviors (e.g., severe vehicle blockages, low speeds, fewer trips, high traffic densities, etc.) in the problem areas. Thus, the occurrence of simulation failures can be indicated by the onset of such traffic anomalies. In light of this, we propose a method of traffic anomaly analysis to detect simulation failures by identifying abnormal traffic performance at specific times and locations.
In essence, the method of traffic anomaly analysis traces the time history of selected indicator variables, and relates changes in an indicator variable to the occurrence of simulation failures. With the setting of appropriate indicator variables, once a detection function is satisfied, simulation failures will be reported.
Standard methods for detecting a change in a time series (e.g. Law & Kelton, 2000) may be useful in detecting traffic anomalies, but the role of such methods here is unclear. This is largely because of the complications of traffic networks where the space-time interactions and dependencies need to be considered among the multiplicity of performance measures at the link level. In this research, a series of thresholds are derived directly from the definition of simulation failures, and from the intention to avoid pitfalls of false alarms. These thresholds are then used to formulate a mathematical function that is able to identify the occurrence times and locations of simulation failures in a quantitative way.
One concern of the method of traffic anomaly analysis is that it may require substantial computation. This is due to the complexities in data acquisition (the derivation of traffic performance data at a specific resolution of time and space) and anomaly analysis (automatic analysis of variations of an indicator variable over time). As long as the application procedure is standardized, a computer program can be coded as an application program interface (API) for traffic simulation to save user calculation efforts.
1.3 Analysis of Simulation Failures
Since the occurrence of failures in a simulation model often implies the presence of unaccounted factors in it, once simulation failures are detected, the analysis of them can
provide an important approach to the flaw diagnosis of the simulation. Specifically, an effective simulation failure analysis can help users to improve simulation development and/or to enhance network analysis by identifying the different contributing factors of simulation failures. The key to perform such an analysis is to sort out the possible causes of simulation failures.
Causes of Simulation Failures
There are a variety of contributing factors that can lead to simulation failures. In general, these factors are classified into three categories, simulator-related, simulation-related, and network-related. The details of these categories are discussed below.
Simulator-Related Factors
Simulator-related factors refer to the errors and limitations of the traffic model algorithms in a simulator. These factors are often pre-decided and unchangeable once users have chosen a simulator. Thus, the choice of simulators often predetermines the role of simulator-related factors in the process of failure analysis for a traffic simulation.
Choosing an appropriate simulator is not as simple as it appears. Currently there are many simulators available in the field of traffic simulation. These simulators are based on different traffic flow theories and, therefore, can result in different results when modeling the same traffic phenomena. It is the user’s responsibility to understand the features of each simulator and apply them wisely. In the process of choosing a simulator, major considerations include the modeling capabilities of a simulator, current traffic data availability, the cost of simulation, individual experience, etc. In fact, it is rare for users
to find an ideal simulator that can satisfy all their requirements. Consequently, users often need to seek a balance between different considerations.
Once a simulator is chosen, users should be aware not only of the strengths of the simulator, but also of its weaknesses. For example, one known constraint of a widely-used simulator, CORSIM (CORridor SImulation Model), is its inability to simulate roundabouts. On the other hand, CORSIM is favorable to many simulation users since it allows for inputting traffic demand in the form of traffic counts, which is relatively inexpensive and easy to collect in the field. If users decide to use CORSIM because of the data availability in the field, they may have to approximate the geometry of a roundabout and its operation by modeling several consecutively curved links and intersections.
User knowledge about a simulator is mainly acquired through user experience and a review of the literature. Once users decide to use a simulator, they may have already been familiar with its strengths and weaknesses. In case that any unusual phenomenon occurs in a simulation run, users can easily judge the likelihood of simulator-related contributing factors based on their knowledge in this field.
Simulation-related Factors
Simulation-related factors refer to incorrect or inadequate modeling during the process of simulation model development. Some common factors in this category include data collection errors, incorrect coding, inadequate calibration, etc. Correspondingly, the analysis of simulation failures can serve as an important tool to locate these contributing factors, and their removal can enhance the validity of any subsequent process (e.g.,
output analysis) in a simulation.
It is noted that lack of knowledge about traffic behavior is often the most common reason to lead to a poorly calibrated simulation. Simulation failures may occur as the result of it. Also, traffic simulation is such a complicated process that users often need to define multiple driver and vehicle parameters at the same time. Most simulators fail to provide guidance for the calibration of traffic parameters. When multiple parameters have a common effect on the same traffic behavior model, the problem of choosing the right parameters alone may become over complicated for normal users.
The analysis of simulation-related factors can be assisted by observing different patterns of failure occurrence. For example, if simulation failures are caused by the incorrect coding of a local element (e.g., number of lanes on a link), they are most likely to focus on the miscoded link. By contrast, if simulation failures occur as the result of insufficient calibration of global parameters (e.g., left-turn gap acceptance parameters), they are expected to occur at intersections throughout the network if their performance is affected by these inappropriate parameters.
Network-Related Factors
Network-related factors refer to capacity constraints on the study network, which may be caused either by inadequate network geometry, or by a high level of projected traffic demand. These factors are commonly seen in simulation practice, particularly when simulation is used to predict traffic performance in a projected traffic environment. The analysis of factors in this area, thus, can help users gain awareness of the capacities of the study network, which forms the basis for the development of traffic improvement plans
(TIP).
In the study of a traffic network, it is an important task for simulation to identify a marginal demand level which denotes the capacity of the network. Under such a demand level, simulation failures are very likely to occur at the bottleneck areas on the network. Based upon such a failure analysis, users can then propose specific traffic improvement plans to improve these discovered bottleneck areas. Thus, failure analyses can benefit traffic engineers in answering at least two important questions: 1) under which circumstances should a traffic improvement plan be implemented; and 2) where should a traffic improvement plan be aimed at?
In summary, traffic simulation failures may be caused by a variety of contributing factors. In order to distinguish between these factors and use the information to benefit simulation development and network analysis, a causal analysis should be performed based on failure occurrence patterns, as discussed in the next section.
Causal Analysis
The fundamental motivation for a causal analysis is to determine the categories of contributing factors based on the failure occurrence patterns, specifically, the types, time, and locations of failure occurrence discovered in the stage of failure detection.
It is noted that simulation failures often result in vehicle spillback and cause vehicle blockages at many locations in a relatively short time. In order to identify the most critical link(s) among them, the time sequence of failure occurrence on these links should be analyzed first. As a general rule, those locations that have the earliest failure
occurrence will contain the most relevant information about simulation failures. An aggregation of the failure leading frequencies of these critical locations can then be performed across replications. Finally, a spatial distribution of critical sites can be derived upon which judgment of failure causes can be made.
The spatial distribution of simulation failure initiation locations is able to provide important hints about the types of simulation failures and their causal factors. For example, the above-mentioned simulator-related causes often lead to a scattered pattern of the critical failure-leading (in the time domain) sites, while a network-related cause typically leads to origination of simulation failures at critical links and corridors only. In consideration of this, a tabular method is a good way to summarize different failure contribution factors together with the likely features of their resulting failure occurrence patterns. The details of this approach are discussed in the methodology chapter.
1.4 Objectives of Research
The major technique used in this research is traffic anomaly detection that analyzes time histories of key link performance in order to detect simulation failures. A follow-on spatial analysis is then proposed to accumulate failure occurrence frequencies over critical network sites. The information gathered is used as the basis to execute a causal analysis that is aimed at diagnosing the contributing factors of failure occurrence. The final goal is to utilize the failure analysis results in order to effectively improve simulation development and network analysis, the immediate purpose being the mitigation of any unexpected failure occurrence.
output data. This brings in the possibility of an advanced failure analysis without considering the cost of data collection. Another advantage of simulation is its ability to duplicate an experiment even with the application of different test procedures. In this research, this denotes the availability to testify the effectiveness and features of the proposed detection method.
Specifically, the objectives of this research are listed below.
1. Develop a failure detection method that is practical, effective, and efficient;
2. Compare the proposed failure detection method with traditional methods, including animation observation and outlier detection, to demonstrate its advantages and weaknesses;
3. Develop a method that can effectively derive failure patterns and diagnose the contributing factors of failure occurrence;
4. Identify the role of the failure detection method in the framework of a conventional simulation process, particularly with the issues of simulation verification and validation;
5. Apply the methods to specific cases, summarize application results, and develop conclusions and recommendations for further research.
1.5 Organization of the Dissertation
This dissertation paper is currently comprised of ten chapters. The research problem has been introduced in Chapter One. Other highlights in this chapter include an overview of the study problems as well as a definition of research objectives.
A literature review is described in Chapter Two. Literatures from two fields are respectively discussed: the first covers existing techniques in the field of traffic anomaly detection in several analogous problems, and the second is about emerging research in the detection and analysis of simulation failures within the large framework of simulation model validation and verification.
Chapter Three focuses on the description of the proposed methodology, which is categorized into three layers: a time series inspection, a spatial analysis, and a causal analysis.
The implementation of the proposed method is introduced in Chapter Four. The test bed simulator chosen is CORSIM. Therefore, the realization of the method implementation is illustrated with the particular features of CORSIM simulator.
Chapter Five demonstrates an application of the proposed methodology in the evaluation of simulators. This is illustrated by comparing different versions of CORSIM, which has undergone significant upgrading in some of its traffic behavior models.
The study results of two case study networks are discussed in Chapters Six and Severn. These case studies consider a sub-network of downtown Chicago in the PM and AM peak, respectively. Chapter Eight discusses the application of the method to a different network on the NCSU campus in order to test its transferability across various networks. Each of the three chapters includes a discussion of the network features, a description of the case study design, the case study results, and a summary and discussion of these results.
evaluation, summarizes key research findings, and provides research conclusions and recommendations for the future research.
Chapter Ten includes a list of bibliography. The appendices of this dissertation include VBA program codes, and three CORSIM input files that have been used in the case studies in this research.
CHAPTER 2: LITERATURE REVIEW
The literature review is carried out in two areas. The first one focuses on existing traffic anomaly detection technologies in some analogous fields to this research. It provides a technical background for the development of an effective failure detection methodology in this research. The second covers current research efforts in the field of simulation failure detection and analysis. It clarifies the role of failure detection and analysis in a framework of simulation validation and verification.
2.1 Traffic Anomaly Detection Technologies
Traffic anomaly detection is a predominant task in the field of network surveillance and management. Successful traffic anomaly detection has many meaningful applications in the studies of different types of traffic networks. In particular, traffic gridlock detection in communications networks and traffic incident detection in transportation networks have many similarities to the flaw detection issues addressed here. These problems are analogous to our study problem in the sense that the study objects are similar and the objective is analogous in detecting and diagnosing the anomalies. Thus, successful traffic anomaly detection technologies in these fields can provide useful hints for the development of a general, effective failure detection technique.
In all, the literature review focuses on three analogous problems including traffic gridlock detection (in the study of communication networks), traffic incident detection (in the study of transportation networks), and network breakdown analysis (in the study of transportation networks). These are discussed below.
Traffic Gridlock Detection
The emergence of large-scale computer networks has incurred an increasing demand of telecommunications between computer networks. However, the possibility of traffic gridlocks poses a potential threat to the reliability of these communication networks. Challenged with this problem, computer scientists have initiated many research efforts in the area of effective detection and prevention of traffic gridlocks.
Since visualizations are virtually impossible in communication networks, quantitative methods have played a primary role in the surveillance of communication traffic. In practice, most communication networks collect passive measurements of traffic at routers and switches. These passive traffic volumes at key points comprise the basic input for traffic gridlock detection technologies. As a result, the gridlock detection studies identify the onset of traffic gridlocks by tracing traffic anomalies during the process of data analysis.
With the passive traffic flow available, different analysis approaches have been researched to realize effective detection. The primary ones include 1) sample statistics, 2) time-series analysis, and 3) wavelet analysis methods.
One example of sample statistics methods is due to Feather, et al. (1993), who showed in their research that network faults can be detected by analyzing the statistical deviations of network traffic from regularly observed behavior. In the class of time series analysis methods, Brutlag (2000) performed an example study in which he derived a series of gridlock detection thresholds based on the exponential smoothing and Holt-Winters forecasting techniques. These thresholds were then applied in a time series model which
can successfully detect aberrant network behaviors using them. Barford, et al. (2002), as an illustration of the wavelet analysis techniques, similarly developed a detection mechanism based on the methods of time series and wavelet analysis. His method relies on the information of flow levels and frequency characteristics.
In summary, most traffic anomaly detection techniques use the measure of traffic volumes as the basic indicator variable in their detection models. This is related to the limited data availability in communication networks. Nevertheless, the sucessful applications of these technologies have shown that the analysis of traffic flow quantities is adequate to distinguish the occurrence of traffic anomalies and detect the onset of traffic gridlocks.
Traffic Incident Detection
The second analogous problem, incident detection, represents an important study field in traffic engineering analysis. Traffic incidents result in immediate traffic flow disruptions, which are the primary causes of non-recurring delay in transportation networks. Effective detection of traffic incidents can improve traffic performance by prompt incident management to mitigate traffic disruption and reduce the likelihood of secondary crashes.
The development of incident detection techniques relies primarily on the available data from roadway surveillance systems. For now, traffic surveillance systems are comprised of a combination of roadway traffic sensors, highway patrols, CCTV (Closed Circuit TV), micro-radars, and acoustic sensors. Some other unconventional sensor technologies are beginning to find their ways into the systems, as well. As a result, the available traffic performance data for the input of incident detection take different formats including
vehicle trips (counts), vehicle speeds, traffic density, etc. These various traffic data comprise the basis for the development of Automated Incident Detection (AID) systems.
In all, the family of incident detection algorithms includes 1) pattern recognition methods, 2) traffic model methods, 3) statistics derivation methods, and 4) artificial intelligence methods (Weill, et al., 1998). They adopt different formats of traffic data and rely on a variety of analysis techniques.
The pattern recognition method recognizes traffic incidents as unusual traffic patterns that differ from normal conditions. For example, the widely used California Algorithms (Courage, et al., 1968) are designed to perform incident detection by comparing the occupancies of neighboring traffic count stations with pre-defined incident detection thresholds. The traffic model method employs the macroscopic flow models in traffic flow theory. As an illustration, the McMaster Algorithm (McMaster, 1991) makes use of a catastrophe theory to detect traffic incidents, which are denoted by sharp changes in traffic flows. The third method, statistical deviation method, is applied by comparing the predicted traffic interval data against historical records. The class of this method includes traditional statistical fitting, Bayesian inference, time series, and filtering algorithms, all of which have been explored in terms of traffic anomaly detection. Compared to the conventional methods, the method of artificial intelligence is relatively new. Nevertheless, some researchers have made progress in the field of incident detection by the use of artificial neural networks (e.g., Ritchie, et al., 1992).
An extension of the incident detection problem is the evaluation of various detection techniques. Popularly-used evaluation functions consist of detection rate, false alarm rate,
and detection time. In reality, however, evaluation data are scarce in the field. As a result, some researchers have employed simulation to theoretically evaluate the emerging incident detection algorithms. As an illustration, Lee, et al. (2002) initiated an investigation of incident situations through data mining in the PARAMICS (Parallel Simulation Model, Quadstone Inc.) simulation.
In all, a large class of incident detection techniques has been developed due to the possibility of different traffic data types and formats. Despite the choice of different detection variables, time series techniques still play a primary role in the effective and prompt detection of traffic incidents.
Traffic Breakdown Analysis
Traffic breakdown analysis is another analogous problem to this research. Its purpose is to analyze traffic anomalies in order to detect the onset of traffic breakdown in congestion studies. Traffic breakdown is a major contributor to roadway capacity loss. For example, Forbes & Hall (1990) found that once breakdown occurs, there is a 5-8% capacity loss due to an increase in queue discharge headway.
The scarce empirical information in this field makes traffic breakdown analysis difficult for practical engineering studies. Currently, traffic breakdown analysis is aimed at an early detection of traffic breakdown occurrence and a speedy dissemination of that information. This is also an important task in congestion management.
The detection of traffic breakdown relies on a successful recognition of real time traffic flow states. A three-phase theory is widely accepted among researchers. It classifies
traffic states into: free flow state, stop-and-go state, and synchronized flow state (e.g., Jost, 2002), which are analogous to the gaseous phase, liquid phase, and transition phase in a gas-liquid system, respectively.
In particular, Click, et al. (1997) developed a method that is able to predict traffic breakdown along freeways based on an analysis of the speed changes of vehicles over time. Zou (2003) performed a similar study when he developed a special time series on the changing rates of cross correlation between density dynamics and flow rate. The application results displayed that the proposed algorithm was able to better detect the onset of traffic breakdown.
In summary, most current traffic breakdown analysis techniques are based on a variety of basic traffic performance measures (such as speed, density and flow rate) and time series analysis methods. This is possibly to the wide data availability of such performance measures at the network level.
2.2 Simulation Failure Research
It might be due to the relatively short history of modern traffic simulations that the research on failure detection and analysis is scarce in this field. Nevertheless, the impacts of simulation failures on the validity of stochastic simulations are beginning to draw research attention from individual researchers.
The problem of simulation verification and validation has received increased attention as the result of the proliferation of traffic simulation models. It is considered an important basis for the effective and efficient use of traffic simulation in practice. However, till now, formal and consistent guidelines have not been developed regarding the application of stochastic simulation models.
Nevertheless, some researchers (e.g., Rakha et al., 1996, Rao and Owen, 1998, Milam, 2000) have conducted studies to derive a set of tentative guidelines from particular applications. Most researchers agree that conceptual validation, implementation verification, and operational validation should be the core parts of a high-level simulation verification and validation framework.
Besides individual studies, one large-scale, ongoing research initiative, NGSIM (Next Generation Simulation Model), was launched in 2000 to study the future development and applications of simulation models. In the NGSIM program, the FHWA (Federal Highway Administration), acting in the role of a major stakeholder of simulation practice, intended to manage public resources in a focused way as the “market facilitator” (NGSIM, 2003). The overall purpose is to influence and stimulate the wide use of traffic simulations. Among many crucial products of NGSIM program, a high-level verification and validation plan was developed for stochastic simulations. In this plan, a detailed verification and validation process was proposed to include five phases, namely planning, conceptual validation, implementation verification, operational validation, and reporting.
At the same time, the stochastic nature of traffic simulations has been addressed in some statistical approaches by individual researchers. Most of these efforts were included in
some advanced topics that study the large complexities of stochastic, large scale computer models. For example, in an effort to address potential errors and uncertainties in traffic simulations, Bayarri, et al. (2002) proposed a six-step validation framework based upon a Bayesian statistical methodology. These are 1) specifying the input/uncertainty map, 2) determining evaluation criteria, 3) data collection and design of experiments, 4) approximation of model outputs, 5) analyses of model outputs, and 6) feedback information. In the research by Sacks, et al. (2002), a set of five essential ingredients, namely context, data, uncertainty, feedback, and prediction, was abstracted from a statistically-based validation process. The study results verified that with careful calibration and tuning, traffic simulation can be an effective predictor of traffic performance in the field.
Simulation Failure Analysis
The literature review in the field of simulation validation and verification revealed that although uncertainty analysis has begun to be addressed, the detection and analysis of simulation failures have not been formally considered in the framework of traditional simulation analyses. For example, the Smartest Project (Algers, et al., 1998) performed an analysis to evaluate over thirty traffic simulators worldwide. In the summary of evaluation functions, the project recognized five model evaluation categories of efficiency, environmental impact, safety, comfort, and technical performance.
Nevertheless, individual researchers have begun to notice the phenomenon of simulation failures and estimate their impacts on simulation analysis. As an illustration, research on a Genetic Algorithm Signal Optimization Method (GASOM) by Park, et al, (2001)
considered the impacts of outlier observations in simulation evaluation and, accordingly, adopted the median instead of the mean to mitigate their impacts. Rouphail, et al. (2002), in the study of variability-sensitive measures of effectiveness (MOE) in stochastic simulation, examined the tail probabilities resulting from unusual simulation runs that would bias the analyses. The research led to the proposal of using the measure of inter-quartile range (IQR) as the primary MOE to incorporate the impact of gridlock runs. In a parallel research, Sacks, et al. (2002) indicated the discrepancies of traffic gridlock occurrence between simulation and field observations. They pointed out that the presence of gridlock may be numerically indicated by low throughput and by large “run-to-run” variance, which can be further assisted by a close examination of animations to uncover the failure-leading circumstances.
In summary, the problem of failure detection and analysis has not received enough recognition in traditional simulation verification and validation techniques. Although recently simulation failures have been studied as an important phenomenon in stochastic simulation, there is still no effective guidelines to appropriately detect and address the occurrence of simulation failures.
2.3 Summary of Literature
The purpose of this research is to identify simulation failures through the detection of traffic anomalies in traffic simulation. The research is unique in the sense that, although the analysis of simulation failures should comprise a significant part in the framework of stochastic simulation verification and validation, little research has been performed along these lines. Since the surveillance of traffic behavior is one primary task in the field of
network management, this class of problems has been widely discussed in the study of some analogous problems. The common feature of these problems is the detection of traffic anomalies using quantitative methods. Therefore, the existing traffic anomaly detection techniques in these analogous problems provide an important technical background for the development of an effective and common failure detection and analysis procedure in this research.
The varying of input data availability results in different analysis algorithms in these fields. Among the analogous areas, the study of communication gridlock detection is based upon data of passive measures of network traffic (equivalent to traffic flow rates). It has been demonstrated that with appropriate analysis techniques, the study of changes in passive traffic alone is sufficient to detect network traffic anomalies. Although a simulation study does not have concerns with regard to the data availability, it is advisable to use the least amount of data to make any proposed failure detection method general and transferable across networks and simulators.
As for the analysis tools, it is a common practice to use the changes of indicator variables over time and/or space to recognize any unusual patterns in network traffic. Specifically, the practices in these analogous studies have shown that the method of time series analysis, which can trace the changes of sensitive variables over time, is able to accurately and promptly recognize the occurrence of network abnormalities.
In the field of traffic simulation, although much research has been invested in general-purpose simulation validation and verification, the phenomenon of simulation failures has received scarce attention. With the increased necessity of developing a formal and
comprehensive simulation verification and validation framework, the detection and analysis of simulation failures should not be limited to statistical methods only. In short, the literature points to the need for developing and evaluating robust techniques that will assist in detecting simulation model failures, which can be of great value to model developers and users alike.
CHAPTER 3: METHODOLOGY
3.1 Overview
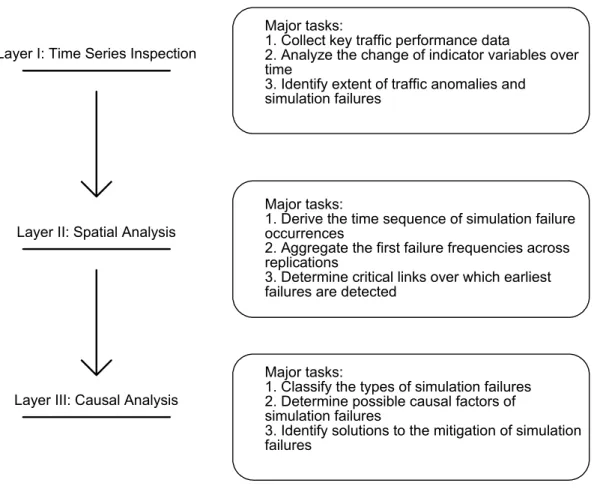
A multi-layer approach to the problem of failure detection and analysis has been developed. It is founded on the use of key traffic performance measures that are tracked in time and space in the analysis of simulation. The approach comprises three layers: a time series inspection, a spatial analysis, and a causal analysis. The major tasks associated with each layer are depicted in Figure 3.1 below and are explained next.
Major tasks:
1. Collect key traffic performance data
2. Analyze the change of indicator variables over time
3. Identify extent of traffic anomalies and simulation failures
Major tasks:
1. Derive the time sequence of simulation failure occurrences
2. Aggregate the first failure frequencies across replications
3. Determine critical links over which earliest failures are detected
Major tasks:
1. Classify the types of simulation failures 2. Determine possible causal factors of simulation failures
3. Identify solutions to the mitigation of simulation failures
Layer I: Time Series Inspection
Layer II: Spatial Analysis
Layer III: Causal Analysis
Figure 3.1 Multilayer Simulation Failure Analyses
tasks including
– the acquisition of time series data,
– tracking changes of traffic performance data over time, – detection of traffic anomalies, and
– judgment of simulation failure occurrence.
In order to perform the time series inspection, the indicator variables should be sensitive to the occurrence of simulation failures. With the prescribed detection thresholds (described later in this chapter), once an indicator variable exceeds a pre-specified value, a simulation failure “alarm” is set. Thus, the main function of the first layer is to execute a successful detection of simulation failures, while avoiding the mislabeling of temporary congestion as an actual failure.
The second layer pertaining to spatial analysis takes the detection results identified in the first layer to assess the spatial pattern of failure occurrence. It is noted that the occurrence of simulation failures is very likely to result in spillback onto many links in a given simulation replication. In order to locate the most critical links, these links are ranked according to their failure occurrence time, and only those ones having the earliest failure occurrence are recorded as first failing links. For network nodes (or intersections), in addition, a first failing node is labeled as such if any (one-way) link ending at that node are first failing. The frequency of failures for each link and node is then aggregated across replications. Finally, the links and nodes having the highest first failure frequencies are labeled as critical links and nodes in the initiation of simulation failures. Thus, the purpose of the second layer is to analyze the failure patterns and to identify
critical links and nodes by solving their first failure frequencies.
The third and highest layer is a causal analysis. It is intended to determine the possible contributing factors of simulation failures. This is based upon examining those critical links identified in the second layer. The concept is to use the spatial distribution of the first-failing links and nodes to judge what changes in model inputs or parameters are useful to mitigate unexpected occurrence of simulation failures. In general, simulation failures can be attributed to (a) input errors in the data stream, or (b) improper calibration of local parameters at the link-level, or (c) the selection of network-wide parameters that do not reflect the empirical data. Each type of failures can be mitigated by the use of appropriate user treatments. The causal analysis assists in making the choice of treatments.
The above three layers comprise a complete procedure of traffic simulation failure detection and analysis. Details on an integrated application of the method are described next in a simulation environment.
3.2 Data Preparation
Choice of Indicator Variable
The proposed simulation failure detection and analysis procedure is fundamentally based upon the analysis of time series data that are comprised of traffic performance interval data. In the process of choosing an effective indicator variable, two principal criteria should be considered: (a) the availability of the variable in standard simulation outputs, and (b) its sensitivity to the occurrence of failures. Based on these selection criteria, the
measure of the number of vehicle trips discharged from a link in a specified time interval (hereafter termed link trips out) is deemed to be an appropriate choice for this procedure.
There are normally many outputs available in a traffic simulation. Among the many candidate variables, the measure of link trips is seen as of particular relevance. It is one of the most elementary traffic measures of effectiveness, so that it is widely available in all known traffic simulation models. In addition, it is important to note that most traffic simulation models report traffic performance measures on a link based on only those vehicles that have already exited the link. In this research since the occurrence of link failures will obstruct vehicles from discharging at a “normal” rate, the values of most other traffic performance measures (such as speed or delay) will become unavailable or biased for failure analysis. For example, a link could report zero delay in a time interval if no vehicles are observed to discharge from it, while in reality those vehicles may be blocked from exiting the link and therefore are experiencing large delays that go unreported.
From the perspective of sensitivity, once simulation failures occur, most reported traffic performance measures will tend to be affected. Among them, the measure of link trips is able to promptly indicate the onset of a simulation failure, since it quickly drops to zero and persists at that level for the remainder of the simulation once a simulation failure occurs, as per the definition of a simulation failure. Under normal traffic states, by contrast, the measure of link trips typically follows a Poisson distribution and has a very small chance of reaching zero unless traffic demand is extremely slight in combination with a short observation interval.
Description of Detection Variables
Unrecoverable loss of link discharging capabilities is associated with zero link trips. But in some cases, the analysis of link trips alone may not be sufficient for the accurate identification of traffic status. For example, once a simulation failure occurs, unrecoverable traffic gridlocks will result in traffic spillbacks in a very short time, and links that are downstream of the problem area may experience demand starvation since they are no longer able to receive vehicles from the upstream links. In this case, although the number of link trips on these downstream links will drop and may exceed the prescribed thresholds, they are not actually suffering a capacity loss. Thus, false alarms could be reported by applying a naïve failure detection method. In order to avoid this possibility, two supplemental variables, namely vehicle trips in and change in link content, are included in order to construct a more robust set of failure detection criteria.
By definition, link trips denote the number of vehicles discharged from the subject link during a given time interval. This measure is termed as link vehicle trips-out (LTO) in this research. Another variable, link vehicle trips in (LTI) is, by contrast, defined as the number of vehicles discharged onto the subject link during the study time interval. The third variable, the change in link content (CLC) is defined as the change in the number of vehicles remaining on the subject link at the end of each time interval. These three variables jointly comprise the time series data used in the procedure of failure detection and analysis.
In the data collection stage, link trips-in and link trips-out across adjacent links are related to each other through an intermediate variable, movement trips-out (MTO),
observed at the upstream and downstream links, as illustrated in the Figure 3.2. This, of course, assumes that there are no sinks or sources between the entering and exiting movement flows.
i j
LTI Components LTO Components
Figure 3.2 Relationships between LTI, LTO and MTO
As shown in Figure 3.2, both LTI and LTO on the link (i, j) can be aggregated over the corresponding MTO. That is, LTI can be calculated as the aggregation of the MTO fed onto the subject link, while LTO can be calculated as the aggregation of the MTO discharged from it. In practice, movement trips are often easy to obtain from simulation outputs. For a specific time interval r, thus, LTO and LTI on link (i, j) can be calculated as:
∑
∑
= ==
=
n k r k j i r j i m h r j i h r j iMTO
LTO
MTO
LTI
1 ) , , ( ) , ( 1 ) , , ( ) , ( h=1 h=3 k=3 k=3 h=2 k=1Where LTI(i,j)rand
r j i
LTO(, ) denote the LTI and LTO on link (i, j) during time interval r,
r j i h
MTO( ,, ) denotes the MTO on link (h, i) destined to node j, and
r k j i
MTO(, , ) denotes the
MTO on link (i, j) destined to node k during r. The indices m and n denote the number of
upstream and downstream links for link (i, j), respectively, which contribute flow to or receive flow from the link. The formulas are of practical use since most simulators provide only values of link trips (LTO) and movement trips (MTO) in their simulation output.
If there are no capacity problems or simulation failures, all link vehicle trips on a network link should be serviced without significant delay. As a result, the number of vehicles discharged onto the subject link should approximate the number of vehicles exiting it. Thus, the variable CLC, which denotes the cumulative difference between LTI and LTO, can be used to signify traffic states on a study link. Given values of LTI and LTO at any time interval r, CLC is defined by the following equation:
∑
∑
= =−
=
r s s j i r s s j i r j iLTI
LTO
CLC
1 ) , ( 1 ) , ( ) , ( ,where CLC(i,j)r stands for the CLC on link i=>j at the end of time period r,
andLTI(i,j)sand LTO(i,j)sdenote the LTI and LTO on link i => j during time interval s.
If CLC fluctuates around a stable level, it denotes the presence of an equilibrium state on the subject link; on the other hand, if CLC monotonically increases above a certain threshold and does not drop back, it would indicate the presence of persistent queues on the subject link, which would in turn signify the occurrence of a simulation failure. In