Effects of Electrical Current on Microstructure and Interface Properties
of Sn
Ag
Cu
/
Ag Photovoltaic Ribbons
Kuan-Jen Chen
1, Fei-Yi Hung
2,+, Truan-Sheng Lui
2, Li-Hui Chen
2,
Dai-Wen Qiu
2and Ta-Lung Chou
31The Instrument Center, National Cheng Kung University, Tainan 701, Taiwan
2Department of Materials Science and Engineering, Institute of Nanotechnology and Microsystems Engineering,
Center for Micro/Nano Science and Engineering, National Cheng Kung University, Tainan 701, Taiwan
3HUA Eng Wire & Cable Co., Ltd., Kaohsiung, Taiwan
This study presents an electrical current testing that is based on the SnxAg0.5Cu (x=1, 3 mass%) photovoltaic (PV) ribbon, and investigates the growth mechanism of the intermetallic compounds (IMCs). The microstructure of both alloy solders contains the eutectic region (¢-Sn+Cu6Sn5+Ag3Sn) and the base phases (¢-Sn). The eutectic phases in the Sn3Ag0.5Cu (SAC305) alloy presented a continuous
distribution, and its amount was higher. After soldering, the Cu6Sn5and Ag3Sn IMCs were found at the interfaces, and their morphologies were
dominated by Ag contents in the SnAgCu (SAC) solder. The whole interfacial characteristics of IMCs were affected after biasing for 40 h. The growth behavior of these IMCs was controlled by the bias-induced thermal diffusion mechanism and the evolution of IMC morphology was dominated by the growth dynamics. The IMCs, formed at the interfaces (SAC/Cu, SAC/Ag), dominated the series resistance of the PV ribbon. [doi:10.2320/matertrans.M2013110]
(Received March 21, 2013; Accepted April 23, 2013; Published June 7, 2013)
Keywords: tinxsilver0.5copper, photovoltaic ribbon, intermetallic compounds, biasing
1. Introduction
The role of photovoltaic (PV) ribbon in the solar cells was soldered onto Si substrate to collect the photo-generated current.1)Currently, the most solders on the commercial PV
ribbons were Sn37Pb and Sn36Pb2Ag alloys.2,3) These
solder materials were SnPb alloys that were not environ-mental and human healthy friendly. Therefore, replacing the SnPb solder to lead-free solder was common goal for the electronic packing and the solder industries. Considering the melting point, wettability, mechanical properties, cost and conductivity of the lead-free solder materials, the Sn-based solder alloys (SnAg, SnZn, SnCu, SnAgCu) have been developed.47) Throughout Sn-based alloys, the green Sn AgCu (SAC) alloys with good wettability and mechanical properties of advantages can be applied in solar substrate.810) In recent years, the costs of high Ag content materials were raised due to the prices of the precious metals increased. Amagaiet al.indicated that the SAC alloys containing 1.0 1.5 mass%. Ag have best performance in winding and thermal cycling test.11) Many scholars also used the lower
Ag content SAC alloys to study the effects of the tensile stress, shearing stress and thermal fatigue properties on the
flip-chip packaging.10,12) However, the literature has never
reported the behavior of SAC alloys in PV ribbon. In addition, Cu6Sn5 and the Cu3Sn intermetallic compounds
(IMCs) were formed in the SAC solder/Cu interface;13)and the Ag3Sn IMC was formed in the SAC solder/Ag
interface.14)These IMCs have a high resistance and hardness that caused an increasing internal resistance and the brittleness destruction in the interface.15,16)
In this study, the different Ag contents in the SnxAg 0.5Cu (x=1, 3 mass%) alloys were used to estimate the
feasibility of PV ribbon application. The growth mechanisms of IMCs in the PV ribbon interfaces (SAC/Cu, SAC/Ag) were investigated. In addition, in the static (soldering) and dynamic (biasing) thermal effects, this study analyzed the interfaces characteristics and the resistance of overall structure to clarify the contribution of IMCs in the PV ribbon.
2. Experimental Procedures
The SnxAg0.5Cu (x=1, 3 mass%) alloy solders were used in PV ribbon. According to Ag contents in solders, Sn1 mass%Ag0.5 mass%Cu and Sn3 mass%Ag0.5 mass%Cu alloys were designed as the SAC105 and SAC305, respectively. Fusion current testing (Fig. 1(a)) for SAC alloys was performed using a DC power supply (Gwinstek GPR-1850HD). The alloy specimens were biased with the constant current (1 A/s) at room temperature until the fused behavior occurred. The critical fusion current density (CFCD) of solders was calculated according to the fusion current value divided by the cross-section area (5©0.8 mm2).
A pure Cu ribbon (length=30 mm, width=2.0 mm, thickness=0.15 mm) was immersed in the molten solder (270°C) for 1 s to form the PV ribbon. In order to estimate the feasibility of the SAC105 and SAC305 solders in the PV ribbon application, these ribbons were soldered to Ag electrode on Si substrate. In addition, a DC power supply provided a high current (³50 A·cm¹2) onto PV ribbons in a duration time of 40 h to investigate the interfacial diffusion behavior. Figure 1(b) shows a schematic illustration of the electrical current testing in the PV ribbons,17)and the dashed
line is presented the flowing path of the electrons. Micro-structures of solders were examined using the optical microscope (HITACHI, TM-1000). Interfacial characteristics were examined using an ultra-high resolution analytical
+Corresponding author, E-mail: fyhung@mail.ncku.edu.tw
electron microscope (JEOL, JEM-2100F CS STEM) and energy-dispersive X-ray (EDX). The series resistances (Cu/SAC/Ag) of PV ribbons were estimated according to the Ohm’s law (V=IR).
3. Results and Discussion
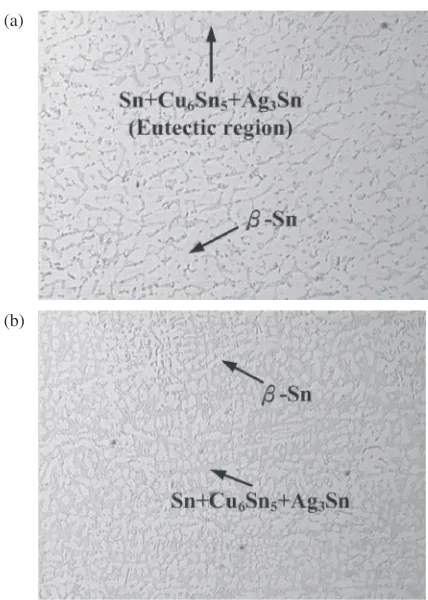
Figure 2 shows microstructure metallograph of the SAC105 and SAC305 alloys. The portions of the dark color were eutectic region (¢-Sn+Cu6Sn5+Ag3Sn); and those of
the light color were base phases (¢-Sn). In the case of the SAC105 alloy (Fig. 2(a)),¢-Sn phases presented a continu-ous distribution, but the ¢-Sn phase of the SAC305 alloy displayed a dendrite characteristic (Fig. 2(b)). Comparing the SAC105 with SAC305, the eutectic area of the SAC305 alloy was greater than that of the SAC105 alloy. This result indicated that the amount of IMCs in the SAC305 alloy was higher. The fusion current density of the SAC105 and SAC305 alloys was 1035.6 A·cm¹2 and 986.1 A·cm¹2,
respectively (Fig. 3). These fusion current densities were dominated by the internal resistance of the alloys. A greater the internal resistance of the alloy resulted in raising the bias-induced Joule’s heat, indicating that this alloy was easier to be fused. In the case of the eutectic region (¢-Sn+Cu6
S-n5+Ag3Sn), the Cu6Sn5was high resistance phase compared
to the¢-Sn phase. The eutectic area (high resistance phase) of SAC305 alloy was greater and discontinuous. These results caused the transmission of the electron had a high probability to encounter the high resistance phase. That was why the fusion current density of the SAC305 alloy was lower in the same current testing.
Pure Cu ribbon was immersed in molten solders (SAC105, SAC305) at 275°C for 1 s to obtain PV ribbon. The
cross-section images of PV ribbons were carried out, as shown in Fig. 4. It clearly shows that IMC layer was generated at the interfaces between solder and Cu, and there are no significant difference in the thickness and morphology. Both solders presented a reticular microstructure (eutectic zone), and these reticular microstructures encircled the ¢-Sn phase. Comparing with the metallograph (Fig. 2), these micro-structures were relatively smaller, indicating that the faster cooling rate affected microstructure size. The proposed PV ribbons were soldered to Ag electrode on Si substrate at 250°C for 10 s, and the interfacial microstructures (SAC/Cu, SAC/Ag) were acquired (Fig. 5). The interfacial micro-structures from A1 to A3 were the upper solder/Cu interface, the lower solder/Cu interface and the lower solder/Ag interface, respectively. The IMCs were clearly found in all interfaces that associated with thermal-induced diffusion behavior.18,19)In the case of A1 and A2 interfaces, whether
(a)
(b)
Fig. 2 Microstructure metallograph of (a) SAC105 and (b) SAC305 alloys.
1035.6 986.1
SAC105
SAC305
0 200 400 600 800 1000 1200
Curr
ent density
,
I/
A·cm
-2
Fig. 3 Fusion current densities of SAC105 and SAC305 alloys. (a)
(b)
[image:2.595.319.533.66.366.2] [image:2.595.104.232.70.331.2] [image:2.595.334.521.412.542.2]the SAC105 solder/Cu interfaces or the SAC305 solder/Cu interfaces, the IMCs layers were not distinctly difference in the thickness and morphology. In the case of the SAC105 solder/Cu interfaces (Figs. 5(a), 5(b)), the IMCs layer with a great amount of the pillar-like structures was formed. The
IMCs morphology of the SAC305 solder/Cu interfaces presented a scallop-like shape (Figs. 5(d), 5(e)). Previous literatures indicated that these IMCs structures were corre-sponding to Cu6Sn5 phase.9) In addition, some pillar-like
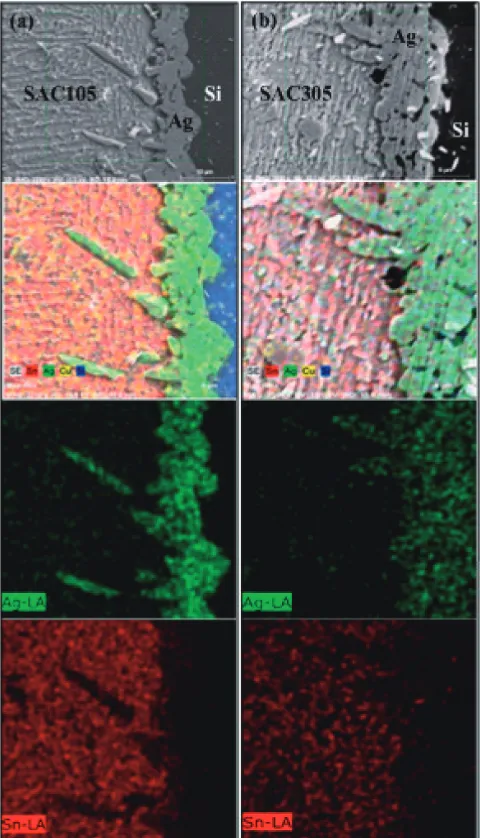
IMC structures were grown at the SAC/Ag interface (Figs. 5(c) and 5(f )). The morphology of Ag electrode presented an irregular shape and had the pores inside, indicating that the short reflowed time caused the reaction time was not enough. In order to determine the composition of pillar-like IMC structure, the interface characteristics (A3) were also detected using EDS mapping, as shown in Fig. 6. Ag was the main element in pillar-like IMCs, indicating that the composition of the pillar-like structure was dominated by Ag3Sn phases.9)This result was attributed to Sn in SAC alloy
reacted with Ag to form the Ag3Sn. Notably, the amount of
the at the SAC105 solder/Ag interface was more than that in the SAC305 solder/Ag interface. The main reason for this was the higher Ag concentration gradient between the SAC105 solder and Ag electrode, causing more Ag to be fused into solder to form pillar-like Ag3Sn IMC. Meanwhile,
(a)
(b)
Fig. 4 The interfacial microstructure between solder and Cu: (a) SAC105 and (b) SAC305 solders.
Fig. 5 The interfacial microstructures of PV ribbons after soldering for (a) SAC105 and (b) SAC305 solders.
[image:3.595.61.275.66.362.2] [image:3.595.307.547.71.490.2] [image:3.595.50.288.411.680.2]this IMC growth mechanism also caused Ag electrode decreased in thickness. In addition, some Cu6Sn5 phases
existed in IMC structure due to the consumption of solder, and then were adsorbed to the interface.
To understand the influences of biased treatment on the interface characteristics, PV ribbon was biased for 40 h at room temperature. Figure 7 shows the interfacial images of PV ribbons after biasing for 40 h. The whole interfacial layer of the Cu6Sn5 IMC (A1, A2) increased in thickness after
biased for 40 h, and the morphology was changed from the pillar-like (Figs. 5(a), 5(b)) to the layer-shaped (Figs. 7(a), 7(b)). In the case of the Ag3Sn IMC (A3), their morphology
trended to become planar (Figs. 7(c), 7(f )) compared with the soldered PV ribbon (Figs. 5(c), 5(f )). These growing behaviors were controlled by the diffusion mechanism, and the growing dynamics were consistent with the parabolic law.9)
These interfacial IMCs will affect the efficiency and compatibility of PV ribbon on solar cell, therfore, the electrical resistances of the PV ribbons with different biasing time were measured (Table 1). Whether the SAC105 or SAC305 solders, the body resistances increased after biasing for 40 h. Due to the Cu6Sn5and Ag3Sn IMCs (high resistance
phases) increased in thickness.15,20) Comaring the SAC105 with SAC305, a body resistances of SAC105 PV ribbons were higher. In SAC105/Ag and SAC305/Ag interfaces, the thickness of Ag3Sn IMCs were not significant difference after
biasing. But the SAC105 solder (low Ag concentration) resulted in the reduction of Ag electrode thickness. Briefly, a
residual Ag thickness of the SAC105 PV ribbon was thinner than that of the SAC305 PV ribbon. In other words, the low Ag content SAC105 solder was faster to enhance the internal resistance of PV ribbon, which was more quickly to effect the photocurrent conversion efficiency of the solar cell.
4. Conclusions
This study estimated the feasibility of SnxAg0.5Cu (x=1, 3 mass%) solders in PV ribbon application. The high amount of a eutectic area (high resistance phase) in SAC305 alloy presented a discontinuous distribution, and reduced the fusion current density. After soldering, the Cu6Sn5and Ag3Sn
IMCs were formed at the SAC/Cu interfaces and SAC/Ag interfaces, respectively. SAC105/Ag interface had more pillar-like Ag3Sn IMC structure, and caused Ag electrode
reduced in thickness, that increased the series resistance of PV ribbon. Bias-induced thermal diffusion mechanism would cause a thickness of IMCs (Cu6Sn5, Ag3Sn) to increase, while
the transformation of IMCs morphology attributed to the growth dynamics. In the case of the SAC105/Ag interface, the thickness of residual Ag electrode was thinner after the bias aging, which enhanced the series resistance of PV ribbon.
Acknowledgements
The authors are grateful to the Instrument Center of National Cheng Kung University, the Center for Micro/Nano Science and Technology (D101-2700) and NSC 101-2221-E-006-114 for the financial support.
REFERENCES
1) W. C. Yang, H. C. Ay and Y. J. Ciou: Int. Symp. Transport Phenomena, (2011, 811 November, Delft, Netherlands) pp. 1112.
2) D. R. Frear:IEEE Trans. Compon. Hybrids Manuf. Tech.13(1990) 718726.
3) Y. T. Chiu, K. L. Lin and Y. S. Lai:J. Mater. Res.23(2008) 1877 1881.
4) M. T. Jahn and A. R. Saavedra:J. Mater. Sci. Lett.11(1992) 1596 1598.
5) J. Glazer:J. Electron. Mater.23(1994) 693700.
6) Y. W. Yen, M. C. Lin, C. K. Lin and W. C. Chen:J. Electron. Mater.41 (2012) 32843291.
7) P. D. Pereira, J. E. Spinelli and A. Garcia:Mater. Des.45(2013) 377 383.
8) P. Liu, P. Yao and J. Liu:J. Alloy. Compd.486(2009) 474479. 9) G. Zeng, S. B. Xue, L. Zhang, L. L. Gao, W. Dai and J. D. Luo:
J. Mater. Sci. Mater. Electron.21(2010) 421440.
10) Y. Kariya, T. Hosoi, S. Terashima, M. Tanaka and M. Otsuka: J. Electron. Mater.33(2004) 321328.
[image:4.595.49.289.69.386.2]Fig. 7 The interfacial microstructures of PV ribbons after biasing for 40 h: (a) SAC105 and (b) SAC305 solders.
Table 1 Total resistance of the PV ribbon with different alloy solders as a function of biasing time.
Solder Biasing time (h) Resistance (³)
SAC105 0 0.068
40 0.070
SAC305 0 0.052
[image:4.595.304.549.95.167.2]11) M. Amagai, Y. Toyoda and T. Tajima: Electronic Components and Technology Conference, (2003, 2730 May, New Orleans, Louisiana, USA) pp. 317322.
12) Y. Kariya, T. Hosoi, S. Terashima, M. Tanaka and M. Otsuka: J. Electron. Mater.33(2004) 321328.
13) Y. Tian, Q. M. Zhang and Z. Q. Li:Solid State Commun.151(2011) 14961499.
14) K. W. Moon, W. J. Boettinger, U. R. Kattner, F. S. Biancaniello and C. A. Handwerker:J. Electron. Mater.29(2000) 11221136. 15) Y. Tian, Q. M. Zhang and Z. Q. Li:Solid State Commun.151(2011)
14961499.
16) L. H. Xu and J. H. L. Pang:J. Electron. Mater.35(2006) 21072115. 17) K. J. Chen, F. Y. Hung, T. S. Lui, S. J. Chang and Z. S. Hu:Mater.
Trans.52(2011) 15601564.
18) W. Q. Peng, E. Monlevade and M. E. Marques:Microelectron. Reliab. 47(2007) 21612168.
19) R. K. Chinnam, C. Fauteux, J. Neuenschwander and J. Janczak-Rusch: Acta Mater.59(2011) 14741481.