THE EFFECTS OF CONCEPT MAPPING
IN GAME-BASED LEARNING
N.A. Kranenburg
M.Sc. Thesis
February 2019
Supervisors:
Dr. H.H. Leemkuil Dr. H. van der Meij
University of Twente, Enschede, The Netherlands Faculty of Behavioural Science Educational Science and Technology
The Effects
of Concept Mapping in Game-based Learning
Student: N.A. Kranenburg
1st Supervisor Dr. H.H. Leemkuil
2nd Supervisor Dr. H. van der Meij
Author Note
Correspondence concerning this article should be addressed to N.A. Kranenburg, Faculty of Behavioural Science, University of Twente, P.O. Box 217, 7500 AE Enschede, The Netherlands.
Table of contents
1. Theoretical framework
4
1.1. Digital game-based learning
4
1.2. Learning supports
6
1.3. Concept mapping
7
2. Research questions
10
3. Method
11
3.1. Participants
11
3.2. Materials
12
3.3. Procedure
16
3.4. Analysis
17
4. Results
21
5. Discussion and conclusion
25
References
31
Abstract
Research on digital games indicates that games can be more effective for education when a learning support is added. This study examined whether different forms of concept mapping affects students' game motivation as well as the effects on learning outcomes. Concept maps are considered as an effective visualized learning tool that assist the development of conceptual knowledge, supporting students with the use of correct information and choices that have to be made.
In this study participants were randomly assigned to a condition: a student-constructed concept map condition, a pre-generated concept map condition, and a control condition that played the game
Lemonade Tycoon 2 New York without the use of a concept map. Participants in the student-constructed condition built their own concept map using given terms and concepts from the game. Participants in the pre-generated group received a pre-made concept map made by the researcher using the same game concepts.
It was predicted that the use of concept maps as learning support in game-based learning would improve students' learning outcomes. However, results showed no statistically significant effects on learning outcomes. Regarding students' motivation, the combination of the game and concept mapping was predicted to have a negative effect. However, results showed that the concept map in both experimental conditions did not decrease the positive perceptions towards the game. Also, no correlations were found between the game scores and the knowledge test scores. Indicating that participants who did relatively well in the game, did not score better in the knowledge test. The discussion reveals aspects of concept mapping as learning support that may be relevant for student learning in game-based learning environments.
Introduction
Nowadays, digital games are very popular. According to Dorsselaer et al. (2016), 68 percent of Dutch students in secondary education and 87 percent of Dutch pupils in primary education regularly play digital computer games. Several studies have reported that learning through digital games, known as game-based learning, is effective for improving students’ learning engagement, learning outcomes, and motivation (e.g. Barzilai & Blau, 2014; Sung & Hwang, 2018). Games can be so engaging that players may lose sense of time and place, resulting in high fascination and concentration. These experiences are often not seen in traditional learning strategies where students may lack engagement, having difficulties remaining concentrated (van der Meij, Albers, & Leemkuil, 2011).
However, the use of computer games in education is not always sufficient for learning (e.g. Li & Tsai, 2013; Vandercruysse, Vandewaetere, Cornillie, & Clarebout, 2013). Researchers found that game-based learning is generally experiential, where learning takes place through experience, and often contains complex learning environments. Students can be overwhelmed due to complexity of the tasks, large amounts of information that has to be processed, and choices that have to be made (Wouters, van der Spek, & van Oostendorp, 2011). It is a challenge to help students make the connections between the experiential knowledge learned in the game and knowledge learned at school when games are used for formal learning in education (Quintana et al., 2004). To solve this problem and assist students in their learning process, games can be supported with instructional learning supports to facilitate learning in game-based education (Charsky & Ressler, 2011; Clark et al., 2011; Garris, Ahlers, & Driskell, 2002; Wouters & van Oostendorp, 2013).
A type of learning support that might help facilitate learning in a game-based environment is concept mapping (Charsky & Ressler, 2011). Concept mapping is widely used as an effective learning support in traditional experiential learning. During concept mapping learners organize, restructure, and represent what they know about a topic to form new connections between prior knowledge and new knowledge (Novak & Canas, 2008). However, very limited research is conducted on the effectiveness of concept maps on students' learning outcomes within digital game-based learning environments. Therefore, it is important to explore the integration of effective concept mapping strategies in game-based learning.
study focuses on how concept maps affect students' learning outcomes and motivation within game-based learning.
1. Theoretical framework
1.1. Digital game-based learning
Digital games
Several definitions of computer games are provided by researchers (e.g. Garris et al., 2002; Prensky, 2001). For the purpose of this study, computer games are defined as a set of interactive components and activities in a digital environment (Prensky, 2001), directed towards clear goals (Malone, 1981), agreed rules and constraints (Garris et al., 2002), which are frequently provided with feedback (Prensky, 2001) in the form of hints or scores that enable players to monitor their progress (Wouters, van Nimwegen, van Oostendorp, & van der Spek, 2013). Games may be powerful for learning since they trigger motivation through its interesting, involving, and fun characteristics (Prensky, 2001). The nature of games ensures that players put energy and effort in gameplay to achieve higher game scores and overcome challenges and mistakes (Prensky, 2001).
Digital computer games can be used in education to explore new skills, practice and drill existing skills, and promote self-esteem (Dempsey, Rasmussen, & Lucassen, 1996 as cited in Leemkuil, 2006). Rich digital game environments act as powerful contexts for learning (Admiraal, Huizinga, Akkerman, & Dam, 2011) where learners are confronted with complex problems (Bakker, van den Heuvel-Panhuizen, & Robitzsch, 2016; Garris et al., 2002; Li & Tsai, 2013; Malone, 1981), receiving immediate feedback to help them make progress in the interactive process of reacting, hypothesizing, and planning (Oblinger, 2004).
Learning in a game-based environment
Rich digital game environments ensure powerful contexts for learning (Admiraal, Huizinga, Akkerman, & Dam, 2011; Quintana et al., 2004) where learners are confronted with complex problems, and receive immediate feedback in a risk-free environment (Bakker et al., 2015; Li & Tsai, 2013; Garris et al., 2002; Malone, 1981). Game-based learning is facilitated through experiential learning; students are committed and motivated through experiences with the game environment (Kiili, 2005). The nature of games enables players to put energy and effort in gameplay to overcome challenges and mistakes, resulting in higher game scores. Foster (2008) states that attempting challenges is a human instinct considering the enhancement of motivational aspects such as engagement, self-determination, and enjoyment. Since challenges are related to useful and important information in a game, players naturally acquire knowledge or change their behaviour towards the game content (Prensky, 2001).
Theories have been developed emphasizing the importance of cognitive processes involved in information processing and learning. For example, Mayer (2001) identified three types of cognitive processes in his theory of multimedia learning; the selection of relevant information, organizing this new information in a consistent structure, and integrating this structure with prior knowledge. In addition, according to Kolb's (1984) theory of experiential learning, learning begins with a concrete experience followed by data collection and reflective observations about the experiences. For example, when learners enter a game for the first time, learning will start with exploring the game environment looking for indications of actions that need to be performed to reach the goal. In this phase, players reactivate and use information that is already available in their memory (Leemkuil, 2006). Learners generalize, draw conclusions, and form hypotheses about the experience after which the learner tests these hypotheses and ideas through active experimentation in a new context (Kolb, 1984). Game characteristics as goals, rules, feedback, and challenges can facilitate these learning processes in several ways. First, by influencing active and experiential learning, and second by influencing motivation (Wouters et al., 2013). Game players will use an experiential learning strategy as long as useful information of certain actions is available in the game environment or in their memory (Leemkuil, 2006). Nevertheless, game knowledge is often implicit and represented in the game visuals, controls, and feedback systems, while students require knowledge at school in an explicit way that involves language (Clark et al., 2011). To gain explicit insights and strategies, students must play with a combination of experiential and reflective learning strategies. Reflective learning requires more structure and cognitive effort since it aims at explicit learning and memorizing knowledge (Taatgen, 1999 as cited in Leemkuil, 2006). Students reflect on previous game actions and try to develop new rules and/or procedures.
takes place. This may lead to players that are often not aware of the concepts, principles and structures used in the game, resulting in difficulties applying the elements they have learned in other contexts (Clark et al., 2011; Leemkuil, 2006). There are several reasons why this may happen. First of all, research of Dempsey, Haynes, Lucassen, and Casey (2002) showed inefficient and ineffective trial-and-error strategies among players performing actions. Players repeatedly try a variety of actions until there is a moment of success or the player stops trying. This absence of a systematic strategy in playing the game prevents players to learn with a reflective learning strategy. Second, games often contain complex learning environments where players can be overwhelmed as a result of large amounts of information that has to be processed, the choices that have to be made, and the complexity of the tasks (Wouters et al., 2013). Game players may also be so involved in the game that they are guided by the context. This overload of information may result in an implicit unselective learning strategy, leading to context specific knowledge that is difficult to transfer to other situations (Leemkuil, 2006).
To solve this problem and assist students to use a reflective learning strategy instead of only an experiential way of learning, strong and focused learning support is needed in game-based education (Barzilai & Blau, 2014; Charsky & Mims, 2008; Leemkuil, 2006; Leemkuil & de Jong, 2004). This assumption is confirmed by previous research conducted by Ke (2009) and Wouters and van Oostendorp (2013) stating that games with instructional supports improve students’ learning.
1.2. Learning supports
Adding learning supports is assumed to be necessary in game-based learning environments in order to facilitate and stimulate students’ learning (Ke, 2009; Vandercruysse et al., 2016). Learning supports assist the process of students' performance and learning, that enables them to succeed in problems that would otherwise be too difficult to complete (e.g. Reiser, 2004; Pea, 2004; Quintana et al., 2004). For example, a teacher or tool may assist with setting appropriate goals, provide strategic guidance, or perform difficult parts of the task. The idea behind learning supports is derived from Vygotsky's (1978) theory of the zone of proximal development, which describes the area of tasks between what the learner could succeed in doing on their own and what he or she could accomplish with help from others (Rogoff, 1990 cited in Quintana et al., 2004).
guiding towards a clear goal. Lastly, critical information or problems are highlighted allowing students to identify the concepts they need for the task. However, learning supports do not directly improve students' learning, but may lead them in the right direction, triggering learning-relevant cognitive activities and content understanding rather than simply revealing the answers (Quintana et al., 2004).
In the past years, researchers have examined various learning supports for bridging the gap between implicit and explicit knowledge in digital learning environments. (Garris et al., 2002; van der Meij, Albers, Leemkuil, 2011; Quintana et al., 2004; ter Vrugte & de Jong, 2012). The most commonly used learning supports in educational games are modelling, advice, collaboration, interactivity, narrative elements, and feedback (Wouters & van Oostendorp, 2013). Research studies have found positive benefits of learning supports in digital learning environments. For example, Garris et al. (2002) found that reviewing and analysing occurring game events, also known as debriefing, supports learning in creating connections between game representations and real events. Hagemans, van der Meij, and de Jong (2012) investigated the effects of adding a concept map-based support to a simulation-based learning environment on kinematics, revealing positive effects on the combination between colour coding and optimal routing signals. Sun, Merrill, and Peterson (2001) studied visual hints, strategy hints, and direct guidance as learning support in a computer game. Results showed significant improvement in game performance and decreased frustration among participants.
However, not all games are suitable for learning purposes of specific learning objectives. Designing a completely new game takes educators a lot of time and effort. Therefore, an alternative is to choose an already existing game and embed external learning supports into it for instructional purposes (Kao et al., 2017). An example of existing games are commercial off-the-shelf games. They are created for pure entertainment purposes. Some commercial off-the-shelf games involve intellectual challenges and content which can be easily implemented in an educational setting. For example, the game Civilization can be used to teach concepts related to military, technology, politics, and socioeconomic development while players build an empire from scratch (Cheon, Chung, Song, & Kim, 2013).
1.3. Concept mapping
concepts are hierarchically placed below (Novak & Gowin, 1984). Since the structure depends on the content of a specific topic, referencing to a specific learning objective makes it easier and more clearly to structure the considered knowledge and prevents learners to deviate from the learning goal (Novak & Canas, 2008).
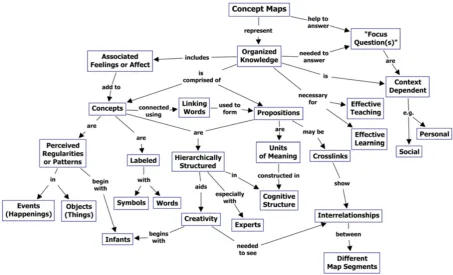
[image:10.595.71.525.265.540.2]In addition to concepts and labelled links, concept maps can contain cross-links. Cross links connect two concepts of separate parts of the map, they show how concepts in different segments of the map are related to each other. Also, examples can be added to the map to refine the meaning of the concept. Since these examples do not represent concepts, they are usually not placed in circles or boxes. Figure 1. represents an example of a concept map describing the structure and characteristics of itself.
Figure 1. A concept map showing the key features of concept maps (Novak & Canas, 2008).
Lastly, a metacognitive function ensures that students are able to reflect on themselves to make sure they did, or did not, fully understood the content and the links of the map (Hilbert & Renkl, 2008). These functions are in line with Mayer's (2001) cognitive theory of multimedia learning stating that concept mapping focuses on two types of cognitive information processing. First, the selection of relevant information by paying attention to the presented material and organizing the new information in a consistent structure. Second, concept maps contribute to explicit learning because students visualise, construct, and reflect on their implicit knowledge using a schematic diagram.
Several studies have examined the role of concept mapping within game-based learning environments. For example, Coller and Scott (2009) used concept maps as an evaluation instrument for a game-based course.They found that concept mapping has the potential for improving students’ learning performance. Kwon and Cifuentes (2009) explored the differences in effectiveness of collectively and individually constructed concept maps through game play, resulting in equally positive effects on science concept learning with higher quality concept maps in the collaborative condition.
There are several methods to use concept maps as learning support. McCagg & Dansereau's (1991) presented pre-generated concept maps and student-constructed concept maps. Pre-generated concept maps are designed by content experts or instructors provided for students as a graphical overview or advanced organizer (Hagemans, van der Meij, & de Jong, 2012). Learning from pre-made examples has proven to be very effective in initial skill acquisition (e.g. Atkinson, Derry, Renkl, & Wortham, 2009 as cited in Hilbert, Nuckles, & Matzel, 2008) and prevents learners from using load-intensive strategies by focusing their attention on learning (Sweller & Cooper, 1985). They support students with the identification of the main ideas and structures of the topic by displaying the interrelationships between new information with their own prior knowledge (Novak & Canas, 2008). According to Ausubel’s (1968) theory, advanced organizers are introduced prior to learning. They assist students in their orientation activities by displaying the main topics and learning components. They may serve as an overall scheme for focusing the learner on information that is important, so students can better process the information that follows (Hartley & Davies, 1976; Tan, 2000 as cited in Hagemans et al., 2012).
map compared to traditional learning methods. Pre-generated concept maps may be an effective teaching and learning tool for promoting students’ learning.
Canas, Reiska, and Novak (2016) presented several recommended criteria for the right quality and size of concept maps. First, the concept map should answer the specific problem or question. Second, the concept map should be to the point regarding the topic. Third, all propositions and concepts should be relevant to the topic. Fourth, no ‘unnecessary’ concepts, propositions, or cross links should be added. Lastly, there are no missing relevant concepts or propositions.
Student-constructed concept maps are created by students during learning. They are a representation of information about a specific topic (McCagg & Dansereau, 1991) and created based on prior knowledge or a given list of concepts. Student-constructed concept maps may have less depth and may be less complex than pre-generated concept maps, but do assist students in organizing, restructuring and representing information (Charsky & Ressler, 2011).
It should be noted that using learning supports, where students have to re-examine concepts from the game in formal terms, might negatively impact students' motivation and their game experiences (Barzilai & Blau, 2013; Charsky & Ressler, 2011). For example, Charsky and Ressler (2011) found that adding concept maps to a game might negatively impact students' motivation and feelings of learning and enjoyment in the game. The learning support might focus students' attention on learning the concepts, which may stress extrinsic motivation leading to less fun gameplay.
2. Research questions
This experimental study with three groups (non-concept map, student-constructed concept map, and pre-generated concept map) focuses on two constructs that are used to compare the effects of concept maps in a game-based learning environment. First, game scores and knowledge test scores as learning outcomes. Second, participants’ motivation. Three research questions are stated based on the literature above.
game need to be re-examined in formal terms by the experimental conditions using concept maps. Barzilai and Blau (2013) concluded that this might negatively impact students' understandings of the game and their game experiences.
Second, to what extent does the use of concept maps in a game-based learning environment improve students' learning outcomes compared to learners who play the game without concept maps? If so, what type of concept maps (pre-generated or student-constructed) show higher learning outcomes in game score and the knowledge test? The prediction is that students in the experimental groups using concept maps will use a reflective learning strategy. As a result, the learning outcomes of these students should be higher than the learning outcomes of the students in the control condition, of which is expected that they will play with more experiential learning strategies. Furthermore, the prediction is that students in the pre-generated concept map group receive more in-depth knowledge since the concept map is constructed in a logical, organized way by the researcher (McCagg & Dansereau, 1991). As a result, the learning outcomes of students in the pre-generated group should be higher than the learning outcomes of students in the student-constructed group since student-constructed concept maps have less depth and are less complex (Novak & Canas, 2008). However, students in the student-constructed concept map group create and adjust their own concept map, which might lead to more moments of reflective learning and in-depth thinking than students working with a pre-generated concept map. Therefore, no concrete hypothesis can be stated for the direction of the effect of concept map type on students' learning outcomes.
Third, is there a relationship between game score and knowledge test score? It is hypothesized that students who score high in the game, will also score high on the knowledge test. The game score should have construct validity and should correlate positively with the test scores since both measures are about the same concepts and constructs. Therefore, it is hypothesized that there is a relationship between the game score and the knowledge test score.
3. Method
3.1. Participants
3.2. Materials
Materials and instruments used in this study are the game Lemonade Tycoon 2 New York, introduction materials for concept mapping, materials for students to construct a concept map, a pre-generated concept map of Lemonade Tycoon 2 New York, a game experience questionnaire, a game motivation questionnaire, and a knowledge test.
Lemonade Tycoon 2 New York
The game-based learning environment used in this study is the commercial-off-the-shelf strategy game Lemonade Tycoon 2 New York. In this single-player business strategy game, students need to setup and run a successful lemonade business. The game has two modes: Time Challenge and Career. In this study the Time challenge mode is used where the main goal of the participants is to set up a successful lemonade business and maximise profit within a time limit. Participants have to adjust variables such as location of the stand, recipes and price of the lemonade, upgrades, and marketing budget before starting the day. The lemonade ingredients influence the costs of the lemonade and determines, together with the price, the profit per sold cup of lemonade. Before the start of the day participants have to order stock for producing the lemonade. Insufficient stock may result in lost sales or spoiled stock.The success of the business also depends on external factors such as weather, customer satisfaction, news, and the popularity of the lemonade. During and after each game day, players receive feedback which allows them to see how well they did and how their lemonade was appreciated. Depending on this feedback, players have to decide whether improvements are possible and adjust their strategies for the following day in order to increase their profits. Only the variables recipe and price can be manipulated during the day.
In this study participants' game performance is measured by using the profit report after the 15th game day in Time challenge mode. Cash, stock, and equipment participants have gained at the end depends on the performed strategies and actions. The profit of each game day, the number of assets, stock, and equipment are shown in the profit report. The total amount of profit for the game session of 15 days represents the final game score.
Game experience questionnaire
playing digital games, strategy games, and Lemonade Tycoon or other versions of the game. Based on a five-point Likert scale, participants scored their self-perception in game experience from 'almost no experience' to 'very experienced'. The game-experience questionnaire can be found in appendix IV and V.
Game motivation questionnaire
The game motivation questionnaire developed by Rheinberg, Vollmeyer, and Burns (2001) is used in this study to measure participants' current motivation and attitude towards running a lemonade business before the first and after the second game session (appendix II and IX). Rheinberg, Vollmeyer, and Burns (2001) found the scales’ reliability to be sufficient (a Cronbach’s alpha between 0.72 – 0.85 for anxiety, a Cronbach’s alpha between 0.68 – 0.88 for probability of success, a Cronbach’s alpha between 0.71 – 0.90 for interest, and a Cronbach’s alpha between 0.66 – 0.81 for challenge). Before completing the questionnaire, students were informed about the main idea and the goal of the game. Questions were given on a 7-point Likert-scale ranging from 'disagree' to 'agree' measuring students' probability of success; which refers to the belief that the student can succeed (e.g. 'I think everyone could do well on this task'), anxiety; which can be interpreted as a fear of failure in a specific situation (e.g. 'I feel under pressure to do this task well'), interest; which refers to positive effects and evaluations regarding the topic (e.g. 'After hearing the introduction, the task seems to be very interesting to me'), and challenge; which refers to the effort the students wants to put in to achieve success (e.g. 'I am strongly determined to try as hard as I can on this task'). Interest and anxiety were measured with five questions each, challenge and probability of success
were measured with four questions each.
Introduction to concept mapping handouts
Before participating in the study, all participants in the experimental conditions received an introduction to concept mapping with detailed examples of a concept maps on neutral topics. Also, participants received oral and written instructions describing a series of steps for constructing concept maps to first learn to read and process concept maps in general (McCagg & Dansereau, 1991). Referring back to the instructions and examples was allowed in the experimental conditions. All materials and content in the introduction are unrelated to the learning content of this research. The learning materials can be found in appendix VII and VIII.
Pre-generated concept map
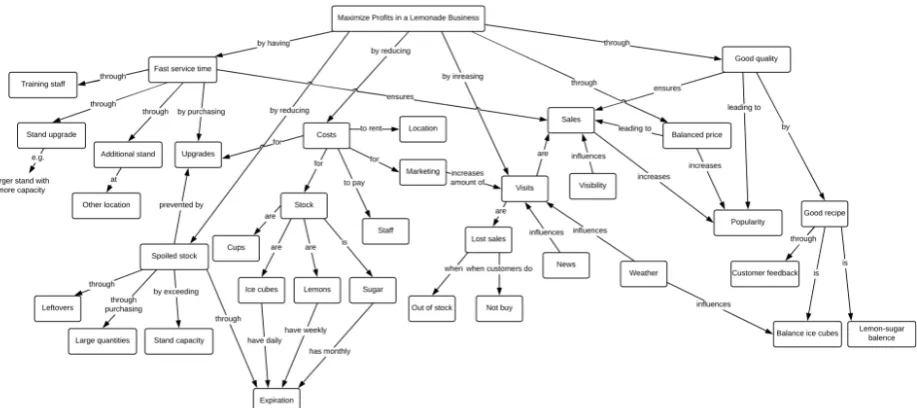
students might not form explicit and abstract understandings regarding the concepts within the game and their relations. To support students to use a reflective learning strategy, a pre-generated concept map is developed based on Novak and Canas' (2008) research. First, the main topic was constructed that clarifies the problem the concept map has to resolve. In this study, the aim is to maximise profits in a lemonade business. Second, given the selected domain and problem, game concepts of Lemonade Tycoon 2 New York
[image:16.595.73.532.293.497.2]were identified by playing the game and by using previous research with the same game (Albers, 2008; Van der Meij et al., 2013; & Walther, 2013). These concepts were listed and ranked from the most general, to the most specific concepts. After this, the map was constructed with labelled links. Finally, the map was revised, concepts were re-positioned for more clarity, and cross-links were added. The pre-generated concept map used in this study is reported in Figure 2.
Figure 2.: Pre-generated concept map Lemonade Tycoon 2 New York
Student-constructed concept map materials
enable students in the different conditions to acquire the same knowledge and reduce the chance that they will illuminate a wrong topic in their concept map. This list also ensures that the development of the concept map is faster, and the possibility of getting overwhelmed will be reduced (McCagg & Dansereau, 1991). A whiteboard-system, consisting of plasticized concepts, a plasticized sheet, and a whiteboard marker with an eraser, makes it easy for the students to adjust mistakes and construct the concept map.
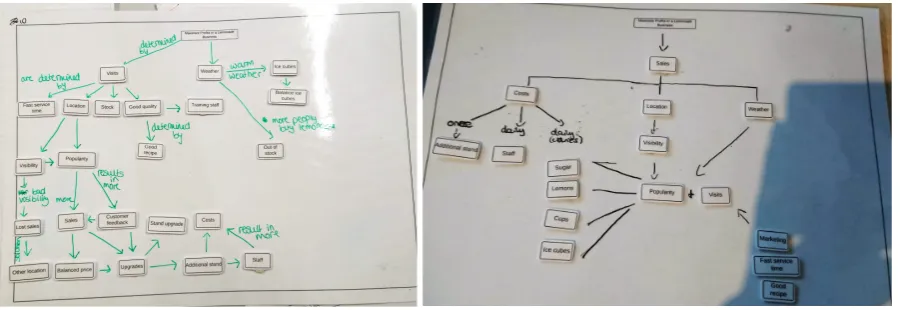
Figure 3.: Student-constructed concept map examples
Knowledge test
A post-test questionnaire based upon the ones used in Albers (2008), Van der Meij et al. (2013) and Walther (2013) is developed to assess students' understanding about the underlying concepts and principles of Lemonade Tycoon 2 New York. The questions focus on important concepts, principles, and heuristics. Concepts and principles are not explicitly mentioned within the game, but have a great influence on the game progress. Conceptual knowledge refers to facts and definitions of the game. Principle knowledge refers to specific steps and actions students have to do to resolve a problem. Heuristic knowledge is a practical method using knowledge gained by experience to deal with other situations. Prior to the research, a pilot study was carried out in order to avoid ambiguities from the knowledge test. After this, the questions have been adjusted and a final version has been made (appendix X).
money in advertising, or purchase an upgrade that increases popularity') and four open-ended items (e.g. 'Visits and service time are two concepts influencing sales. Name for each concept four actions you can do to increase the amount of sales'). The last set of items is about heuristic knowledge, these items focus on specific actions in possible game situations. All four items are open-ended where participants were asked to explain their actions and reasoning in the specific game situation (e.g. 'Your popularity with a stand in the park is 30%. The news report states: "Children think lemonade is not 'cool'." The weather forecast indicates rainy weather with around 15°C (60°F). Your recipe is set to 8 lemons, 3 sugar, and 3 ice cubes and the price is set to $2.25. Many customers say it is too expensive. Please describe in a detailed way which actions you are going to do to prepare for the next day and provide a reason for each action').
The knowledge test is scored according to a codebook, which specifies the correct definitions and concepts that should be displayed in the answer. This codebook was developed as a result of studies of Albers (2008), Van der Meij et al. (2013), and Walther (2013), definitions of game concepts, the game
Lemonade Tycoon 2 New York, and answers given by the students. True/false and multiple-choice items are scored with 1 point for the correct answer. Open-ended items were not allowed to overlap and are scored with 0.5 point per correct answer and 0.5 point for correct reasoning with a maximum score of 3 or 4 points. The codebook can be found in appendix XI.
3.3. Procedure
were noted and students reviewed and adjusted their final concept map versions. In the last phase, all participants completed the game motivation questionnaire and knowledge test.
3.4. Analysis
Game experience
Before analysing the results, reliability checks were performed on the test and questionnaires. The constructs game experience in general, game hours in general, strategy game hours, and Lemonade Tycoon hours are evaluated. Kruskal-Wallis H tests were used per construct in order to test whether there is significant difference between the three conditions in game experience.
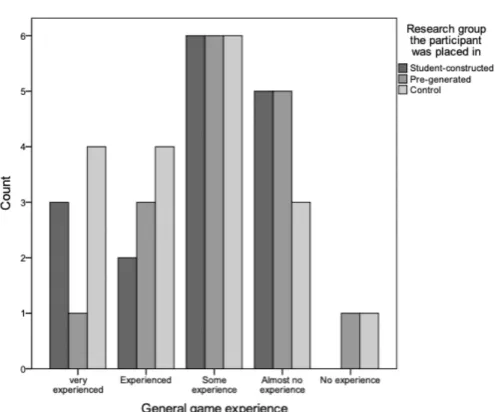
[image:19.595.69.317.363.569.2]General game experience was measured with five ordinal values ranging from "very experienced" to "no experience". Results (Figure 4.) reveal approximately the same distribution among the three conditions in general game experience. However, a few more participants in the student-constructed condition scored themselves ‘very experienced’ compared to the pre-generated and control condition. A Kruskal-Wallis H test showed no significant differences in general game experience between the different concept mapping treatments, χ2(2) = 1.765, p = 0.414.
Figure 4.: General game experience within conditions
In addition to the perception of their own level in game experience, the actual game hours in general
difference in general game hours among the groups. Post-hoc analysis revealed that the differences can be found in the higher score of the control condition, concluding that the students in the control group spent more hours on playing games.
Figure 5.: General game hours within conditions
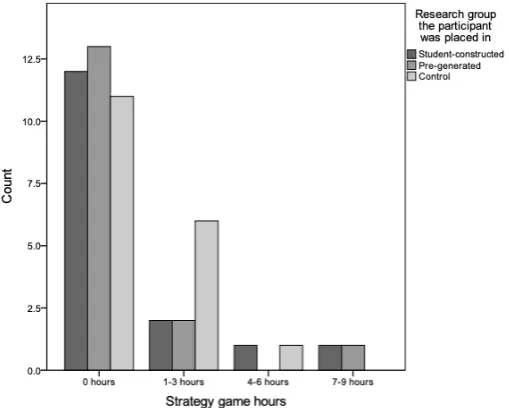
Students strategy game hours is measured with the same ordinal values as the construct game hours in general. The higher score represents the more hours students spent on playing strategy games. Results in Figure 6. show an approximately same distribution among the conditions. A Kruskal-Wallis H test also showed no significant differences in strategy game hours between the different concept mapping treatments, χ2(2) = 1.309, p = 0.520.
[image:20.595.65.320.499.703.2]The construct Lemonade Tycoon hours was measured with the same scale values as game hours in general and strategy game hours. Since no student ever played a lemonade tycoon game, no differences were found between the three conditions.
It can be concluded that the three conditions are not statistically different in their own perception of level of game experience, strategy playing time and Lemonade Tycoon playing time. However, a statistically significant difference was found in the general hour’s students played games. As a result, this construct will be used as a covariate in further analysis.
Game motivation
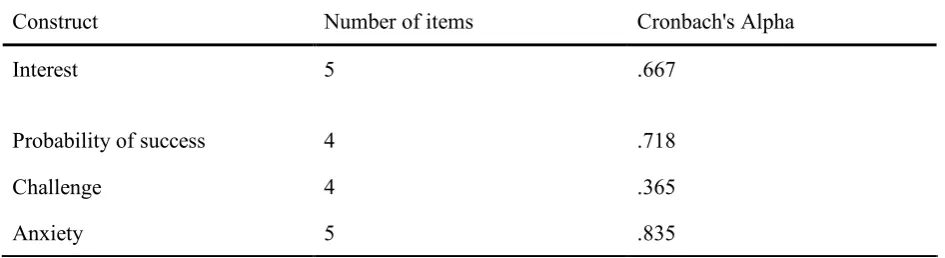
Before conducting the statistical tests regarding students' motivation, the assumption of reliability was evaluated and determined using the internal consistency coefficient of the game motivation questionnaire. The internal consistency coefficient of the constructs interest, probability of success,
challenge, and anxiety are shown in Table 1. Although the internal consistency of the construct challenge
is lower than .7, the reliability of this subscale in the original instrument (Rheinberg, Vollmeyer, and Burns, 2001) is high enough. Therefore, all subscales where considered reliable and where used for further analyses.
Furthermore, the assumption of homogeneity of variances was tested and satisfied for the construct’s probability of success and interest with Levene's F test, F(47,2) = .079, p = .924 for probability of success, and F(47,2) = 2.111, p = .132 for interest. Levene's F test for the constructs challenge and
anxiety revealed that the assumption for homogeneity of variances was not satisfied with F(47,2) = 4.366,
p = .018 for challenge, and F(47,2) = 3.425, p = .041 for anxiety.
Since the assumption for homogeneity of variances was not met for the construct anxiety, further analysis is carried out with a non-parametric Kruskal-Wallis test. As well as the assumption for homogeneity of variances and internal consistency of the construct challenge was not met, the construct
Table 1.: Internal consistency (Cronbach's Alpha) of the motivation scales
Construct Number of items Cronbach's Alpha
Interest 5 .667
Probability of success 4 .718
Challenge 4 .365
Anxiety 5 .835
Game scores
Prior to analysing whether there is a statistically significant difference between the conditions in game score, the assumption of homogeneity of variances was tested and satisfied with Levene's F test,
F(47,2) = 1.325, p = .276. Significant difference between the conditions in game scores was tested with two one-way analyses of variances (ANOVA) for the first and second game round with corresponding post hoc tests if necessary.
Knowledge test scores
Furthermore, prior to analysing the knowledge test scores, the assumption of homogeneity of variances was tested and satisfied with Levene's F test, F(47,2) = 1.090, p = .345. Results of the knowledge test were evaluated with a one-way ANOVA test. Correlations between the game scores and the knowledge test have been evaluated.
Student- constructed concept map analyses.
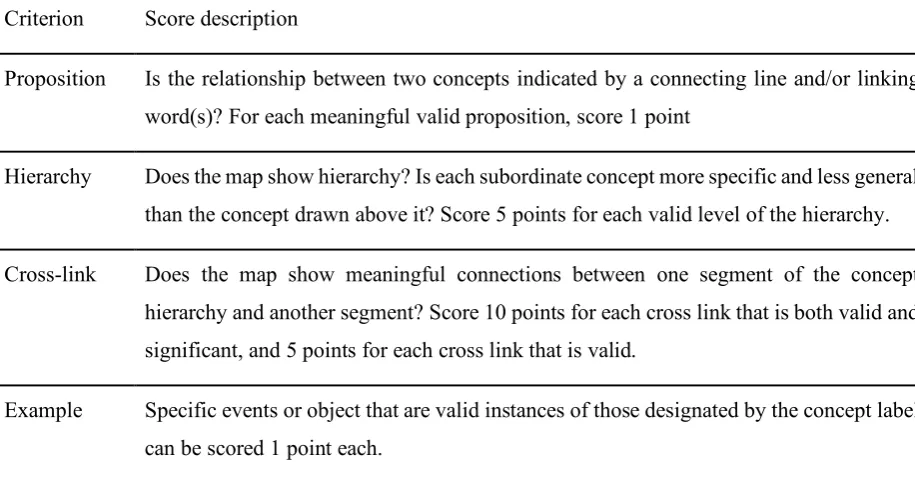
Table 2.: Concept map assessment criteria
Criterion Score description
Proposition Is the relationship between two concepts indicated by a connecting line and/or linking word(s)? For each meaningful valid proposition, score 1 point
Hierarchy Does the map show hierarchy? Is each subordinate concept more specific and less general than the concept drawn above it? Score 5 points for each valid level of the hierarchy.
Cross-link Does the map show meaningful connections between one segment of the concept hierarchy and another segment? Score 10 points for each cross link that is both valid and significant, and 5 points for each cross link that is valid.
Example Specific events or object that are valid instances of those designated by the concept label can be scored 1 point each.
Source: Novak and Gowin (1984)
4. Results
This section presents the results for each research question. First, the research question whether concept mapping affects students' game motivation is presented. Then, results of the second research question whether concept mapping improves students' learning outcomes will be discussed. Thereafter, the correlation between game score and knowledge test score is presented.
To what extent does the implementation of concept maps in game-based learning influence students' initial motivation (interest, challenge, probability of success, anxiety) compared to learners who play the game without concept maps?
Students' game motivation is measured with three constructs: interest, probability of success, and
anxiety. The constructs interest and anxiety are measured with five items on a 7-point Likert scale, and
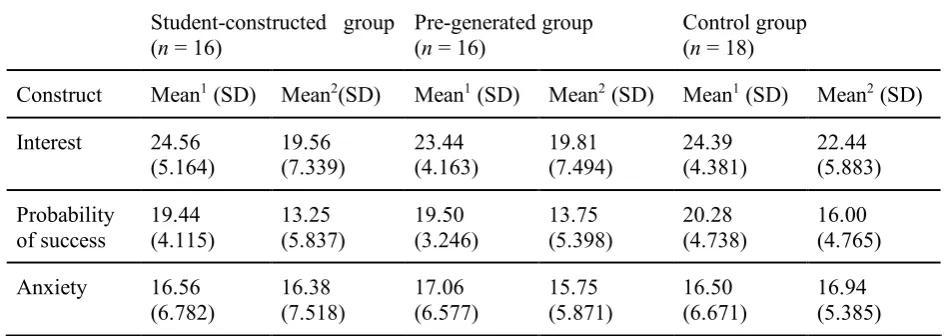
probability of success is measured with four items on a 7-point Likert scale. The descriptive statistics associated with students' pre- and post-test game motivation scores across the three conditions are reported in Table 3.
Students anxiety for not succeeding in the game approximately stayed the same after playing the game, only the control group scored slightly higher on anxiety in the post-test.
Table 3: Descriptive statistics game motivation
Student-constructed group (n = 16)
Pre-generated group (n = 16)
Control group (n = 18)
Construct Mean1 (SD) Mean2(SD) Mean1 (SD) Mean2 (SD) Mean1 (SD) Mean2 (SD)
Interest 24.56 (5.164) 19.56 (7.339) 23.44 (4.163) 19.81 (7.494) 24.39 (4.381) 22.44 (5.883) Probability of success 19.44 (4.115) 13.25 (5.837) 19.50 (3.246) 13.75 (5.398) 20.28 (4.738) 16.00 (4.765)
Anxiety 16.56 (6.782) 16.38 (7.518) 17.06 (6.577) 15.75 (5.871) 16.50 (6.671) 16.94 (5.385)
Note. The maximum score for the constructs interest and anxiety is 35, and 28 for probability of success
and challenge. Mean1 refers to the pre-test motivation questionnaire. Mean2 refers to the post-test motivation questionnaire.
In order to test the hypothesis that adding a concept map as learning support to game-based learning (student-constructed, and pre-generated) had an effect on students' motivation, two separate univariate analyses of covariance (ANCOVA) for the constructs interest, probability of success, and a non-parametric Kruskal-Wallis H test for anxiety were carried out.
A higher score for the construct interest represents the more interest students had in the game. The average scores on the post-test was 20.44 for the student-constructed group, 20.19 for the pre-generated group, and 17.56 for the control group. An independent between subjects ANCOVA, with the game motivation pre-test as covariate, showed no significant differences in interest between the different concept mapping treatments with F(2, 46) = 1.977, p = .150.
A higher score for probability of success represents students' considerations about their ability to succeed in the game. The average scores on the post-test was 18.75 for the student-constructed group, 18.25 for the pre-generated group, and 16.00 for the control group. An independent between subjects ANCOVA, with the game motivation pre-test as covariate, showed no significant differences in probability of success
between the conditions with F(2, 46) = 1.154, p = .324
construct anxiety between the different concept mapping treatments χ2(2) = .229, p = .892, with a mean rank score of 25.09 for student-constructed group, 26.91 for pre-generated group and 24.61 for the control group.
To what extent does the use of concept maps in a game-based learning environment improve students' learning outcomes compared to learners who play the game without concept maps?
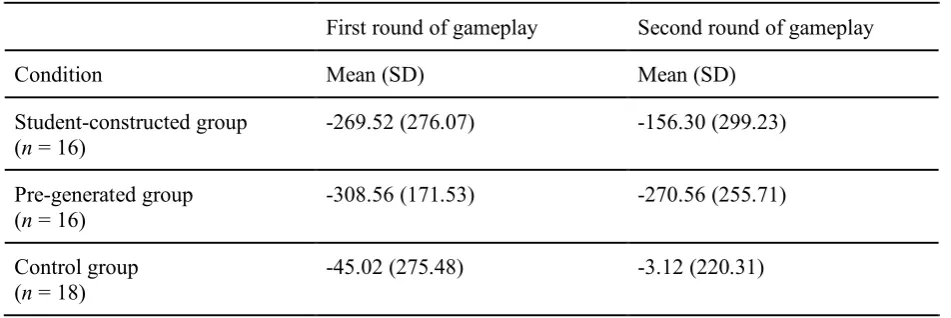
Participants started their gameplay with 500 dollars. Depending on their strategies participants made a profit or loss during the day. Students game score is measured after playing fifteen game days in Time Challenge mode. The lowest score participants can achieve is -500, lower is not possible since students are bankrupt at that moment. The highest score in this research was $409.56. The descriptive statistics associated with students' first and second game score are reported in Table 4. In order to test the hypothesis that adding a concept map as learning support to game-based learning (student-constructed, pre-generated) had an effect on students' game score, two one-way ANOVAs were performed.
[image:25.595.67.543.451.610.2]It can be seen that all conditions scored on average slightly higher in the second round of gameplay compared to their first round of gameplay. The control group has achieved the highest average with -45.02 in the first round, and -3.12 in the second round. Furthermore, for the experimental groups the standard deviations increased a little on average in the second game score in comparison with the first game score, in contrast to the control group where the standard deviation has decreased.
Table 4: Descriptive statistics game scores
First round of gameplay Second round of gameplay
Condition Mean (SD) Mean (SD)
Student-constructed group (n = 16)
-269.52 (276.07) -156.30 (299.23)
Pre-generated group (n = 16)
-308.56 (171.53) -270.56 (255.71)
Control group (n = 18)
-45.02 (275.48) -3.12 (220.31)
highest scores were achieved in the control group (mean = -61.676), compared to the student-constructed (mean = -260.87) and pre-generated condition (mean = -298.47). Another one-way ANCOVA was conducted to compare the scores of the second game round between the three conditions, using general game hours as a covariate. Results showed no significant difference in the second game score with F(2, 46) = 2.146, p = .129.
Second, significant results between the first- and second rounds of game play among the three conditions were examined. Results of three paired sampled t-tests showed no significant results with t(15) = -1.685, p = .113 for the student-constructed group, t(15) = -.778, p = .448 for the pre-generated group, and t(17) = -,717, p = .483 for the control group.
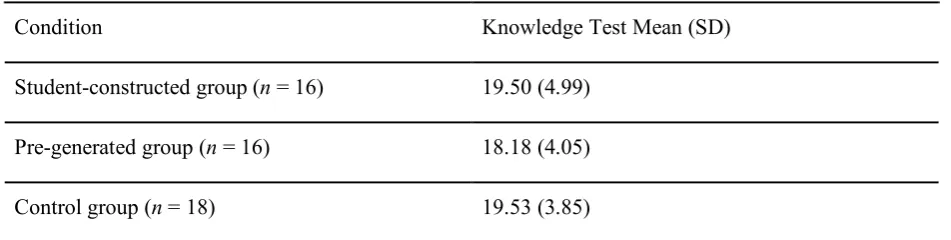
[image:26.595.67.543.408.528.2]In order to test the hypothesis whether games supported with concept maps could yield higher learning outcomes on the knowledge test than games without a learning support, the differences of average scores from the knowledge test between the experimental groups and the control group was compared with an ANOVA test. The descriptive statistics associated with students' knowledge test scores are reported in Table 5. It can be seen that each condition had about the same average score for the knowledge test. The student-constructed group and control group scored on average slightly higher than the pre-generated group.
Table 5: Descriptive statistics knowledge test
Condition Knowledge Test Mean (SD)
Student-constructed group (n = 16) 19.50 (4.99)
Pre-generated group (n = 16) 18.18 (4.05)
Control group (n = 18) 19.53 (3.85)
Note. The maximum score for the knowledge test is 34.
An independent between-subject ANOVA revealed no statistically significant effects. Results showed no significant differences in knowledge test scores between the conditions with F(2, 47) = .517, p = .600. Therefore, these results indicate that the three conditions do not differ in knowledge test scores.
Is there a relationship between game score and knowledge test score?
score in the first round and the knowledge test score (r = -.03, p = .82). Also, no significant correlation was found between the game score in the second round and the knowledge test score (r = .25, p = .08).
Therefore, it can be concluded that there is no relationship between the game scores and the knowledge test scores.
Concept map scoring
Results in Table 6. shows the student-constructed concept maps had a lower score compared to the pre-generated concept map. These results are expected since the pre-pre-generated map is designed by the researcher for students to provide an overview of the learning content. Student-constructed maps have less depth and may be less complex compared to the pre-generated map. However, although some student-constructed maps scored above average, a number of students scored low to very low on their concept map.
[image:27.595.63.532.447.582.2]Examples of a student-constructed concept maps about maximising profits in a lemonade business is shown in Figure 3. The first photo shows a decent quality concept map; there are many valid propositions and a clear hierarchy between the concepts. Nevertheless, there was no cross link or example included in this map. The second photo shows a poor example of a student-constructed concept map: there are a few propositions but most of them have invalid relationships. For example, the popularity of the stand should not be linked to the supplies; sugar, lemon, ice cubes, and cups but to the concept’s visibility or marketing etc. There were also no cross links or examples included in this map.
Table 6: Descriptive statistics student-constructed concept maps (n = 16)
Criterion Pre-generated Mean student-constructed (SD)
Minimum score observed
Maximum score observed
Propositions 46 25.94 (7.009) 10 37
Hierarchy 25 15.63 (7.274) 0 25
Cross links 30 6.25 (10.408) 0 20
Examples 1 .13 (.500) 0 0
Total score 102 47.94 (17.525) 10 82
5. Discussion and conclusion
findings are given, limitations of this study are discussed, and opportunities for future research are suggested.
Research has shown that learning with digital game-environments can be facilitated and stimulated when they are supported with learning supports (e.g. Wouters et al., 2013). Concept maps can be used as an effective visualized learning tool helping students linking new learning experiences with their prior knowledge in an organized manner (Chiou, 2008; Coller & Scott, 2009). In addition, pre-generated concept maps can be used as learning support by focusing the learner on the information that is important, supporting them with the processing of information in a way that is less load intensive (Ausubel, 1960).For these reasons it was assumed that students in the experimental conditions would score better in both the game and the knowledge test than students in the control condition who played the game without a concept map.
However, the study revealed no significant improvement in game score in the second game round. Game scores revealed that learners were not very successful in the game, as indicated by the negative average scores of all conditions. Playing the game in combination with concept mapping as learning support was predicted to have a positive effect on the game score since concept maps enable students to succeed in problems that may otherwise be too difficult (e.g. Quintana et al., 2004). However, participants in the experimental groups using a concept map did not improve their game score more that participants who played the game without a concept map.
In addition, no significant difference in the knowledge test score was revealed between the conditions. The knowledge test scores, which related to the game content, were relatively average. Participants in the experimental conditions did not score higher on the knowledge test than participants in the control group. Playing the game with a concept map was predicted to have a positive effect on students' learning gains. However, this outcome indicates that concept mapping did not stimulate learning with games. Further analyses revealed no differences between the student-constructed condition and the pre-generated condition.
Also, no correlations were found between the game scores and the knowledge test scores. This result indicates that participants who scored well in the game, did not achieved a better knowledge test score than participants who had a lower game score. This indicates that a higher game score does not assure a higher knowledge test score. This result is the opposite of what was expected, since the game score has construct validity and should correlate positively with the test scores since both measures are about the same concepts and constructs.
since students needed to re-examine concepts from the game in formal terms, possibly leading to less fun gameplay (Barzilai & Blau, 2013; Charsky & Ressler, 2011). However, results of this study showed no statistically significant differences in game motivation among the three conditions, concluding that concept mapping in both experimental conditions did not decrease the positive perceptions towards the game.
Game score results revealed a higher score in the second game round for all conditions. However, all mean scores are negative in all three conditions. These scores may reflect on possible difficulties participants had with the game. It could be that participants did not understand the intuitive knowledge representations in the game on how they needed to make as much profit as possible in the game, or they may be affected by the large amount of information and choices in the game (Wouters et al., 2013). Because of this,transfer to explicit understandings about the concepts: costs, price, profit, and their relationships in the knowledge test may not happen, resulting in relatively average scores in the knowledge test.
This could be explained due to the fact that participants learned through an experiential learning strategy and did not engage in reflective learning strategies. The concept mapping strategies used in this study may not have supported students enough to develop understandings about concepts, principles, and structures used in the game, resulting in difficulties applying the elements they have learned in other contexts (Leemkuil & de Jong, 2004; Leemkuil, 2006). According to Canas, Reiska and Novak (2016) concept maps need to cover several criteria in order to achieve a decent quality. Three of the five criteria were already covered in this study since the main problem of the topic and a list of possible concepts was given ensuring that all concepts were relevant and the opportunity to deviate from the subject was minimized. However, results of the student-constructed maps differed widely. Good quality concept maps were developed, but some concept maps were not sufficient in quality due to missing concepts and invalid relationships. For example, some students only used a few concepts from the provided list. In other cases, students continued adding more and more concepts without relevant relationships and structure. This shows that students might have had difficulties building a good concept map.
the links and labels presented in the concept map provide meaningful information, students may ignore this (McCagg & Dansereau, 1991). Several researchers have suggested that mastering the techniques to construct a concept map may be difficult and time-consuming (Camperell & Reeves, 1982; Camperell & Smith as cited in McCagg & Dansereau, 1991). The non-significant results of the game scores and knowledge test scores in this study could be a result of insufficient training materials and practice time. It is therefore advisable in follow-up research to take students’ prior knowledge of concept mapping into account. A recommendation for future research would be to offer more practice for students to learn the mechanics behind concept mapping.
Another reason for the non-significant results may be related to students’ behaviour. It might be difficult to activate participants’ intrinsic motivation. Students’ participated in this study in order to receive mandatory study credits, resulting in students’ who are extrinsically motivated instead of intrinsically motivated.This was also reflected in the given answers of the knowledge test. Participants had to answer open-ended questions in short sentences or phrases, with a maximum of four answers per question. However, regarding the length of the answers it has to be noted that they differed widely from each other. While many participants took the time and effort to answer these questions, quite a few did not answer all questions optimally. It was notable that some students began to write answers in a hurry when they approached the end of the appointment or other students had already left the room. In doing so, they may have lost focus during the answer process, leading to incomplete answers and therefore not receiving all the points they could get. Therefore, it is highly recommended for future research to focus on settings where there is no possibility for participants to be extrinsically motivated.
In addition to this,it could be that students in the experimental conditions did not took the time to read or use the materials. Despite the fact that they were stimulated to do so, they could not be forced to read the pre-generated map or construct a concept map of good quality (VanderCruysse et al., 2016). Previous studies already showed that instructional supports remain frequently unused (Nelson, 2007 as cited in VanderCruysse et al., 2016). If the students have not used the provided materials and information in a proper way, the experimental groups may act like the control condition. However, giving students the freedom to plan, monitor, and perform their own learning activities is in line with the idea that learners should be active agents in their own learning process (Bransford et al., 2002).
participants may have used their logical knowledge to think about what is involved in running a lemonade stand. This may lead to questions being answered in a logical way without the need to play the game correctly (Walther, 2013). This may result in the non-significant differences between the experimental and the control groups in the knowledge test and the non-relationship between the game score and knowledge test score. It is therefore advisable to implement quantitative data analyses in future research to examine the underlying principles of students’ critical thinking and learning with concept maps as learning support.
The learning support did have a negative impact on students' motivation. Results revealed a higher score in positive attitude towards the game with the constructs interest, and probability of success in the control group. Although the result is not significant, a possible reason for the higher scores in the control group can be related to students' game experience. Since students in the control group had on average more experience playing digital games. They may have had an advantage since their experience could have ensured that they understood the game faster and may have had more fun (Kiili, 2005), resulting in a higher score for interest and motivation. This is in line with Vollmeyer and Rheinberg (2006) stating that the duration and frequency of the learning activity can mediate the effect of motivation on learning.
A similar result was found in research of Charsky and Ressler (2011), who conducted a related study and examined participants’ learning outcomes after developing concept maps based on game content. Results revealed significantly lower learning motivation in the experimental condition after playing the game, compared to students who learned only with the game. According to the researchers, the cause for these lower results after playing the game would have been the interruption of the game process. Constructing the maps was an interference to the students instead of a learning support. These experiences are a result that concept mapping is not always effective if there is not carefully considered when and how the learning support is implemented in the learning process (Hwang et al., 2013). Concluding, the lower, although not significant, motivational results of this study could be due to bad integration of the concept maps in the specific game since the concept maps are offered externally. Charsky and Ressler (2011) also concluded that using concept maps could cause negative results unless the learning support can be well integrated in the game. Therefore, an internally supported concept map approach may assist students in better learning performances. Comparing and analysing students’ learning progress with internally and externally integrated concept maps as learning support in a game-based environment is a suggestion for future research.
However, there are limitations that should be considered when interpreting the results discussed above. First of all,the game Lemonade Tycoon 2 New York is a commercial-off-the-shelf computer game, not a game designed for educational learning purposes. Learning objectives may be hidden in the game so they are not necessarily easy to identify for students. These learning objectives will be easier to find in a game specifically designed for game-based learning. Second, no statistically significant effects of adding concept mapping as learning support were revealed. This may be caused by the short period of time for this research.It may be possible that students did not have enough time to learn the game or process the concept map. It could also be that the time students paid attention to the concept map was too short to remember all concepts and relationships, leading to non-significant results for the learning outcomes and correlation between the game score and the knowledge test. It can be assumed that scores are more likely to improve and more likely to correlate to the test score when students have more time and opportunities to play the game (Van der Meij et al., 2011).Third, this study only focused on two concept mapping techniques based on previous research: student-constructed and pre-generated concept mapping. Other methods of concept mapping may lead to other results, partially-filled concept maps for example. Finally, this study was designed for this specific game. Consequently, the results may not be generalisable to other contexts and games. Therefore, it might be beneficial to use other types of games in future research to examine the effects of pre-generated and student-constructed concept maps in game-based learning environments. Also, it would be interesting to take the possibility of providing direct feedback into account for student-constructed concept mapping techniques to improve the quality of the constructed maps.
References
Ausubel, D. P. (1968). Educational psychology: A cognitive view. New York: Holt, Rinehart & Winston.
Admiraal, W., Huizenga, J., Akkerman, S., & Dam, G. T. (2011). The concept of flow in collaborative game-based learning. Computers in Human Behavior, 27(3), 1185-1194. Albers, E. (2008) Het Collaboratief Spelen van een Educatieve Game. Master thesis, Enschede,
University of Twente.
Bakker, M., Van den Heuvel-Panhuizen, M., & Robitzsch, A. (2016). Effects of mathematics
computer games on special education students' multiplicative reasoning ability. British Journal of Educational Technology,47(4), 633-648.
Barzilai, S., & Blau, I. (2014). Scaffolding game-based learning: Impact on learning
achievements, perceived learning, and game experiences. Computers and Education, 70, 65–79. https://doi.org/10.1016/j.compedu.2013.08.003
Cañas, A. J., Reiska, P., & Novak, J. D. (2016, September). Is My Concept Map Large Enough? In International Conference on Concept Mapping (pp. 128-143). Springer, Cham. Charsky, D., & Mims, C. (2008). Integrating commercial off-the-shelf video games into school
curriculums. TechTrends, 52(5), 38–44. https://doi.org/10.1007/s11528-008-0195-0 Charsky, D., & Ressler, W. (2011). ‘Games are made for fun’: Lessons on the effects of concept
maps in the classroom use of computer games. Computers and Education, 56(3), 604–615. https://doi.org/10.1016/j.compedu.2010.10.001
Cheon, J., Chung, S., Song, J., & Kim, Y. (2013). An investigation of the effects of a graphic
organizer in an online serious game on learning outcomes and attitudinal perceptions. Interactive Learning Environments,23(4), 437-452. doi:10.1080/10494820.2013.788030
Clark, D. B., Nelson, B. C., Chang, H.-Y., Martinez-Garza, M., Slack, K., & D’Angelo, C. M. (2011). Exploring Newtonian mechanics in a conceptually-integrated digital game: comparison of learning and affective outcomes for students in Taiwan and the United States. Computers and Education, 57(3), 2178–2195.
Coller, B.D., and Scott, M.J. (2009) “Effectiveness of using a video game to teach a course in mechanical engineering”, Computers & Education, Vol. 53, No. 3, pp 900-912.
Cramer, D., & Howitt, D. (2004). The SAGE dictionary of statistics. London: SAGE.
Dempsey, J., Haynes, L., Lucassen, B., & Casey, M. (2002). Forty simple computer games and what they could mean to educators. Simulation & Gaming,33(2), 157-68.
Dorsselaer, van S., Tuithof, M., Verdurmen, J., Spit, M., Van Laar, M. & Monshouwer, K. (2016).
Utrecht: Trimbos instituut.
Ebner, M., & Holzinger, A. (2007). Successful implementation of user-centered game based
learning in higher education: An example from civil engineering. Computers & Education,49(3), 873-890. doi:10.1016/j.compedu.2005.11.026
Garris, R., Ahlers, R., & Driskell, J. E. (2002). Games, motivation, and learning: A research and
practice model. Simulation Gaming, 33(4), 441–467. http:// dx.doi.org/10.1177/1046878102238607.
Hagemans, M.G., Van der Meij, H., & De Jong, T. (2013). The effects of a concept map-based
support tool in simulation-based inquiry learning. Journal of Educational Psychology, 105(1), 1-24)
Hilbert, T. S., Nuckles, M., & Matzel, S. (2008). Concept mapping for learning from text: evidence for a worked-out-map-effect. ICLS, 1, 358-365.
Hilbert, T., & Renkl, A. (2008). Concept mapping as a follow-up strategy to learning from texts: What characterizes good and poor mappers? Instructional Science,36(1), 53-73.
Ke, F. (2009). A Qualitative Meta-Analysis of Computer Games as Learning Tools. Gaming and Simulations. doi:10.4018/9781609601959.ch701
Kiili, K. (2005). Digital game-based learning: towards an experiential gaming model. The Internet and Higher Education, 8, 1, 13–24. doi: 10.1016/j.iheduc.2004.12.001.
Kolb, D. A. (1984). Experiential Learning: Experience as the source of learning and development. Englewood Cliffs, NJ: Prentice-Hall.
Kwon, S. Y., & Cifuentes, L. (2009). The comparative effect of individually-constructed vs.
collaboratively-constructed computer-based concept maps. Computers & Education, 52(2), 365– 375.
Leemkuil, H. (2006). Is it all in the game? Doctoral dissertation, Enschede, University of Twente. Leemkuil, H., & de Jong, T. (2004). Games en gaming. In P. Kirschner (Ed.), ICT in het onderwijs:
The next generation (pp. 41-63). Alphen aan de Rijn: Kluwer B.V Lemonade Tycoon 2 - New York Edition. (n.d.). Retrieved from
http://www.shockwave.com/gamelanding/lemonade2.jsp
Li, M., & Tsai, C. (2013). Game-Based learning in science education: A review of relevant research. Journal of Science Education and Technology, 22(6), 877-898.
Malone, T. W. (1981). Toward a theory of intrinsically motivating instruction. Cognitive Science, 5(4), 333–369.
Mayer, R. E. (2001). Multimedia learning. New York: Cambridge University Press.
mapping as a learning strategy. Journal of Educational Research, 84, 317–324.
Novak, J. & Canas, A. (2008). The theory underlying concept maps and how to construct and use them. Práxis Educativa,5(1), 9-29.
Novak, J. D., & Gowin, D. B. (1984). Learning how to learn. Cambridge: Cambridge University Press. Oblinger, D. (2004). The next generation learner. Retrieved november 24, 2018, from
https://net.educause.edu/Elements/Attachments/conference/aascu08/presentation_1.pdf O’Donnell, A. M., and Dansereau, D. F. (2000). Interactive effects of prior knowledge and
material format on cooperative teaching. J. Exp. Educ. 68: 101–118.
O'Donnell, A.M., Dansereau, D.F. & Hall, R.H. Educational Psychology Review (2002) 14: 71. https://doi.org/10.1023/A:1013132527007
Papastergiou, M. (2009). Digital game-based learning in high school computer science education: Impact on educational effectiveness and student motivation. Computers & Education, 52(1), 1-12. Pea, R. D. (2004). The social and technological dimensions of scaffolding and related theoretical
concepts for learning, education, and human activity. Journal of the Learning Sciences, 13, 423– 451.
Prensky, M. (2001). Digital game-based learning. New York: McGraw-Hill.
Quintana, C., Reiser, B. J., Davis, E. A., Krajcik, J., Fretz, E., Duncan, R. G., . . . Soloway, E. (2004). A Scaffolding Design Framework for Software to Support Science
Inquiry. Journal of the Learning Sciences,13(3), 337-386. doi:10.1207/s15327809jls1303_4
Reiser, B. J. (2004). Scaffolding complex learning: The mechanisms of structuring and problematizing student work. Journal of the Learning Sciences, 13, 273–304. Rheinberg, F., Vollmeyer, R., & Burns, B. D. (2001). FAM: Ein Fragebogen zur Erfassung
aktueller Motivation in Lern- und Leistungssituationen. Diagnostica, 47(2), 57–66. http://dx.doi.org/10.1026//0012-1924.47.2.57
Shapiro, S. S., & Wilk, M. B. (1965). An Analysis of Variance Test for Normality (Complete Samples). Biometrika, 52(3/4), 591-611.
Sitzmann, T. (2011). A meta-analytic examination of the instructional effectiveness of computer-based simulation games. Personnel Psychology, 64, 489–528.
Sun, R., Merrill, E., & Peterson, T. (2001). From implicit skills to explicit knowledge: A
bottom-up model of skill learning. Cognitive Science, 25, 203-244. doi: dx.doi.org/10.1016/S0364-0213(01)00035-0