
Room Temperature Deformation Behavior of Zn 22 mass%Al Alloy with Nanocrystalline Structure
6
0
0
Full text
(2) 2450. T. Tanaka, K. Makii, A. Kushibe and K. Higashi Table 1 The optimal tensile conditions at room temperature of Zn–Al eutectoid alloys obtained by various processes.. Y. Kaneko et al. M. Kato et al. M. Hirohashi et al. K. Takeoka et al. K. Makii et al.. Process. Grain size (µm). Flow stress (MPa). Strain rate (s−1 ). Elongation to failure (%). Ref.. ECAP Hot-Rolling Hot-Rolling Extrusion TMCP. 1 0.5 0.8 1 0.1. 109 73.6 137 76.6 42.7. 7 × 10⁻⁴ 2 × 10⁻⁴ 2 × 10⁻³ 4 × 10⁻⁴ 2 × 10⁻⁴. >200 166 182 67 240. 12) 22) 23) 18) 26). Fig. 1 Microstructures of the specimens prior to deformation (TEM): the bright and dark grains are Al-rich and Zn-rich phases, respectively. 400. Table 2 Chemical compositions of mechanically alloyed material (mass%). Si. Fe. Ti. Ni. Zn. 21.2. <0.001. <0.001. <0.001. <0.001. Bal.. A final rolling was performed using TMCP technology. Tensile samples of 18 mm gauge length and 6 mm diameter were machined from these rolled ingots, with the gauge length parallel to the rolling direction. Tensile tests were carried out at temperatures between 273 (0.41Tm ) and 473 K (0.72Tm ) with a wide range of strain rates, from 10−6 to 10−1 s−1 , in air. Microstructures of the samples were examined using transmission electron microscopy (TEM). After small disks with a diameter of 3 mm were punched out, the samples were polished to a thickness of ∼ 150–180 µm. A twin-jet electropolishing unit was then used with a solution of 10%HClO4 , 20%C3 H8 O3 and 70%C2 H5 OH. The samples were thinned at 273 K until perforation.13) 3. Results and Discussion 3.1 Microstructures A typical microstructure of this alloy is shown in Fig. 1. The grain size d was estimated using the equation d = 1.74L: L is the linear intercept length. The bright and dark grains correspond to the Al-rich and the Zn-rich phases, respectively. From Fig. 1(a), it was basically found that the grain size of equiaxed Al-rich and Zn-rich phases was about 1.3 µm. In addition, Fig. 1(b) shows that many Zn particles were locally observed in Al-rich phases and had grains of less than 100 nm in diameter. More than 80% of the Zn nanocrystalline particles were distributed in the Al-rich phase. These particles were spread uniformly across almost all regions of the Al-. 1 0 -1 s- 1. 350. Zn-22mass%Al 288K. 300. True Stress, MPa. Al. 1 0 -2 s - 1. 250. 1 0- 3 s - 1. 200. 1 0-4s - 1 150. 1 0 -5 s- 1. 100. 50. 0 0. 0.2. 0.4. 0.6. 0.8. 1. 1.2. True Strain. Fig. 2 Typical true stress-true strain curves of Zn-22 mass%Al alloy at a testing temperature of 288 K for constant true strain rates of 10−5 to 10−1 s−1 .. rich phase. The microstructural features were a little different from those reported previously; the material used in the present study was very unique.8, 27, 28) Therefore, it is necessary to investigate the effects of these features on the deformation behavior of nanocrystalline Zn particles. 3.2 Stress-strain behavior Figures 2–4 show typical true stress-true strain curves at constant true strain rates from 10−5 to 10−1 s−1 . The testing temperatures ranged from 273 to 373 K. The flow stress, at a fixed true strain of 0.1, was determined from each sample tested at a given temperature and strain rate. It was found that the flow stress was high due to the deformation near room temperature and also was very sensitive to the strain rate and temperature. Typical superplastic materials exhibit a classi-.
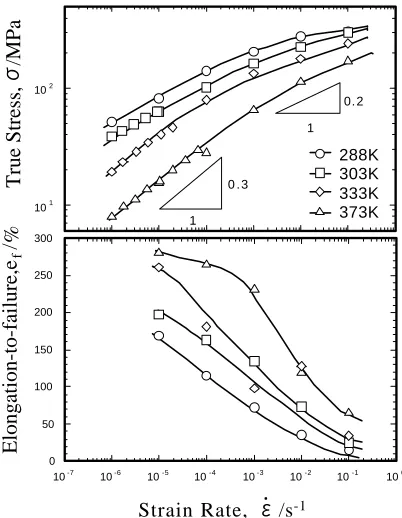
(3) Room Temperature Deformation Behavior of Zn-22 mass%Al Alloy with Nanocrystalline Structure. 2451. 400. True Stress, MPa. 350. Zn-22mass 303K. 1 0-1s - 1. 300. Undeformed Specimen. Al. Zn-22 Al. 1 0- 2 s - 1. 250. Deformed Specimens. 1 0- 3 s - 1 200. 1 0- 4 s - 1 150. 1 0- 5 s - 1. 100. T = 288K,. =10 -5 , 169. T = 303K,. =10 -5 , 200. T = 333K,. =10 -5 , 261. 50. 0 0. 0.2. 0.4. 0.6. 0.8. 1. 1.2. True Strain. Fig. 3 Typical true stress-true strain curves of Zn-22 mass%Al alloy at a testing temperature of 303 K for constant true strain rates of 10−5 to 10−1 s−1 .. Fig. 5 Macroview of the specimens deformed at different temperature and 10−5 s−1 to fracture.. 250. /MPa. Al. /MPa. Zn-22mass 373K. 1 0- 1 s - 1. 200. True Stress,. 1 0- 2 s- 1. 150. 1 0- 3s- 1. 100. 1 0 -4 s- 1 1 0- 5s- 1. 50. 0.2. 0.4. 0.6. 0.8. 1. 1.2. 0.2 1. 288K 303K 333K 373K. 0 .3 1. 1. 0 0. 10 2. 10. 1.4. True Strain,. Fig. 4 Typical true stress-true strain curves of Zn-22 mass%Al alloy at a testing temperature of 373 K for constant true strain rates of 10−5 to 10−1 s−1 .. cal, well-behaved flat stress-strain curve, i.e., the flow stress remains almost constant during superplastic flow. From Fig. 2 and Fig. 3, the curves at 288 K and 303 K exhibited strain softening at the strain rates above 10−4 s−1 . At the strain rate of 10−5 s−1 , however, the curves did not exhibit strain softening, but a steady state flow and a very slight strain hardening in a manner similar to conventional superplastic alloy. From Fig. 4 (T = 373 K), we see strain softening at strain rates above 10−3 s−1 and strain hardening at strain rates below 10−4 s−1 , as was seen in Figs. 2 and 3. It is considered that the deformation mechanism at the higher strain rates is different from that at the lower strain rates. The maximum elongation at each temperature was obtained at 10−5 s−1 . A macroscopic view of specimens deformed to failure at this strain rate, in comparison with an undeformed specimen, is shown in Fig. 5. It is clear that the deformed specimens exhibit significant elongation, albeit at room temperature. It was reported that Zn-22Al alloy had macroscopically three distinct and identifiable types of fracture: failure by quasistable plastic flow (true superplasticity), [n]ecking (intrinsic plastic failure) and quasibrittle failure.35) In the present study, it is considered that the fracture re-. Elongation-to-failure,e f /. True Stress,. 10mm. 300 250 200. 150 100. 50 0 10 -7. 10 -6. 10 -5. 10 -4. 10 -3. Strain Rate,. 10 -2. 10 -1. 10 0. /s -1. Fig. 6 The variation in (a) σ and (b) elongation-to-failure as a function of strain rate in this study.. sulted from necking, since necking in specimens is visible in Fig. 5. It is considered that the tensile test at low temperature caused a sharp or localized neck, and that the catastrophic failure resulted from the confinement of the deformation to the necked region exclusively. However, the part deformed by quasistable plastic flow was also observed, and it was found that the failure resulting from quasistable plastic flow tended to be dominant when the testing temperature increased above that shown in Fig. 5. 3.3 Strain rate dependence of flow stress and elongation The variation in flow stress as a function of strain rate at four different testing temperatures, 288, 303, 333 and 373 K, is shown in Fig. 6(a). The strain rate sensitivity exponent, m,.
(4) 2452. T. Tanaka, K. Makii, A. Kushibe and K. Higashi. Fig. 7 Surface appearance of the specimens fractured at (a) 303 K and 10−4 s−1 [m = 0.2] (b) 303 K and 10−5 s−1 [m = 0.3] (c) 473 K and 2 × 10⁻² s−1 [m = 0.5]. The tensile direction is horizontal.. Fig. 8 The fracture surface of the specimens deformed at (a) 303 K and 10−2 s−1 [m = 0.2] (b) 318 K and 10−5 s−1 [m = 0.3] (c) 473 K and 2 × 10⁻³ s−1 [m = 0.5].. is the slope of this curve (d ln σ/d ln ε̇). It is apparent from Fig. 5(a) that, at each temperature, the flow curve could be divided into two regions, i.e., the m-value exhibited about 0.3 (n = 3) and above 0.2 (n ≥ 5). It has been reported that the m-value of Zn-22%Al alloys at elevated temperature exhibited 0.5 (n = 2) in the intermediate strain rate regime and from 0.25 to 0.2 (n = 4–5) in the high strain rate regime.27–34) The grain boundary sliding (GBS) could be expected to occur with an m-value of 0.5. On the other hand, dislocation climb and glide controlled by climb could be expected to occur with an m-value of 0.25 to 0.2. Moreover, in the previous investigation the tensile test at room temperature was carried out only in the regime with an m-value of 0.2 at a strain rate above 10−5 s−1 .12, 17, 18, 22–24) In the present study, it was found that the m-value increased from 0.2 to 0.3 at room temperature. Although the strain-rate sensitivity parameter obtained in the high strain rate regime was approximately equal to that obtained from the previous experimental results, that in the intermediate strain rate regime was lower. Therefore, the deformation mechanism of this material near room temperature may be different from the reported superplastic behavior at elevated temperature. Figure 5(b) shows the variation in the elongation-to-failure, ef , at each temperature as a function of the strain rate. In general, it is known that elongation is large when the m-value is high. Therefore, it is expected that the elongation obtained at a low strain rate (m = 0.3) is larger than that obtained at a high strain rate (m ≤ 0.2). From Fig. 5(b), elongation of greater than 200% can be seen at each temperature, in the region where the m-value was 0.3. In another region, where the m-value was below 0.2, the elongation was smaller as the strain rate increased. A maximum value of 200% elon-. gation at room temperature was also obtained at a strain rate of 10−5 s−1 , and the value of elongation tended to increase as the strain rate decreased. Considering that the test was conducted near room temperature, it was apparent that the elongation value was very large. Therefore, it is apparent that the greater the stability in deformation, brought about by a higher m-value, the larger the elongation in the sample. 3.4 Microstructures of deformed specimens In the prior section, a regime was found with an m-value of 0.3 at a lower strain rate and below 373 K. It is necessary to investigate the deformation mechanism in this regime. Therefore, microstructural observations were performed for specimens deformed at the particular conditions that exhibit respective m-values of 0.2, 0.3 and 0.5. The surface appearance of each specimen is shown in Fig. 7: (a), (b) and (c) are of the regimes where the m-values exhibited were 0.2, 0.3 and 0.5, respectively. It is accepted that GBS is the dominant deformation process for high-temperature superplasticity.2) In Fig. 7(a), GBS was not observed on the surface of the deformed specimens. On the other hand, the surface of the specimen in Fig. 7(b), with an m-value of 0.3, was strikingly similar to that of Fig. 7(c), in which the superplastic behavior was obtained and the evidence of GBS was observed. The fracture surfaces of three specimens, each deformed at one of three different conditions, is shown in Fig. 8: where (a), (b) and (c) are of the regimes where the m-values exhibited 0.2, 0.3 and 0.5, respectively. It is apparent that the fracture surface shown in Fig. 8(a) is different from that shown in Fig. 8(b) and (c). In Fig. 8(a), since dimples were observed, it is considered that the specimen is a ductile failure occurring by the growth and coalescence of microvoids aris-.
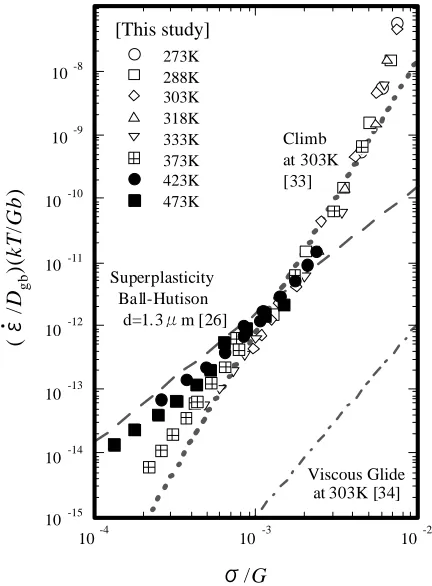
(5) Room Temperature Deformation Behavior of Zn-22 mass%Al Alloy with Nanocrystalline Structure. ing from a preexisting defect or impurity. In Fig. 8(b) and (c), many ledges of about 1.3 µm are observed, and there is no evidence of grain tearing or dimpling. Therefore, these specimens were intergranular fractures, which are typical for the superplastic deformation. From microstructural observations of the specimens tested in the condition with the m-value of 0.3 near room temperature, it is considered that GBS is the dominant deformation process, and that the specimen may be fractured by cavitation, as is possible with the conventional superplastic materials. 3.5 Normalization of the present results In order to compare the present results with the previous, the variation in (ε̇/Dgb ) (kT/Gb) as a function of σ/G is plotted in Fig. 9. The figure also includes three reported constitutive equations: superplasticity (grain boundary sliding accommodated by dislocation climb into boundaries),27) viscous glide (dislocation climb and glide controlled by glide)29) and climb (dislocation climb and glide controlled by climb).34) It was found that the data at 423 and 473 K agreed well with the previously reported trend. When the test was carried out below 373 K, however, a slope of 3 was obtained in the regime below σ/G of about 2 × 10⁻³ , and it deviated from the line with a slope of 2. Also, it was found that the slope was different from the reported line of viscous glide that exhibits the value of 3.29) From the microstructural observations in the prior section, it is considered that the deformation mode with the m-value of 0.3 is similar to the superplastic deformation. The low strain rate sensitivity may therefore be explained by the contribution of the many Zn particles (as observed by TEM) to the plastic flow. It is also possible that some additional factors, such as threshold stress, may have caused the. [This study] 10. (. /Dgb )(kT/Gb). 10. 10. 10. 10. 10. 273K 288K 303K 318K 333K 373K 423K 473K. -8. -9. -10. flow stress to increase near room temperature. Furthermore, it is considered that the factors depend on the testing temperature, since only low temperatures, not high ones, contribute to the deformation flow. 4. Summary The deformation behavior near the room temperature was investigated in Zn-22 mass%Al alloy by means of the TMCP technology. The following results were obtained. (1) The microstructure in this alloy had equiaxed Al and Zn rich phases with grain size of 1.3 µm, many Zn particles were locally observed in Al-rich phases and had grains of less than 100 nm in diameter. (2) The maximum elongation value of 200% albeit at room temperature was obtained at a strain rate of 10−5 s−1 . (3) Two regions with different m-value were observed. One was about 0.3 (n = 3) at lower strain rate, and the other was below 0.2 (n ≥ 5) at higher strain rate at each temperature. This was different from the previous reported true superplastic deformation behavior, because of high flow stress and low m-value. (4) Evidence of grain boundary sliding and intergranular fracture were observed in the regime that has the m-value of 0.3. Microstructural evidence indicated that the dominant deformation mechanism was grain boundary sliding. Acknowledgments The authors are grateful to Dr. H. Watanabe (Osaka Municipal Technical Research Institute) for their helpful comments and to Prof. R. Oshima and Dr. H. Nishizawa (Osaka Prefecture University) for their helpful aids on the TEM analysis, also appreciate the financial support of the Priority Area “Japan foundry engineering society”. This investigation is a part of projects in Innovation Plaza Osaka of Japan Science and Technology Corporation. REFERENCES. Climb at 303K [33]. 1) 2) 3) 4) 5). -11. Superplasticity Ball-Hutison d=1.3 m [26]. -12. 6) 7). -13. 8) 9). 10. -14. 10). Viscous Glide at 303K [34] 10. 11). -15. 10. -4. 2453. 10. -3. 10. -2. 12). /G Fig. 9 The variation in (ε̇/Dgb ) (kT/Gb) as a function of σ/G in Zn-22Al.. 13). F. A. Mohamed and Y. Li: Mater. Sci. Eng. A298 (2001) 1–15. O. D. Sherby and J. Wadsworth: Prog. Mater. Sci. 33 (1989) 166–221. T. G. Langdon: Metall. Trans. 13A (1982) 689–701. K. Higashi, T. Okada, T. Mukai, S. Tanimura, T.-G. Nieh and J. Wadsworth: Mater. Trans., JIM 36 (1995) 317–322. K. Higashi, T. Okada, T. Mukai and S. Tanimura: Scr. Metall. Mater. 25 (1991) 2053–2057. K. Higashi, T. Mukai, S. Tanimura, A. Inoue, T. Masumoto, K. Kita, K. Ohtera and J. Nagahora: Scr. Metall. Mater. 26 (1992) 191–196. R. S. Mishra and A. K. Mukherjee: Superplasticity and Superplastic Forming 1988, in: A. K. Ghosh, T. R. Bieler (Eds.), (The Minerals, Metals & Materials Society, Warrendale, 1998) pp. 109–116. R. S. Mishra, R. Z. Valiev and A. K. Mukherjee: NanoStructured Mater. 9 (1997) 473–476. A. V. Sergueeva, V. V. Stolyarov, R. Z. Valiev and A. K. Mukherjee: Mater. Sci. Eng. A323 (2002) 318–325. R. S. Mishra, V. V. Stolyarov, C. Echer, R. Z. Valiev and A. K. Mukherjee: Mater. Sci. Eng. A298 (2001) 44–50. R. S. Mishra, R. Z. Valiev, S. X. McFadden, R. K. Islamgaliev and A. K. Mukherjee: Philos. Mag. 81 (2001) 37–48. Y. Kaneko, A. Vinogradov, K. Kitagawa and S. Hashimoto: Investigations and Applications of Severe Plastic Deformation, in: T. C. Lowe and R. Z. Valiev (Eds.) (Kluwer Academic Publishers, Dordrecht, 2000) pp. 289–295. M. Furukawa, Y. Ma, Z. Horita, M. Nemoto, R. Z. Valiev and T. G..
(6) 2454. T. Tanaka, K. Makii, A. Kushibe and K. Higashi. Langdon: Mater. Sci. Eng. A241 (1998) 122–128. 14) S.-M. Lee and T. G. Langdon: Mater. Sci. Forum 357–359 (2001) 321– 326. 15) Y. Saito, H. Utsunomiya, N. Tsuji and T. Sakai: Acta Metall. 47 (1999) 579–583. 16) H. Naziri, R. Pearce, M. H. Brown and K. F. Hale: Acta Metall. 23 (1975) 489–496. 17) Y. Motohashi, T. Shibata and M. Miyagawa: J. Japan Inst. Light Metals 33 (1983) 270–282. 18) K. Takeoka, D. Oelschlägel and O. Izumi: J. Japan Inst. Metals 35 (1971) 780–787. 19) J. Negrete, L. Valdés and G. Torres-Villaseñor: Metall. Trans. A 14A (1983) 1931–1934. 20) G. Torres-Villaseñor and J. Negrete: Mater. Sci. Forum 243–245 (1997) 553–556. 21) G. Torres-Villaseñor and J. Negrete: Superplasticity and Superplastic Forming, ed. by C. H. Hamilton and N. E. Paton (The Minerals, Metals & Materials Society, 1998) pp. 51–55. 22) M. Kato, E. Kawai, K. Mutsuzaki and M. Miyagawa: J. Japan Inst. Metals 38 (1974) 539–545. 23) M. Hirohashi, E. Kawai, K. Mutsuzaki and M. Miyagawa: J. Japan Inst.. Metals 41 (1977) 487–492. 24) M. Hirohashi, E. Kawai, K. Mutsuzaki and M. Miyagawa: J. Japan Inst. Metals 42 (1978) 101–106. 25) T. K. Ha, J. R. Son, W. B. Lee, C. G. Park and Y. W. Chang: Mater. Sci. Eng. A307 (2001) 98–106. 26) K. Makii, Y. Seki, A. Kushibe and K. Higashi: The Fourth Pacific Rim International Conference on Advanced Materials and Processing (PRICM4) (The Japan Institute of Metals, 2001) pp. 1977–1978. 27) A. Ball and M. M. Hatchison: Metal Sci. J. 3 (1969) 1–7. 28) S. Tandon and G. S. Murty: Mater. Trans., JIM 34 (1993) 319–324. 29) M. L. Vaidya, K. L. Murty and J. E. Dorn: Acta Metall. 21 (1973) 1615– 1623. 30) A. K. Mukherjee: Mater. Sci. Eng. 8 (1971) 83–89. 31) F. A. Mohamed, S.-A. Shei and T. G. Langdon: Acta Metall. 23 (1975) 1443–1450. 32) F. A. Mohamed, M. M. I. Ahmed and T. G. Langdon: Metall. Trans. A 8A (1977) 933–938. 33) D. L. Holt: Trans. Metall. Soc. AIME 242 (1968) 25–31. 34) J. Weertman: J. Appl. Phys. 26 (1955) 1213–1217. 35) T. G. Langdon: Met. Sci. 16 (1982) 175–183..
(7)
Figure

![Fig. 7Surface appearance of the specimens fractured at (a) 303 K and 10−4 s−1 [m = 0.2] (b) 303 K and 10−5 s−1 [m = 0.3] (c) 473 Kand 2 × 10⁻² s−1 [m = 0.5]](https://thumb-us.123doks.com/thumbv2/123dok_us/374113.534782/4.595.48.541.53.173/fig-surface-appearance-specimens-fractured-k-k-kand.webp)
Related documents
Figure 6 presents the results of the tensile test conducted at different temperatures from room temperature up to 723 K. The tensile strength and elongation at room temperature
Applied stress-strain curve of W-80 vol%Cu composite is shown in Fig. The arrow in the figure indicates a point at which deformation was suspended. It is already reported that
Discussion Table 7 shows optimal temperature of superplastic deformation, Tsp , for the both alloys with initial grain size after TMP, di , and strain rate, ε˙ , at which highest
Physics-based Constitutive Model for the Hot Deformation of 2Cr11Mo1VNbN Martensitic Stainless Steel
The hot deformation behaviors of metals are complex and nonlinear relationships of flow stress, strain, strain rate and temperature, due to the complex deformation
With an increase in deformation temperature, the linear part of the curve which corresponds to the maximum strain rate sensitivity (m) and superplastic behaviour, shifted towards
(3) Dynamic recrystallization behaviour of experimental steel is sensitive to deformation temperature and strain rate, and increasing deformation temperature or decreasing strain
1) All of the flow curves exhibit an initial peak at the beginning of deforma- tion process. Then, the flow stress decreases sharply to a near steady state, which all curves
The power dissipation maps were developed using Dynamic Material Model (DMM) and flow stress data obtained from hot compression test at different temperatures and
