JOURNAL OF FOREST SCIENCE, 58, 2012 (6): 245–252
Basic tools for mathematical modelling of the sig-moid growth of tree characteristics are relatively simple non-linear equations, generally referred to as growth functions (Van Laar, Akça 2007; Pretzsch 2009). The growth functions imitate the real growth of trees and forest stands, smooth cyclic fluctuations and filter random noise accompanying empirical growth measurements (Zeide 1993). In this way, they provide better knowledge of causes and mechanisms of growth and allow predicting the values and increments of modelled variables. They also facilitate the quantification of assumed growth responses or estimation of the maturity degree of an organism (Fitzburgh 1976; Vanclay 1994).
An excellent overview of growth functions, their historical background, assumptions and the way of their derivation and mathematical-statistical prop-erties can be found in the papers of Tsoularis and Wallace (2002); Seber and Wild (2003) or Karkach (2006).
One of the principal problems of most of the clas-sical growth functions is their asymptotic behav-iour, at which the final value of ymax will be reached only if t → ∞. Thus, a biologically unrealistic as-sumption that the growth of each living organism runs for an infinitely long period is a priori incor-porated in the mathematical construction of clas-sical growth functions. However, the growth of a living organism is always determinate – in the pe-riod of physiological death, the increment of any dimensional variable always equals zero (Xiao 2005). Mathematical solution of the above problem was described by Yin et al. (2003), who proposed a growth function using the frequency function of Beta distribution.
Growth functions are used as semi-empirical growth models. Estimations of their parameters are carried out by means of different methods theoreti-cally elaborated mainly for non-linear regressions. Currently, there is a wide range of methods of
clas-Modelling of tree diameter growth using growth functions
parameterised by least squares and Bayesian methods
R. Sedmák, L. Scheer
Department of Forest Management and Geodesy, Faculty of Forestry, Technical University in Zvolen, Zvolen, Slovak Republic
ABStRAct: The purpose of this paper is to present a new growth and yield function (denoted as KM-function), which was empirically derived from the cumulative density function of the Kumaraswamy probability distribution. KM-function is theoretically well disposed for the prediction of future growth; however, the function also has other theoretical features that make it useful also for retrospective estimation of the past growth frequently used in biological analyses of growth in the initial life stages. In order to demonstrate the practical applicability of the KM-function for growth reconstruction, an investigation of the accuracy of five-year retrospective projections of the real tree diameters obtained by stem analyses of 35 beech trees was done. Bias and accuracy of the new function were compared with bias and accuracy of some well-known growth functions on the same database. Compared functions were parameterised in two ways: by the method of nonlinear least squares and Bayesian methods. Empirical validation of the KM-function confirmed its good theoretical properties when it was used for retrospective estimation of the tree diameter growth. The valuable knowledge of this research is also a finding that the incorporation of a great deal of a priori known facts about the growth of trees and stands in natural conditions of Slovakia into Bayesian parameter estimation led to a decrease in the bias and magnitude of reconstruction errors.
sical frequentist statistics or of alternative Bayes-ian statistics (Seber, Wild 2003; Carlin, Louis 2000). Main methods of the parameter estimation of regression models of the frequentist school are the maximum likelihood estimation method (MLE) and the method of ordinary least squares (OLS). The OLS method is derived from the MLE on the basis of introducing the simplified assumptions of normality, variance homogeneity and uncorre-latedness of residual deviations of the regression model. When using the OLS method, parameter estimations of non-linear models are almost ex-clusively connected to numerical techniques of the solution of a set of non-linear equations. In these cases, the OLS method is named as the nonlinear least squares (NLS) estimation. Another alterna-tive method for estimation of the growth function parameters is the application of Bayesian statis-tics school methods. Basic difference between the Fisherian and the Bayesian statistics school is a different understanding of the probability concept (D’Agostini 2003). In Bayesian estimation, the a priori distribution of probabilities of possible pa-rameter values of the model with the a priori de-fined hyperparameters is combined with new ob-jective information included in the measured data of a particular experiment represented by a likeli-hood function.
The first aim of the present paper is to propose a new growth and yield function of determinate growth and to describe its key theoretical prop-erties. The incorporation of a special parameter into the functional form of the new function al-lows assuming more realistic growth projections for the future. But the function can be used also for a retrospective estimation (reconstruction) of the past growth, usually in the initial life stages of a living organism. Therefore, the extrapolation abil-ity of the new function for a reconstruction of the past growth is empirically validated. Because any simple growth and yield model is the inherently imperfect representation of complex growth pro-cesses, relative usefulness of the new function for a retrospective estimation of the past growth was evaluated by a comparison of the accuracy of five-year projections of real tree diameters using a new growth function with the accuracy of some classi-cal growth functions. Inductive evaluation of the diameter estimation accuracy was done on the ba-sis of the diameter growth empirical data obtained from stem analyses of beech trees. The second aim of the present paper is a general comparison of the function accuracy according to different methods of their parameterisation. The analysed growth
functions were parameterised by means of the NLS method and the Bayesian theorem using a normal likelihood function. Therefore, the present paper also provides new information about the suitabil-ity of different parameterisation methods of two contemporary statistics schools when applied for 5-year reconstructions of the tree diameter growth.
MAteRiAL And MethodS
Growth functions
A new growth function was derived empirically from the distribution function of Kumaraswamy distribution (Kumaraswamy 1980). The Kuma-raswamy distribution (KM-distribution) represents a unimodal distribution of probability values of the random variable X within the domain 0 ≤ X ≤ 1. In general, the KM-distribution function fits for the description of the relation of two variables with standardized domains of the values [0,1] and is able to describe the S-shaped curve. Derivation of the new growth function was based on substitution of the standardized variable X with the linear trans-formation of age t/tmax and the dependent variable p(X) with the linear transformation of the size of an organism y/ymax:
y/ymax = 1 – [1 – (t/tmax)b]c (1)
The variables tmax and ymax can be interpreted as the maximum age and size of an organism reached at the end of growth period, usually at the begin-ning of the reproduction phase or at the time of physiological death. The proportion of the final (mature) size t y/ymax attained at age is the degree of the physiological maturity for y and is presum-ably correlated with other statistical or physiologi-cal measures of maturity (Fitzburgh 1976); the ratio t/tmax can be termed in accordance with Xiao (2005) as the physiological age. By modification of equation (1), a four-parameter form of the new growth function, further described as KM-func-tion, can be obtained:
y = ymax[1 – (1 – (t/tmax)b)c] (2)
where:
0 ≤ t ≤ tmax, tmax > 0, ymax > 0, b > 0, c > 0.
at growth termination at the final age tmax. The dif-ferential form of the new growth function, known also as the growth rate equation, is obtained by the derivation of equation (2):
dy/dt = ymaxbct–
m 1a x (t/tmax)b–1[1 – (t/tmax)b]c–1 (3)
From equation (2) and (3) it can be shown that KM-function has the following key properties: (i) the integral form (2) allows the start of the
growth period at the age t(0) = 0 and at the same time it allows y(0) = 0, the differential form (3) at the age t(0) = 0 predicts dy/dt = 0, while the relative growth rate (RGR) (dy/dt) (1/y) at the same age is not defined,
(ii) the inflexion of the growth curve can occur at any age t and value y, the position of inflexion point is not constructionally prescribed, (iii) in the period of growth cessation at the time
t = tmax, the integral form (3) predicts y = ymax and simultaneously according to (3) at the age t = tmax, it holds true that dy/dt = 0 and conse-quently, RGR = 0.
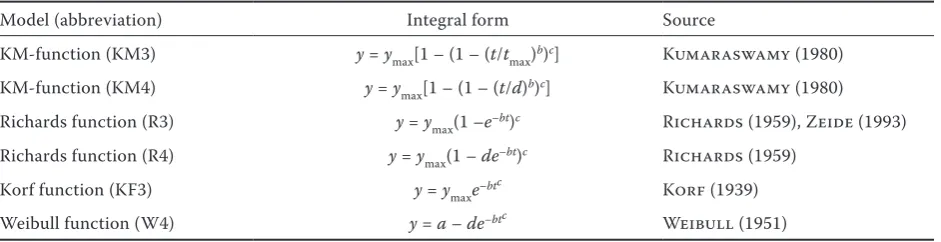
The new growth function was compared with a number of classical growth functions listed in Table 1. The Richards function (Richards 1959) is probably the most relevant example of growth functions of the exponential decline type accord-ing to the Zeide (1993) classification. This function represents one of the most frequently used growth models worldwide. One of its most important ap-plications can be found e.g. in the well-known Eu-ropean growth simulator SILVA 2.2 (Pretzsch et al. 2002). The Korf growth function (Korf 1939) belongs to the power decline type in terms of Zeide (1993) and is considered as the most impor-tant growth function in Slovakia. It was used for the construction of domestic yield tables (Halaj et al. 1987; Halaj, Petráš 1998) by means of which about 95% of the forest stand volume in Slovakia is estimated. It was also used in the new Slovak
growth simulator SIBYLA (Fabrika 2005). The Weibull growth function (Weibull 1951) was in-cluded in the list because according to the Zeide (1993) classification, it belongs neither to exponen-tial decline nor to power decline type, thus repre-senting an independent construction category of growth functions. Similarly like the new KM-func-tion, this function was derived exclusively empiri-cally. The new KM-function and the Richards func-tion were used in two different parameter forms with a different number of parameters. The three-parameter form of the KM-function was derived by fixing the parameter tmax to the valueof 500 years on the basis of estimation of the maximum physi-cal age of beech trees in the territory of Slovakia (Pagan 1992). A common feature of all classical growth functions included in the selection is that these are all mathematical models of non-determi-nate growth with an asymptotic character.
dataset
[image:3.595.64.535.635.756.2]The empirical material used in this research con-sisted of stem analyses of 35 beech trees cut down in a mature beech stand growing on a good site class. The tree age ranged from 80 to 160 years. The dia-meter d1.3 growth series measured at breast height to the nearest 1 mm in a time interval of five years were used for the analysis. Numerical description of the individual growth series obtained by the ex-ploratory graphical analysis of yield and increment curves is given in Table 2. Tree growth series were divided into two parts: parameterisation and valida-tion. The parameterisation measurement sequences were created by 18 measurements at the age ranging from 25 to 110 years covering all the development tree stages. The truncation of the total growth series length at the age of 110 years was set in connection with the start of the stand shelterwood regenera-tion, which reversed downward the tree increment trend characteristic of a given stand development
Table 1. Growth function models used in this study
Model (abbreviation) Integral form Source
KM-function (KM3) y = ymax[1 – (1 – (t/tmax)b)c] Kumaraswamy (1980) KM-function (KM4) y = ymax[1 – (1 – (t/d)b)c] Kumaraswamy (1980) Richards function (R3) y = ymax(1 –e–bt)c Richards (1959), Zeide (1993) Richards function (R4) y = ymax(1 – de–bt)c Richards (1959)
Korf function (KF3) y = ymaxe–btc Korf (1939)
phase, and which the integral forms of growth func-tions are not able to capture. The validation part was created only by one measurement from the juvenile period at the age of 20 years. This measurement was omitted from the existing growth series and was left for a comparison of real diameter at this age with estimated diameter derived by backward extrapo-lation of the parameterisation sequences covering ages from 25 to 110 years. Benchmarking analyses of real and predicted values of variables represent a simple and frequently used way of the growth mod-el evaluation (Vanclay 1994; Pretzsch 2009). The analysis of deviations of real and projected diameter values in the validation part of empirical material enables to objectively estimate the ability of growth functions to extrapolate the course of the existing measurements in time. At growth model evaluation, it is probably the only possibility how to objectively find out whether the respective model is practical-ly applicable for a given purpose (Ek, Monserud 1979; Zhang 1997).
Parameterisation
Within the classical frequentist school, param-eterisation of each growth function for every single tree was done using the NLS method and the Sta-tistica 7.1 software package (StatSoft Inc. 2005). The quality of fitting the measured data of single trees was checked by graphical illustration of the course of fitted growth trajectories. In total, 210 parameterisations and backward predictions (re-constructions) for 6 selected growth functions for each of the 35 trees were performed. Subsequently, the sample of 35 relative errors of the diameter re-constructions at the age of 20 years was obtained for each selected function separately.
Bayesian parameterisation starts by the formu-lation of a priori probability distributions of pa-rameters of individual growth functions. The
mar-ginal a priori parameter distributions of growth functions express the assumed occurrence prob-ability of the values of all parameters for six se-lected growth functions when applied for diam-eter growth modelling of beech trees growing at different social positions and varying site quality under natural conditions of Slovakia. The distri-butions were mathematically formalized (elicited) by a special mathematical-statistical procedure, whose detailed description exceeds the scope of this paper and which can be found in Sedmák (2009). In general, the elicitation uses a great deal of knowledge of beech stand growth in Slovakia contained in the 3rd edition of yield tables (Halaj, Petráš 1998) and in a detailed survey of the di-ameter structure of Slovak forest stands (Halaj 1957). In addition, all the knowledge of site quality and stand structure given in the study of Šmelko (1982) was considered. The elicited marginal a priori distributions of individual parameters had a form of either lognormal or Gamma distribution. Joint a priori distributions of multiple parameters were created as a simple product of marginal dis-tributions of individual parameters.
Bayes’ theorem was applied as a combination of the normal likelihood function with the a priori pa-rameter distributions estimated by elicitation. The growth function parameters were estimated using the Gibbs sampling method belonging to a group of numerical methods of integration of the multiple integrals designated as Markov Chain Monte Carlo (MCMC) methods in WinBugs 1.4 software pack-age (Lunn et al. 2000). Similarly to the NLS method, the total number of parameterisations, backward reconstructions and diameter reconstruction er-rors at the age of 20 years by means of the Bayesian method was 210 (6 functions × 35 trees).
error analysis
Evaluation of the growth function efficiency is based on the calculation of 35 relative errors at the age of 20 years for each used growth function in the validation sample
ei (%) = (yp – yR/yR) × 100
where:
yP – predicted value,
yR – real value of the projected variable y.
From the relative errors were calculated the arithmetic mean of individual errors e% as a
mea-Table 2. Statistics of individual tree growth series
St
ati
stic
s
Age of c
ur
ren
t
inc
remen
t
culmina
tion
Age of me
an
inc
remen
t
culmina
tion
Age of
re
genera
tion
st
ar
t
Tr
ee age a
t c
ut
dow
n
C
ut dow
n DBH
(c
m
)
in years
Minimum 25 30 75 80 16.1
x ± sx 69 ± 13 97 ± 19 117 ± 16 129 ± 16 36.6 ± 9.3
sure of bias and biological realism of the function and root mean square error (RMSE), which is a measure of the total error and practical applicabil-ity of the function for a backward estimation of tree characteristics.
ReSuLtS
Relative errors of 5-year reconstructions of tree diameter growth are presented in Tables 3 and 4. Table 3 shows the basic overview of biases and RMSE reconstructions according to the selected growth functions, their categories and parame-terisation methods. Table 4 documents the ratios of RMSE and biases of a particular combination of growth function and parameterisation method with respect to a minimum RMSE or bias of twelve possible combinations (six growth functions × two
parameterisation methods). Such relativisation fa-cilitates a mutual comparison of growth functions and parameterisation methods separately accord-ing to the aim of modellaccord-ing. In forestry and ecol-ogy, the standard aim of modelling is either mini-mization of bias assuring the biological realism of projections (Bias columns) or minimization of the total error magnitude guaranteeing the practical applicability of the model (RMSE columns). There can also be an integrated aim of modelling, when simultaneous minimization of the bias and the to-tal error magnitude is expected (Average columns).
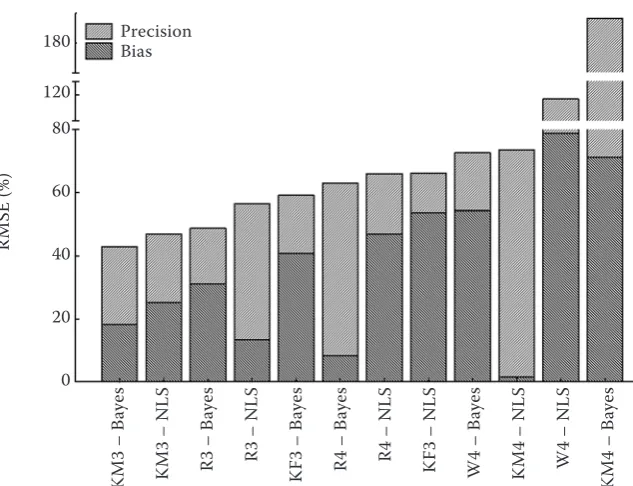
[image:5.595.65.537.73.271.2]In general, the values of the relative RMSE re-constructions are high and they vary from 44 to 188% (Table 3). The magnitude of the RMSE does not even decrease along with the bias decrease (e.g. combination of KM4/NLS). The proportions of biases in RMSE are also considerable, i.e. in nine cases of the twelve investigated combinations of
Table 3. Relative error statistics of the diameter growth reconstruction
Growth function
Parameterisation method
NLS Bayesian Bayesian/NLS
RMSE
(%) Bias (%) Bias/RMSE RMSE (%) Bias (%) Bias/RMSE RMSE Bias
Korf (KF3) 66.2 –59.6 0.81 59.2 –49.2 0.69 0.90 0.83
Richards (R3) 56.5 –27.6 0.24 48.8 –38.9 0.64 0.86 1.41
KM-function (KM3) 46.9 –34.4 0.54 43.0 –28.0 0.42 0.92 0.81
Three-parameter functions 56.5 –40.5 0.53 50.3 –38.7 0.58 0.89 1.02
Weibull (W4) 118.3 96.6 0.67 72.7 –62.9 0.75 0.61 0.65
Richards (R4) 66.0 –55.7 0.71 62.9 22.8 0.13 0.95 0.41
KM-function (KM4) 73.5 11.1 0.02 188.1 115.8 0.38 2.56 10.44
[image:5.595.62.534.586.758.2]Four-parameter functions 85.9 17.3 0.47 107.9 25.2 0.42 1.38 3.83
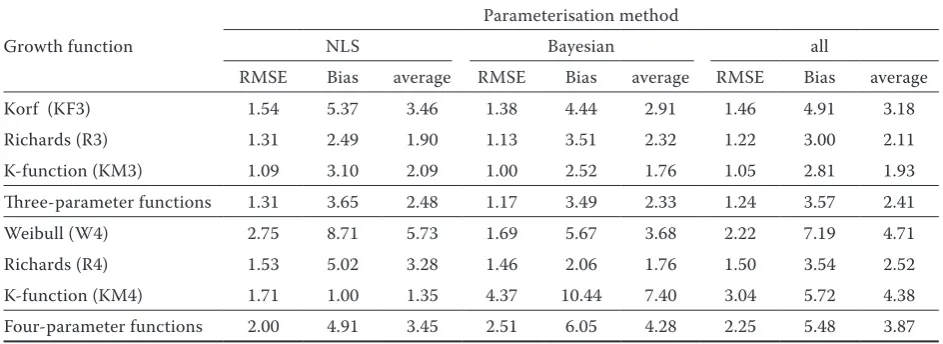
Table 4. The ratios of the reconstruction error statistics – combination of the growth function/parameterisation method vs. combination with minimal statistics
Growth function
Parameterisation method
NLS Bayesian all
RMSE Bias average RMSE Bias average RMSE Bias average
Korf (KF3) 1.54 5.37 3.46 1.38 4.44 2.91 1.46 4.91 3.18
Richards (R3) 1.31 2.49 1.90 1.13 3.51 2.32 1.22 3.00 2.11
K-function (KM3) 1.09 3.10 2.09 1.00 2.52 1.76 1.05 2.81 1.93
Three-parameter functions 1.31 3.65 2.48 1.17 3.49 2.33 1.24 3.57 2.41
Weibull (W4) 2.75 8.71 5.73 1.69 5.67 3.68 2.22 7.19 4.71
Richards (R4) 1.53 5.02 3.28 1.46 2.06 1.76 1.50 3.54 2.52
K-function (KM4) 1.71 1.00 1.35 4.37 10.44 7.40 3.04 5.72 4.38
growth function/parameterisation method, they varied from 42 to 95%, and only in three cases, they were lower than 25%. The biases are underestimat-ed in 2/3 of cases. This is obvious from the category of three-parameter functions, where all the func-tions show underestimation.
Regardless of the parameterisation method used, the category of three-parameter growth functions compared to four-parameter alternatives reaches better results from the viewpoint of all the mod-elling aims (Table 3). The three-parameter growth functions are characterized by lower RMSE be-ing simultaneously accompanied by smaller biases when using both parameterisation methods. On the other hand, the proportion of biases in RMSE in the category of three-parameter growth functions is higher than 50% compared to the category of four-parameter growth functions. Simultaneously, in the category of four-parameter growth functions the tendency to underestimation disappears.
A more detailed comparison of the efficiency of three-parameter growth functions according to particular parameterisation methods has shown that the Bayesian parameterisation is characterized on average by a 10% lower RMSE, or approximately 5% smaller biases, thus surpassing the NLS method even from the integrated point of view (Table 4). Giving priority to Bayesian parameterisation at growth reconstructions is also confirmed by a gen-eral comparison of the NLS vs. Bayesian efficiency regardless of the growth function used (Bayesian/ NLS column in Table 3). In five of the six growth functions, the RMSE of Bayesian
parameterisa-tion was lower by 15–30 %, (the excepparameterisa-tion is only the KM4 function), while in four cases, they were simultaneously accompanied by a 20–60% smal- ler bias.
The best growth function for a short-term five-year backward reconstruction of the diameter growth of individual trees irrespective of the pa-rameterisation method used is the new KM-3 func-tion (Table 4, Fig. 1). This funcfunc-tion, along with the application of Bayesian methods, is the most suc-cessful function ever, from the viewpoint of the RMSE, and in combination with the NLS, it reach-es the second lowreach-est RMSE (Fig. 1). Although it is not the most successful function owing to the bias (its four-parameter variant KM4/NLS is better), its deviation is not extreme in both parameterisation methods. Consequently, the KM-3 function, irre-spective of the parameterisation method used is an optimal selection from the aspect of the integrated aim of modelling. Another function, only slightly worse, is the R3 growth function with similar char-acteristics, as for the particular aims of modelling. This function is characterized by a comparable bias. It has, however, a by about 10% higher RMSE, and is therefore worse also from the aspect of the integrated aims of modelling.
diScuSSion And concLuSionS
The new KM-function is a model of the determi-nate asymmetric growth initiating at the null size of an organism and ending at reaching its final size.
KM3 – B
aye
s
KM3 – N
LS
R3 – B
aye
s
R3 – N
LS
K
F3 – B
aye
s
R4 – B
aye
s
R4 – N
LS
K
F3 – N
LS
W4 – B
aye
s
KM4 – N
LS
W4 – N
LS
KM4 – B
aye
s
Precision Bias 180
120 80
60
40
20
0
RM
[image:6.595.66.383.59.302.2]SE (%)
Since the KM-function reaches its starting and final sizes exactly, not only approaching them as-ymptotically, the equation assumes the final length of the growth period. It acts in the equation as an independent parameter and on the basis of its clear biological interpretation; it can be empirically esti-mated by means of maximum physical ages of the tree species under given natural conditions. At the beginning and at the end of the bounded growth period, the KM-function predicts the zero growth rate, whereas the period of growth rate culmina-tion can occur at any time t∈
[
0,tmax]
and value y.This is what makes this function theoretically well-disposed for increased flexibility and opens a pos-sibility of its application for the solution of a wider range of problems.
A possible application of the new function is its use for a retrospective estimation of growth vari-ables in the initial life stages of tree or stand. The obtained empirical results have confirmed the good theoretical efficiency of the new KM-function when it is used for short-term five-year reconstructions of tree diameter growth. In its three-parameter ver-sion (KM3) it is the best function of a set of com-pared functions on a particular dataset irrespective of the modelling aim. On a particular database it is characterized by the lowest RMSE, more acceptable bias than the other compared functions and stable results in both parameterisation methods.
In general, the new function performs better us-ing Bayesian parameterisation. Such a fact indirectly demonstrates a greater level of biological realism in-corporated in a new functional form. It is possible to hypothesize that the better biological interpretabil-ity of some parameters of the new growth function has been manifested on a more correct elicitation of the a priori probability distributions of possible pa-rameter values, thus contributing to a greater preci-sion of growth retrospective extrapolations.
Comparative analysis of growth functions and parameterisation methods on a particular dataset has also brought other relevant findings. Inductive study has shown that the application of simpler three-parameter growth functions in combination with the Bayesian parameterisation methods can be recommended for short-term reconstructions of the diameter growth of individual trees. The recom-mendation to use simpler functions for the growth extrapolation was expected. For example Šmelko et al. (1992) pointed out that a simpler equation with a smaller number of parameters had better extrapola-tion properties than more complicated forms which, on the other hand, fitted better to the measured values. The recommendation to apply the Bayesian
methods was also expected, mainly from the aspect of the total error magnitude. An expected character-istic feature of the Bayesian parameterisation com-pared to the classical frequency school is a lower error magnitude in combination with a higher bias (Carlin, Louis 2000; Bock, Du Toit 2003).
It is surprising, however, that the Bayesian param-eterisation is evidently more suitable even from the aspect of bias for short-term reconstructions. Incor-poration of the a priori information about possible values of the growth function parameters in their es-timation leads to more realistic estimates of tree di-ameter in early life stages in spite of the fact that the a priori distributions using the Bayes estimates open a possibility of introducing a bias in final estimates.
Overall, the theoretical analysis of properties of the new growth K-function and its comparison with functional forms of some classical growth functions have shown that the K-function can be considered as a mathematical model of the deter-minate asymmetrical growth of living organisms in which, unlike other known growth functions, a parameter with unique interpretation – expected life span of an organism – is included. Empirical verification of the theoretical properties of the KM-function for specific retrospective extrapola-tions of the tree diameter growth on a particular dataset has shown that the KM-function performed well (especially using the Bayesian parameterisa-tion) and it is at least comparable with currently used functions. However, the promising empirical results for a particular dataset and rather specific application purpose must be further validated on larger empirical material and for a higher number of possible function uses, from which the long-term extrapolation of growth in the future is pro-bably most valuable.
Acknowledgements
This study was supported and is part of the tasks involved in the Centre of Excellence for decision support in forest and landscape at the Technical University in Zvolen, Activity 3.1 Experimental and methodical platform of precision forestry tools and within the project of Scientific Grant Agency of the Ministry of Education, Science, Research and Sport of the Slovak Republic No. 1/0534/09 Inventory, Forest Monitoring and Prediction of its Development.
References
Bock R.D., Du Toit S.H.C. (2003): Parameter estimation in the context of nonlinear longitudinal growth models. In: Hauspie R.C., Cameron N., Molinari L. (eds): Methods in Human Growth Research. Cambridge Studies in Biologi-cal and Evolutionary Anthropology No. 39. Cambridge, Cambridge University Press: 198–220.
Carlin B.P., Louis T.A. (2000): Bayes and Empirical Bayes Methods for Data Analysis. Texts in Statistical Science. Chapman & Hall/CRC, Boca Raton-London-New York-Washington, DC: 419.
D’Agostini G. (2003): Bayesian inference in processing ex-perimental data principles and basic applications. Reports on Progress in Physics, 66: 1–40.
Ek A.R., Monserud R.A. (1979): Performance and com-parison of stand growth models based on individual tree diameter. Canadian Journal of Forest Research, 9: 231–244. Fabrika M. (2005): Rastový simulátor SIBYLA (koncepcia,
konštrukcia, softvérové riešenie). [Growth simulator SIBY-LA (conception, construction, software solution)]. [Habilita-tion Thesis.] Zvolen, Technical University in Zvolen: 187. Fitzburgh H.A. (1976): Analysis of growth curves and
strategies for altering their shape. Journal of Animal Sci-ence, 42: 1036–1051.
Halaj J. (1957): Matematicko-štatistický prieskum hrúbkovej štruktúry slovenských porastov. [Mathematical and sta-tistical research of diameter structures of Slovak stands.] Lesnícky časopis, 3: 39–74.
Halaj J., Grék J., Pánek F., Petráš R., Řehák J. (1987): Rastové tabuľky hlavných drevín ČSSR. [Growth and Yield Tables of Main Tree Species in Czechoslovakia.] Bratislava, Príroda: 362.
Halaj J., Petráš R. (1998): Rastové tabuľky hlavných drevín pre priemerné prírodné pomery Slovenska. [Growth and Yield Tables of Main Tree Species in Slovakia.] Bratislava, Slovak Academic Press: 325.
Karkach A.S. (2006). Trajectories and models of individual growth. Demographic Research, 15: 347–400.
Korf V. (1939): Příspevěk k matematické formulaci vzrůstového zákona lesních porostů. [Contribution to mathematical definition of the law of stand volume growth.] Lesnická práce, 18: 339–379.
Kumaraswamy P. (1980): A generalized probability density function for double-bounded random processes. Journal of Hydrology, 46: 79–88.
Lunn D.J., Thomas A., Best N., Spiegelhalter D. (2000): WinBUGS – a Bayesian modelling framework: concepts,
structure, and extensibility. Statistics and Computing, 10: 325–337.
Pagan J. (1992): Forestry Dendrology. Zvolen, Technical University in Zvolen: 347.
Pretzsch H., Biber P., Ďurský J. (2002): The single tree-based stand simulator SILVA: construction, application and evaluation. Forest Ecology and Management, 162: 3–21. Pretzsch H. (2009): Forest Dynamics, Growth and Yield.
Springer-Verlag, Berlin Heidelberg: 664.
Richards F.J. (1959): A flexible growth function for empirical use. Journal of Experimental Botany, 10: 290–300. Seber G.A.F., Wild C.J. (2003): Nonlinear Regression. Wiley
Series in Probability and Statistics. New Jersey, John Wiley and Sons, Inc.: 768.
Sedmák R. (2009): Modelovanie rastu bukových stromov a porastov. [Growth and Yield Modelling of Beech Trees and Stands.] [Ph.D. Thesis.] Zvolen, Technical University in Zvolen: 181.
StatSoft, Inc. (2005). Electronic Statistics Textbook. Tulsa. Available at http://www.statsoft.com/textbook/
Šmelko Š. (1982): Biometrické zákonitosti rastu a prírastku le-sných stromov a porastov. [Biometrical Laws of Growth and Yield of Forest Trees and Stands.] Bratislava, VEDA: 183. Šmelko Š., Wenk G., Antanaitis V. (1992): Rast, štruktúra
a produkcia lesa. [Forest Growth, Structure and Yield.] Bratislava, Príroda: 342.
Tsoularis A., Wallace J. (2002): Analysis of logistic growth models. Mathematical Biosciences, 179: 21–25.
Van Laar A., Akça A. (2007): Forest Mensuration. 2nd Ed.
Dordrecht, Springer: 383.
Vanclay J.K. (1994): Modelling Forest Growth and Yield. (Application to mixed tropical forests). Wallingford, CAB International: 312.
Weibull W. (1951): A statistical distribution of wide ap-plicability. Journal of Applied Mechanics, 18: 293–297. Yin X., Goudriaan J., Lantinga E.A., Vos J., Spiertz H.J.
(2003): A flexible sigmoid function of determinate growth. Annals of Botany, 91: 361–371.
Xiao Y. (2005): An equation of biological windows and its application. Ecological Modelling, 181: 521–533.
Zeide B. (1993): Analysis of growth equations. Forest Sci-ence, 39: 594–616.
Zhang L. (1997): Cross-validation of non-linear growth functions for modelling tree height-diameter relationships. Annals of Botany, 79: 251–257.
Received for publication August 15, 2011 Accepted after corrections February 21, 2012
Corresponding author:
Prof. Dr. Ľubomír Scheer, Technical University in Zvolen, Faculty of Forestry, Department of Forest Management and Geodesy, T.G.Masaryka 24, 960 53 Zvolen, Slovak Republic