China is the most important rice producing country with about 30% of the total world rice production. Paddy rice soils are well known to be a significant source of anthropogenic CH4 and N2O, two important trace gases contributing to the global temperature increase by about 0.6°C during the 20th century (IPCC 2001). The intensification of rice cultivation to meet food demands of the rising population could further enhance such temperature increase from the increases of CH4 and N2O emissions. Therefore, it is urgent to establish technologies and practices for reducing CH4 and N2O emissions from paddy fields while sustaining or increasing rice production.
It is well documented that CH4 and N2O are released from paddy fields in numerous soil types in China (Kreye et al. 2007, Lou et al. 2007, Ma et al. 2008, 2009), but only in a few in the purplish soil region (Jiang et al. 2006). The purplish paddy soil is account for about 25.1% of the cultivated
lands to produce rice, one of the most impor-tant agroecosystems for more than 100 million people in Southwest China (Sun 2005). At pres-ent, amending soils with local straw residues has been gaining worldwide support as a practical method to improve soil fertility, but simultaneously stimulating CH4 emission from the paddy fields, while reducing N2O emissions in rice soils (Ma et al. 2008, 2009). The possible effects of straw in decreasing N2O emission were proposed by Khalil et al. (2007). On the other hand, Lou et al. (2007) reported that accumulative N2O emissions were increased in paddy soils that were amended with wheat or rice straw in pot incubation experi-ments. Straw mulching cultivation on paddy rice is currently receiving more and more attention in China. However, very few studies have compared trace gas emissions with different rates of straw addition in paddy rice fields, particularly with
Effects of wheat straw application on methane and nitrous
oxide emissions from purplish paddy fields
Y. Wang
1, C. Hu
1, B. Zhu
2, H. Xiang
2, X. He
31
Center for Agricultural Resources Research, Institute of Genetics and Developmental
Biology, Chinese Academy of Sciences, Shijiazhuang, P.R. China
2
Institute of Mountain Hazards and Environments, Chinese Academy of Sciences,
Chendu, P.R. China
3
School of Plant Biology, University of Western Australia, Crawley, Australia
ABSTRACT
Little information has been known on greenhouse gas emissions from the unique purplish farmland that produces rice for more than 100 million people in Southwest China. We studied methane (CH4) and nitrous oxide (N2O) emissions under four wheat straw application rates (0, S0; 5.310, S1; 10.620, S2 and 21.240 kg/ha, S3) to a purplish paddy field (Regosols in FAO taxonomy) with the static chamber technique. The seasonal accumulative CH4 (TCH4) or N2O emis-sions from S0, S1, S2 and S3 were 255, 417, 571 and 687 kg/ha or 3.22, 2.66, 2.35 and 2.16 kg/ha during period from June 1 to September 14, 2005, respectively. Seasonal accumulative CH4 emission was significantly correlated with straw application (Xstraw) (TCH4 = 290.72 + 0.02 Xstraw , r2 = 0.93, P < 0.05). Significantly positive linear correlation was
displayed between CH4 flux rate and soil temperature at 5 cm depth (Tsoil) (P < 0.05, 18.0°C ≤ Tsoil ≤ 26.4°C). Straw ap-plication less than 5.300 kg/ha could enhance plant carbon fixation amounts, whilst both CH4, N2O emissions and the ratio of carbon equivalent emission to carbon fixation were not increased in the purplish paddy soil.
Keywords: methane; nitrous oxide; emissions; application of straw; paddy field; purplish soil
wheat straws that are from the rice-wheat crop-ping rotation system (Ma et al. 2008).
As a result, the objectives of this study reported here were to sustain an increase in paddy rice pro-duction and a decrease in both CH4 and N2O emis-sions with different rates of straw addition in the unique purplish soil region of southwest China.
MATERIALS AND METHODS
Location and soil characteristics. The field site (31°16'N, 105°27'E), located in the Yanting County, Sichuan Province, Southwest China, belongs to the Yanting Station for Agri-Ecology Observation, Chinese Academy of Sciences. It has a subtropical monsoon climate with annual mean precipitation of 826 mm and temperature of 17.3°C over the past 30 years. The purplish paddy soil is classified as Regosol in the FAO taxonomy. Some chemical characteristics of the soil surface (0–20 cm) were: the total nitrogen (TN), the total organic matter (TOC), the available nitrogen (N), phosphorus (P2O5) and potassium (K2O) and they were 0.14% and 2.07%, 119.60, 10.42 and 74.72 mg/kg, respectively. The determination methods according toLiu (1996) were used.
Field experiments. The field experiment (four treatments, three replicates each) was conducted in 12 plots (5 × 6 m each) with a randomised com-plete block design. Four wheat straw treatments were applied as S0 (zero), S1 (5310 kg/ha), S2 (10620 kg/ha) and S3 (21240 kg/ha), based on the conventional N fertilization (150 kg N/ha). The whole wheat straw was applied to the paddy soil before rice transplanting. Seeds of rice (Oryza sativa cv. Chuanxiangyou 2) were sown in a nursery on May 1, 2005, and after one month rice seedlings were transplanted into the puddle waterlogged plots, where 5–10 cm water layer was maintained until September 14. The row space was 17 cm and the plant space was 26 cm. All plots received 90 kg N (urea), 45 kg P2O5, 45 kg K2O/ha as basal fertilizer during soil puddling, while 60 kg N (urea) were top-dressed at the booting stage on July 20. Rice biomass and yield were measured at harvest.
Gas sampling and measurement. The fluxes of CH4 and N2O were determined using the techniques of static opaque chamber and gas chromatography from June 1 to September 14, 2005. For each replicate of the treatment, one mini-plot of 0.5 × 0.5 m was used for the measurements of CH4 and N2O emissions. A stainless steel base (0.5 m length × 0.5 m width × 0.2 m height) with a water groove on the top was installed at each mini-plot. The portable sampling
chamber (0.5 m length × 0.5 m width × 1 m height) covered six hills of rice in the paddy field, and the plant density inside the chamber (hill spacing was 0.25 m × 0.17 m, with three seedlings per hill) was the same as that outside the chamber. All chambers were equipped with fans and thermometers. There were heat preservative foams on the surface of por-table sampling chambers to minimize temperature variation inside the chambers. Removable wooden boardwalks (2 m long) were set up at the beginning of the rice season to avoid soil disturbances during sampling and measurements.
Gas samples were collected twice a week between 9:00 a.m. and 11:00 a.m. within an 18-min-period. Duplicate gas sample was taken from each treat-ment at 0, 6, 12 and 18 min with a 100 ml syringe, respectively. The ambient air pressure, air temper-ature, water depth in the field and 5 cm subsoil temperature were concurrently measured. Daily temperature and rainfall were also recorded during the entire rice growth to probe into the seasonal variations of greenhouse gas emissions. The gas samples were analyzed by gas chromatography (GC, HP-5890II, The Hewlett-Packard Company, Palo Alto, California, USA) with separate electron capture and flame ionization detectors (ECD at 330°C and FID at 200°C) for N2O and CH4 measurement, respectively. The detection limits of ECD-GC and FID-GC were 0.08 pg C/s and 5 pg C/s, respectively.
Calculations of gas emissions and carbon (C) fixations. Gas emission flux was calculated as:
F = T0/(T0 + ) × ρ × h × (∆c/∆t) (1) Where: F is CH4 flux (mg CH4/m2/h) or N
2O flux (µg N2O/m2/h),
T0 is the absolute temperature of 273.15 K at standard state (0°C and 1013 hPa), T is the air temperature inside the chamber (°C); ρ represents the gas density at standard state (kg/m3) (0°C and 1013 hPa), h is the headspace height
of the chamber (m); c is the gas mixing ratio concentra-tion (ppm), t is the time for chamber closure (h), ∆c is the volume mixing ratio of gas increased (or decreased) in the chamber during ∆t.
The seasonal accumulative emissions were ob-tained by multiplying the average daily flux from two consecutive measurements within a week by the number of days between the measurements, and then summing the fluxes of these periods to an accumulative flux for the whole season:
n
Y = Σ Xi × 24, n = 1, 2, 3...106 (2) Where: Y (kg/ha), Xi (kg/ha/h) and i are the accumulative CH4 (or N2O) emission, the average daily CH4 (or N2O) emission rate and the number of days during the field growth stage of rice, respectively.
The IPCC global warming potential coeffi-cients based on a 100-year time horizon (GWP100) 21 and 310 for CH4 and N2O, respectively, were used to convert emissions to CO2 equivalents (IPCC 2001). Root biomass was assumed to be ≈ 0.1 of the total above-ground biomass (TAGB), then the C fixation and emission quantities were calculated as follows (Huang et al. 1997):
NPP = 1.1 × TAGB (3) CNPP = 0.27 × NPP/(0.68 × 0.90) = 0.44 × NPP (4) Ceq.CO2 = 0.27 × Qeq.CO2 (5) Where: NPP is the net primary production (kg/ha), CNPP (kg/ha) is the total C amount of the NPP, Ceq.CO2 (kg/ha) is the total C content of the CO2 equivalent emission, Qeq.CO2 (kg/ha) is the seasonal accumulative CO2 equivalent emis-sion. The coefficient 0.44 was derived from three assumed factors: 0.27, the C content of CO2; 0.68, the conversion of CO2 to carbohydrate; and 0.90, the conversion of carbohy-drate to rice biomass (Photosynthesis equation).
Data analyses. All the data were subjected to statistical analysis (SPSS 13.0). Differences between treatments were analyzed using ANOVA, followed by LSD at the 0.05 probability level and two-tailed t-test. Regression analysis was used to identify relationships between CH4 or N2O fluxes and the climatic or the straw treatment variables.
RESULTS AND DISCUSSION
Seasonal CH4 emissions. CH4 fluxes of S0, S1, S2 and S3 ranged from 0.226 to 20.1, 0.262 to 29.1, 0.374 to 50.2 and 2.23 to 40.9 mg/m2/h over the whole growth of 106 days, respectively (Figure 1a). The average seasonal flux rate of CH4 was increased with increasing amounts of straw addi-tion. All treatments showed two periods of high CH4 emissions. The first large emissions were ob-served between June 8 and July 3 with the maximal 38.0 mg/m2/h in the S3 treatment. The CH
4 emis-sions in all four treatments of S0, S1, S2 and S3 were steadily increased to the maximal 17.4, 29.1, 50.2 and 40.9 mg/m2/h in the second period of high emission between 24 July and 14 August, respectively.
A significant increase of CH4 flux rate, particular-ly in the highest S3 treatment (21.240 kg straw/ha) was observed during tillering stage (from 8 June to 3 July) (Figure 1a). Our results were consistent with other studies that straw application stimu-lated CH4 emission in paddy fields (Ma et al. 2008, 2009). Such increase of CH4 emissions was most likely related to the straw decomposition in the paddy field, because plant residues were
gener-ally decomposed at a rapid rate within 20 days after incorporation (Millar et al. 2004). Straw decomposition in anaerobic flooded soils could result in accumulation of acetate, one of the most important substrates for methanogens in flooded soils (Rao and Mikkelsen 1977).
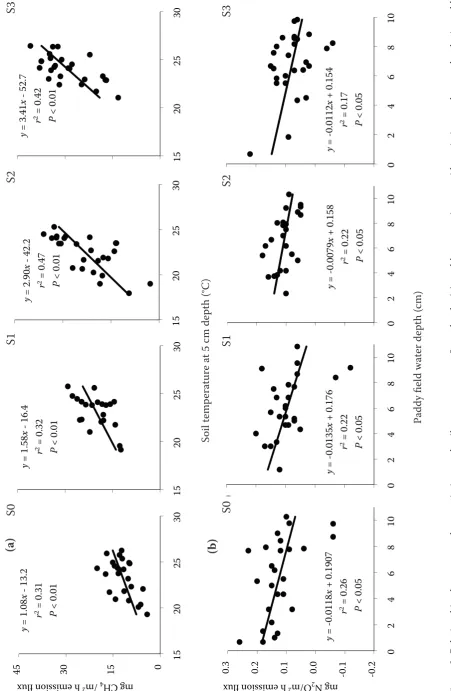
The second period of CH4 high emission rates from all treatments occurred between July 24 and August 14 (Figure 1a), when rice grew vigorously and more root exudates and plant sloughed tissues could then be produced after N fertilizer was top-dressed on July 20 (Figure 1a) with average air temperature of 27.4°C (Figure 1c). Carbon substrates of methano-genesis could come from root exudates and plant sloughed tissues (Kimura et al. 2004), and most of the methane emitted by rice soils was transported to the atmosphere through the aerenchyma sys-tem (Butterbach-Bahl et al. 1997). The continuous submergence of rice in paddy field resulted in high CH4 fluxes (Kreye et al. 2007), and the optimum temperature for methanogens ranged from 25 to 37°C (Schütz et al. 1990). Thus, all the subsequent releases of CH4 might have resulted from a combined high rainfall and optimum temperature. In addi-tion, Khalil et al. (1991) reported that the CH4 flux rate was increased with the temperature increase between 18 and 31°C in paddy fields. Our results showed that the CH4 emission was increased with the increase of the 5 cm soil temperature between 18.0 and 26.4°C (Figure 2a).
Seasonal N2O emissions. A similar temporal vari-ation in N2O flux was observed in different straw application amounts (Figure 1b). The N2O emissions of S0, S1, S2 and S3 showed no obvious fluctuations before July 20, but intense fluctuations after this date (Figure 1b). Respective N2O fluxes were as low as –0.0640, –0.118, –0.108 and –0.0630 mg/m2 h between July 24 and August 28 in the S0, S1, S2 and S3 treatments, and as high as 0.293, 0.256 and 0.210 mg/m2/h between August 21 and 24 in the S0, S1 and S2 treatments, respectively. No obvious N2O flux peak was observed in the S3 treatment, though just one day before the harvest there was a maximum flux of 0.219 mg N2O/m2/h on September 14.
ni-trification and denini-trification in paddy fields, resulting in lower N2O emissions. The minimum N2O emissions occurred on July 24 in the non-straw (S0) and the lowest non-straw (S1) treatments, on August 28 and July 31 in the higher straw (S2) and the highest straw (S3) treatments, respectively (Figure 1b). Besides the influence of straw, strong oxygen depletion might be responsible for low N2O fluxes during flooding in paddy fields (Kreye et al. 2007), the observed decreases in N2O were matched with the heavier precipitation (34.4 mm on July 24, 48.2 mm from July 28 to 31, and 29 mm on August 27 and 28) (Figure 1c). On the contrary,
the maximum N2O flux of S0, S1 and S2 occurred between August 21 and 24 and that of S3 emerged later on September 14, respectively (Figure 1c). These results were in accordance with the rainfall date (the precipitations were 0 mm and 0.2 mm from August 20 to 25 and from September 9 to 14, respectively) (Figure 1c).
[image:4.595.54.507.57.563.2]Furthermore, the increases of N2O emission rates were not obvious in the four treatments after nitrogen fertilizer was top-dressed on July 20 (Figure 1b). It might have resulted from the strong oxygen deple-tion during flooding in paddy fields. N2O emissions from a paddy field would mainly occur by diffusion Date
Figure 1. Seasonal patterns of methane (a) and nitrous oxide (b) emissions from the purplish paddy field, and seasonal variations of precipitation and air temperature (Tair) (c)
0 20 40 60 80
6/1 6/8 6/15 6/22 6/29 7/6 7/13 7/20 7/27 8/3 8/10 8/17 8/24 8/31 9/7 9/14
m
g
CH
4
/m
2·h
emission
flux
S0 S1
LSD(0.05)
Nitrogen top-dressed
a
-0.2 -0.1 0.0 0.1 0.2 0.3 0.4 0.5
6/1 6/8 6/15 6/22 6/29 7/6 7/13 7/20 7/27 8/3 8/10 8/17 8/24 8/31 9/7 9/14
m
g
N2
O
/m
2·h
emission
flux S0 S1
LSD (0.05)
Nitrogen top-dressed
b
0 5 10 15 20 25 30 35
0 10 20 30 40 50
6/1 6/8 6/15 6/22 6/29 7/6 7/13 7/20 7/27 8/3 8/10 8/17 8/24 8/31 9/7 9/14
Air temperature
(
°
C)
Precipitation
(mm)
precipitation(mm) Tair
c
(a)
through surface water, N2O is highly soluble in water through denitrification with N2 as a major end prod-uct (Kreye et al. 2007). The accumulative precipita-tion was 228.8 mm (51.6% of the total precipitaprecipita-tion during the observation period (106 days) from July 20 to August 19 (31 days) (Figure 1c). Meanwhile, the average field water depths during the field growth stage of rice of S0, S1, S2 and S3 treatments were 5.39, 6.12, 6.63 and 6.80 cm, respectively (Figure 2b). Our results showed that the accumulative N2O emission decreased with the increase of water depths.
Relationships between CH4 and soil tempera-ture or N2O emissions and field water depth. Significantly positive linear correlations were found between the CH4 flux rates and the soil tem-peratures at 5 cm depth (18.0°C ≤ Tsoil ≤ 26.4°C), whilst significantly negative linear correlations between the N2O flux rates and the water depths in paddy fields were found in all four treatments (0 cm ≤ Dwater ≤ 11.0 cm) (Figure 2). In contrast, CH4 fluxes were not related to water depth in paddy fields, whilst N2O fluxes were not related to soil temperatures at 5 cm depths.
Carbon fixation quantity, accumulative CH4 and N2O emissions, and C-equivalent emission quantity. Amounts of rice biomass, total C amount of the NPP (CNPP), seasonal accumulative CH4 (QCH4), N2O (QN2O) emissions, GWP100 of CH4 and N2O (Qeq.CO2), C-equivalent emission quantity (Ceq.CO2) and the ratio of C-equivalent emission to C fixation (Ceq.CO2/CNPP) were listed in the Table 1. Except for the QN2O, all above-mentioned parameters were increased with the increase of straw applica-tion and were significantly greatest in the highest application of the S3 treatment. In contrast, all pa-rameters (except the QN2O) of S0 were significantly lower than those of S2 and S3, and the QN2O of S0 was significantly higher than that of S2 and S3 (P < 0.05). Differences of all parameters between S1 and S2 were not significant; all parameters (except the rice biomass and the CNPP) showed no significant differences between S2 and S3.
The seasonal accumulative CH4 emissions in-creased with increasing wheat straw application in the paddy field (Table 1), which was also consistent with other reports (Ma et al. 2008, 2009). It was re-ported that application of straw could increase the bioavailable pool of organic C (Galantini and Rosell 2006), an energy source for methanogenic microbes to potentially enhance the CH4 production. In ad-dition, the seasonal accumulative N2O emissions decreased with increasing wheat straw application (Table 1). Our results were generally higher than data from Khalil et al. (1998) (2.07 kg N2O/ha) at the 125 kg N/ha application rate, but similar to Zheng et al. (2004) (2.36 kg N2O/ha) and Jiang et al. (2006) (2.5 to 3.2 kg N2O/ha) at the 150 kg N/ha application rate in paddy fields. The possible effect of straw in decreasing N2O emissions were proposed (Khalil and Inubushi 2007, Yan et al. 2007).
[image:6.595.63.535.656.733.2]In general, compared with no straw, the seasonal accumulative CH4 or N2O emissions increased by 63.3%, 123.3% and 168.8% or decreased by 17.4%, 27.0% and 32.9% in S1 (5.310 kg/ha), S2 (10.620 kg/ha) and S3 (21.240 kg/ha) straw application treatments, respectively. Significantly positive linear correlations were shown between seasonal accumulative CH4 emission (TCH4) and wheat straw addition (Xstraw) (TCH4 = 290.72 + 0.02Xstraw, r2 = 0.93, P < 0.05, 0 ≤ Xstraw ≤ 21.240 kg/ha) and between CH4 flux rate and soil temperature at 5 cm depth (P < 0.05, 17.95 ≤ Tsoil ≤ 26.43°C), whilst significantly negative linear correlation was displayed between N2O flux rate and field water depth (P < 0.05, 0 ≤ Dwater ≤ 11.0 cm). Amounts of rice biomass and C fixation were significantly increased in the straw treatments com-pared to the non-straw control (P < 0.05). At wheat straw ≥ 10.620 kg/ha, the seasonal accumulative CH4 emission, the C-equivalent emission and the ratio of C equivalent emission to C fixation were significantly increased, whilst the seasonal accumulative N2O emission was significantly decreased, compared to the non-straw application, respectively (P < 0.05). Our results also demonstrated that < 5300 kg/ha
Table 1. Effects of wheat straw applications on rice biomass, total C amount of the NPP (CNPP); cumulative CH4 (QCH4); N2O (QN2O) emissions (kg/ha); GWP100 of CH4 and N2O (Qeq.CO2); C-equivalent emission quantity (Ceq.
CO2) and the ratio of C-equivalent emission to C fixation (Ceq.CO2/CNPP) in a purplish paddy field
Wheat straw
addition Rice biomass CNPP QCH4 QN2O Qeq.CO2 Ceq.CO2 Ceq.CO2/CNPP
S0 15 104 (122)c 7 310 (59)c 255 (64)b 3.22 (0.11)a 6 362 (1352)b 1 718 (365)b 0.23 (0.05)b
S1 15 867 (179)b 7 678 (87)b 417 (123)ab 2.66 (0.18)ab 9 585 (2607)ab 2 588 (704)ab 0.34 (0.09)ab
S2 16 032 (225)b 7 760 (109)b 570 (98)a 2.35 (0.41)b 12 702 (2034)a 3 429 (549)a 0.44 (0.08)a
S3 16 911 (167)a 8 185 (81)a 687(26)a 2.16 (0.15)b 15 088 (549)a 4 074 (148)a 0.50 (0.02)a
wheat straw application could enhance rice biomass production, while not taking the risk of increasing CH4 and N2O emissions. Considering that there were no significant differences in rice biomass pro-duction and emissions of both CH4 and N2O were between 5310 (S1) and 10 620 (S2) kg/ha treatments (Table 1), more research is warranted on the methods and mechanisms of straw applications from 5300 to 11 000 kg/ha, on the increase of rice grain produc-tion and the reducproduc-tion of greenhouse gas emissions at the same time. Our results may have concurrently practical implications for the sustainable rice pro-duction and mitigation of greenhouse gas release from paddy fields.
REFERENCES
Butterbach-Bahl K., Papen H., Rennenberg H. (1997): Impact of gas transport through rice cultivars on methane emission from paddy fields. Plant, Cell and Environment, 20: 1175–1183.
Galantini J., Rosell R. (2006): Long-term fertilization effects on soil organic matter quality and dynamics under different production systems in semiarid Pampean soils. Soil and Tillage Research,
87: 72–79.
Huang Y., Sass R.L., Fisher F.M. (1997): Methane emission from Texas rice paddy soils. I. Quantitative multi-year dependence of CH4 emission on soil, cultivar and grain yield. Global Change Biology, 3: 479–489.
IPCC (2001): Climate Change 2001: the Scientific Basis. In: Houghton J.T., Ding Y., Griggs D.J. (eds): Cambridge University Press, UK. Jiang C.S., Wang Y.S., Zheng X.H., Zhu B., Huang Y., Hao Q.J. (2006):
Methane and nitrous oxide emissions from three paddy rice based cultivation systems in Southwest China. Advances in Atmospheric Sciences, 23: 415–424.
Khalil M.A.K., Rasmussen R.A., Wang M.X., Ren L. (1991): Methane emission from rice field in China. Environmental Science and Technology, 25: 979–981.
Khalil M.A.K., Rasmussen R.A., Shearer M.J., Chen Z.L., Yao H., Yang J. (1998): Emissions of methane, nitrous oxide, and other trace gases from rice fields in China. Journal of Geophysical Research,
103: 25241–25250.
Khalil M.I., Inubushi K. (2007): Possibilities to reduce rice straw-in-duced global warming potential of a sandy paddy soil by combining
hydrological manipulations and urea-N fertilizations. Soil Biology and Biochemistry, 39: 2675–2681.
Kimura M., Murase J., Lu Y. (2004): Carbon cycling in rice field eco-systems in the context of input, decomposition and translocation of organic materials and the fates of their end products (CO2 and CH4). Soil Biology and Biochemistry, 36: 1399–1416.
Kreye C., Dittert K., Zheng X.H., Zhang X., Lin S., Tao H.B., Sat-telmacher B. (2007): Fluxes of methane and nitrous oxide in water-saving rice production in north China. Nutrient Cycling in Agroecosystems, 77: 293–304.
Liu G.X. (eds) (1996): Soil Physical and Chemical Analysis and Description of Soil Profiles. Standards Press, Beijing, P.R. China. (In Chinese)
Lou Y.S., Ren L.X., Li Z.P., Zhang T.L., Kazuyuki I. (2007): Effect of rice residues on carbon dioxide and nitrous oxide emissions from a paddy soil of subtropical China. Water Air and Soil Pollution,
178: 157–168.
Ma J., Xu H., Yagi K., Cai Z.C. (2008): Methane emission from paddy soils as affected by wheat straw returning mode. Plant and Soil,
313: 167–174.
Ma J., Ma E.D., Xu H., Yagi K., Cai Z.C. (2009): Wheat straw manage-ment affects CH4 and N2O emissions from rice fields. Soil Biology and Biochemistry, 41: 1022–1028.
Millar N., Baggs E.M. (2004): Chemical composition, or quality, of agroforestry residues influences N2O emissions after their addition to soil. Soil Biology and Biochemistry, 36: 935–943.
Rao D.N., Mikkelsen D.S. (1977): Effect of rice straw addition on methane production and organic acids in a flooded soil. Plant and Soil, 47: 303–311.
Schütz H., Seiler W., Conrod R. (1990): Influence of soil temperature on methane emission from rice paddy fields. Biogeochemistry,
11: 77–95.
Sun H.L. (2005) China Ecosystems. In: Zhu B. (ed): Evolvement of agroecosystems in the hilly area of the central Sichuan basins. Science Press, Beijing, P.R. China, 1198–1230. (In Chinese) Yan D.Z., Wang D.J., Yang L.Z. (2007): Long-term effect of chemical
fertilizer, straw, and manure on labile organic matter fractions in a paddy soil. Biology and Fertility of Soils, 44: 93–101.
Zheng X.H., Han S.H., Huang Y., Wang Y.S., Wang M.X. (2004): Re-quantifying the emission factors based on field measurements and estimating the direct N2O emission from Chinese crop-lands. Global Biogeochemical Cycles, 18: GB2018. doi:10.1029/ 2003GB002167.
Received on July 4, 2009
Corresponding authors:
Prof. Chunsheng Hu, Center for Agricultural Resources Research, Institute of Genetics and Developmental Biology, Chinese Academy of Sciences, No. 286, 050021 Huaizhong Road, Shijiazhuang, Hebei Province , P.R. China
phone: + 86 311 858 143 60, fax: + 86 311 858 150 93, e-mail: [email protected]
Prof. Bo Zhu, Institute of Mountain Hazards and Environments, Chinese Academy of Science, No.9, 4th Section, 050021 Renminnan Road, Chengdu, Sichuan Province, P.R. China