© 2019, IRJET | Impact Factor value: 7.211 | ISO 9001:2008 Certified Journal | Page 4741
Modelling BOD and COD Using Artificial Neural Network
with Factor Analysis
Nidhisha C
1, Elizabeth C Kuruvila
21
Nidhisha C, M. tech Student, Civil Engineering, KMCT College of Engineering for women, Kerala, India
2Dr. Elizabeth C. Kuruvila, Professor, Civil Engineering, KMCT College of Engineering for women, Kerala, India
---***---Abstract -
The daily human activities nowadays leads to
increase in the chances of water quality deterioration which adversely affects sustaining life.Modelling of water quality is one of the most prominent area of study in the present scenario. The objective of the present study was to model Biochemical Oxygen Demand (BOD) and Chemical Oxygen Demand (COD) using Artificial Neural Networks (ANNs). Among twenty four parameters, twenty two parameters were taken as input values. Three different station of Korapuzha river in Kozhikode, Kerala have been taken as the study area. The three sampling points are Purakatteri, Kanyankode and Korapuzha. The data considered for the study was monthly of the duration 2006 to 2015. Since there were large number of input parameters, Factor Analysis was done in order to identify the most prominent input parameters for the BOD and COD modelling. The factors which were having a fine correlation with that of the output parameter were used for the development of ANN model. Different trials for the three sampling points were done with different input parameters depending upon the correlation value from the factor analysis result. The algorithm used in the ANN model is feed – forward back propagation.
The comparison of the models were done by observing the variation of predicted values from the observed values. The best result was obtained for the input parameter combination having high correlation with that of output parameter. The results obtained suggested that ANN technique provide better results when combined with factor analysis for data reduction.Key Words: Biochemical Oxygen Demand, Chemical
Oxygen Demand, factor analysis Artificial Neural Network
1.INTRODUCTION
Human activities give impacts on river water quality, whether by direct disposal or indirectly. The action of direct disposal polluted the river by illegal garbage dumping or chemical disposal from nearby factory. Meanwhile, we are unable to observe the people who polluted the river indirectly, or even to measure the value of pollutants dumped into the river. Direct discharge and disposals also contribute due to the process leaching after the heavy rain, usually when the farmers put excess fertilizers or pesticides
on the crops, and also the wastes from pasture sites. In natural environment, oxygen in the atmosphere will absorb into the surface area of the water but human activities such as open fire and industrial combustion, also contributes to the nutrient enrichment in water in the form of acid rain production. Among all the water quality parameters BOD and COD are prominent parameters. Biological Oxygen Demand (BOD) is the amount of oxygen used by aerobic microorganism to break down the organic matters into more stable form. Chemical Oxygen Demand (COD) is the amount of oxygen used to oxidize chemical substances through chemical processes.
[2].
In biological organisms, a computational method animated by the studies of the brain and nervous system, is called an Artificial Neural Network (ANN).One of best characteristics of the neural networks is their ability to learn. The process of learning for ANN called training the neural network. The training of ANN regulates itself to develop an internal set of features that it utilizes to classify information or data. [1]Factor analysis is a generic name given to a class of multivariate statistical methods which can be used for the purpose of data reduction and summarization. By using factor analysis, the analyst can identify the separate dimensions being measured by the survey and determine a factor loading for each variable on each factor. [3]1.1 OBJECTIVES
a. To perform factor analysis for understanding the correlation of each water quality parameter with BOD and COD.
b. To develop models for BOD and COD using Artificial Neural Network and compare the observed and predicted values.
2. METHODOLOGY
2.1 STUDY AREA
© 2019, IRJET | Impact Factor value: 7.211 | ISO 9001:2008 Certified Journal | Page 4742
Board. The monthly water quality data of Korapuzha riverwere collected from the state pollution control board. The water quality data of the three stations Purakatteri, Kanayankode and Korapuzha of the year 2006 to 2015 were collected.
2.2 FACTOR ANALYSIS
The Factor Analysis (FA) is a multivariate statistical technique mainly employed for the purpose of data reduction. The first step was to standardize the raw data. Standardization tends to increase the influence of variables whose variance is small and reduces the influence of variables whose variance is large. Furthermore, the standardization procedure eliminates the influence of different units of measurement and makes the data dimensionless.
The factor analysis is started by selecting the 24 parameters of the water quality. The monthly data of the year 2006 to 2015 of the Korapuzha river is used for the analysis. The first decision in the factor analysis includes the calculation of correlation matrix. The type of analysis used here is R factor analysis. Therefore, the correlation coefficient matrix measures how well the variance of each constituent can be explained by relationships with each of the others. Then, the variances/co-variances and correlation coefficients of the variables are computed. Eigen values and Eigenvectors were calculated for the covariance matrix. Then, the data were transformed into factors. Factor analysis attempts to explain the correlations between the observations in terms of the underlying factors which are not directly observable. Factors are extracted from the correlation matrix based on the correlation coefficients of the variables. In this factor analysis orthogonal extraction method is used. To maximize the relationship between some of the factors and variables, the factors are rotated. It is used to account for the degree of mutually shared variability between individual pairs of water quality variables. Then, Eigen values and factor loadings for the correlation matrix are determined. Eigenvalues correspond to an Eigen factor which identifies the groups of variables that are highly correlated among them. Lower eigen values may contribute little to the explanatory ability of the data. Only the first few factors are needed to account for much of the parameter variability. Once the correlation matrix and eigenvalues are obtained, factor scores are used to measure the correlation between the variables and factors. Factor rotation is used to facilitate interpretation by providing a simpler factor structure. After rotation of the factor loading matrix (e.g. by varimax rotation, which involves scaling the loadings by dividing them by the corresponding communality), the factors can often be interpreted as origins or common sources. [3]
2.3 ARTIFICIAL NEURAL NETWORKS
The artificial neural network models are developed using the neural network toolbox in MATLAB. In this study all the
water quality parameters except BOD and COD were taken as input parameters and the BOD and COD were taken as output parameters. Different trials with different input combination were done depending upon the values obtained after the factor analysis. For BOD of Purakatteri three trials were done. The trial 1 includes 10 inputs, trial 2 includes 4 input and third trial includes1 input. For COD of Purakatteri also three trials were done. The trial 1 includes 12 inputs, trial 2 includes 11 inputs and third includes 4 inputs. For BOD of Kanyankode one trial with 4 inputs was done and for the COD of Kanyankode three trials were done with the first trial having 10 inputs, second trial having 7 inputs and the trial having 5 inputs For the BOD of Korapuzha one trial was done with one input and for the COD three trials were done with first trial having 13 inputs, second trial having 9 inputs and the trial included 7 inputs. The type of algorithm used in the study is feed forward back propagation. The networks are trained using tangent sigmoid transfer function, back propagation and number of epochs as 1000. The number of neurons in the hidden layers are varied to obtain the best neural network. The best network is obtained depending upon the values of the performance parameters.
3. RESULTS AND DISCUSSIONS
3.1 FACTOR ANALYSIS
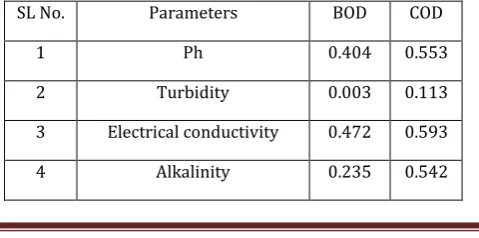
[image:2.595.317.557.663.782.2]The factor analysis was done using the Statistical Package for the Social Sciences (SPSS). It was done using the monthly water quality data of Korapuzha river for all the 24 parameters in order to find the correlation of these parameters with that of the BOD and COD. The water quality parameter are pH, turbidity, electrical conductivity, alkalinity, total hardness, calcium hardness, magnesium, chloride, sulphate, BOD, COD, nitrite, nitrate, Sodium absorption ratio, sodium, ammoniacal nitrogen, free ammonia, Total Kjeldhal Nitrogen, Total Dissolved Solids, Fluoride, boron, total coliform, fecal coliform, dissolved oxygen. The data values obtained from the pollution control board Kozhikode are first normalized before the factor analysis. The table below shows the correlation of each parameter with that that of the BOD and COD of the three sampling points which are Purkatteri, Kanyankode and Korapuzha.
Table -1: Factor Analysis result of Purakatteri
SL No. Parameters BOD COD
1 Ph 0.404 0.553
2 Turbidity 0.003 0.113
3 Electrical conductivity 0.472 0.593
© 2019, IRJET | Impact Factor value: 7.211 | ISO 9001:2008 Certified Journal | Page 4743
5 Total hardness 0.366 0.587
6 Calcium Hardness 0.158 0.356
7 Magnesium 0.345 0.568
8 Chloride 0.344 0.621
9 Sulphate 0.348 0.581
10 BOD 1 0.685
11 COD 0.685 1
12 Nitrite 0.051 0.028
13 Nitrate .202 0.339
14 Sodium Absorption ratio 0.336 0.616
15 Sodium 0.378 0.613
16 Ammoniacal Nitrogen 0.048 0.011
17 Free Ammonia 0.074 0.058
18 Total Kjeldhal Nitrogen 0.237 0.255
19 Total Dissolved Solids 0.338 0.585
20 Fluoride 0.181 0.409
21 Boron 0.044 0.003
22 Total Coliform 0.14 0.09
23 Fecal Coliform 0.156 0.104
[image:3.595.35.558.408.798.2]24 Dissolved Oxygen 0.46 0.041
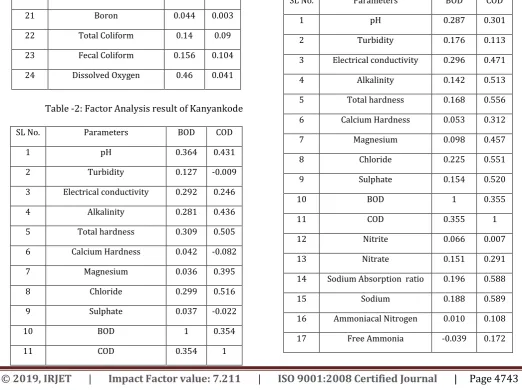
Table -2: Factor Analysis result of Kanyankode
SL No. Parameters BOD COD
1 pH 0.364 0.431
2 Turbidity 0.127 -0.009
3 Electrical conductivity 0.292 0.246
4 Alkalinity 0.281 0.436
5 Total hardness 0.309 0.505
6 Calcium Hardness 0.042 -0.082
7 Magnesium 0.036 0.395
8 Chloride 0.299 0.516
9 Sulphate 0.037 -0.022
10 BOD 1 0.354
11 COD 0.354 1
12 Nitrite 0.089 -0.073
13 Nitrate 0.295 0.382
14 Sodium Absorption ratio 0.317 0.569
15 Sodium 0.294 0.511
16 Ammoniacal Nitrogen 0.003 -0.022
17 Free Ammonia 0.080 0.095
18 Total Kjeldhal Nitrogen 0.195 0.120
19 Total Dissolved Solids 0.082 -0.071
20 Fluoride 0.110 0.212
21 Boron 0.173 0.522
22 Total Coliform 0.102 0.179
23 Fecal Coliform 0.044 0.140
24 Dissolved Oxygen -0.220 -0.279
Table -3: Factor Analysis result of Korapuzha
SL No. Parameters BOD COD
1 pH 0.287 0.301
2 Turbidity 0.176 0.113
3 Electrical conductivity 0.296 0.471
4 Alkalinity 0.142 0.513
5 Total hardness 0.168 0.556
6 Calcium Hardness 0.053 0.312
7 Magnesium 0.098 0.457
8 Chloride 0.225 0.551
9 Sulphate 0.154 0.520
10 BOD 1 0.355
11 COD 0.355 1
12 Nitrite 0.066 0.007
13 Nitrate 0.151 0.291
14 Sodium Absorption ratio 0.196 0.588
15 Sodium 0.188 0.589
16 Ammoniacal Nitrogen 0.010 0.108
© 2019, IRJET | Impact Factor value: 7.211 | ISO 9001:2008 Certified Journal | Page 4744
18 Total Kjeldhal Nitrogen 0.054 0.184
19 Total Dissolved Solids 0.185 0.568
20 Fluoride 0.033 0.337
21 Boron -0.051 0.01
22 Total Coliform 0.165 0.048
23 Fecal Coliform 0.144 0.074
24 Dissolved Oxygen -0.057 -0.292
3.2 ARTIFICIAL NEURAL NETWORKS MODEL
COMBINATION
The following are the results for different Artificial Neural Networks model combination for BOD and COD of the three sampling points- Purakatteri, Kanyankode and Korapuzha.
a. BOD of Purakatteri
ANN model was developed for three input combination. The first input combination included 10 inputs, the second input combination included 3 inputs and the third input combination includes one input namely COD.
Table -4: Values of performance parameters
ANN
Model
Combination
R MSE MAE RMSE SSE
10 inputs 0.767 0.129 0.222 0.359 1.473
3 inputs 0.905 0.215 0.315 0.464 1.985
1 input 0.914 0.003 0.046 0.057 1.392
The highest R value of 0.914 and lowest MSE value of 0.003 was obtained for the third input combination.
Chart -1: Graph showing comparison of original and predicted data of BOD of Purakatteri
The observed and ANN predicted values of BOD of Purakatteri were having much resemblance for the third input combination.
b. COD of Purakatteri
[image:4.595.304.559.54.249.2]ANN model was developed for three input combination. The first input combination included 12 inputs, the second input combination included 11 inputs and the third input combination includes 4 inputs.
Table -5: Values of performance parameters
The highest R value of 0.941 and lowest MSE value of 0.002 was obtained for the third input combination.
ANN
Model
Combination
R MSE MAE RMSE SSE
12 inputs 0.922 0.054 0.205 0.232 0.645
11 inputs 0.932 0.044 0.167 0.210 0.679
© 2019, IRJET | Impact Factor value: 7.211 | ISO 9001:2008 Certified Journal | Page 4745
Chart -2: Graph showing comparison of original andpredicted data of COD of Purakatteri
The observed and ANN predicted values of COD of Purakatteri were having much resemblance for the third input combination.
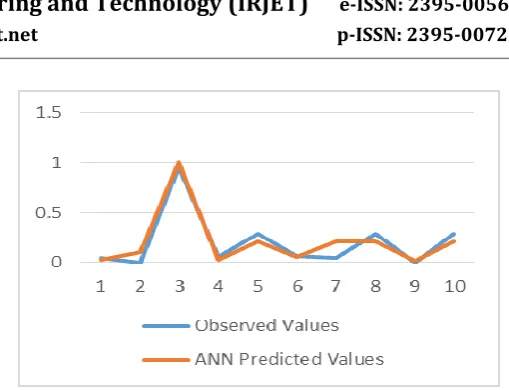
c. BOD of Kanyankode
[image:5.595.320.563.427.582.2]ANN model was developed for one input combination which included 4 inputs namely pH, total hardness, COD and SAR.
Table -6: Values of performance parameters
ANN
Model
Combination
R MSE MAE RMSE SSE
4 inputs 0.764 0.093 0.212 0.305 0.741
The highest R value of o.764 and lowest MSE value of 0.093 was obtained for this input combination.
Chart -3: Graph showing comparison of original and predicted data of BOD of Kanyankode
The observed and ANN predicted values of BOD of Kanyankode are as shown above. The resemblance of observed and predicted values is low due to low correlation.
d. COD of Kanyankode
[image:5.595.40.286.548.696.2]ANN model was developed for three input combination. The first input combination included 10 inputs, the second input combination included 7 inputs and the third input combination includes 5 inputs.
Table -7: Values of performance parameters
ANN Model
Combination
R MSE MAE RMSE SSE
10 inputs 0.711 0.031 0.139 0.175 0.216
7 inputs 0.737 0.075 0.241 0.274 0.579
5 inputs 0.775 0.003 0.032 0.178 0.394
The highest R value of 0.775 and lowest MSE value of 0.003 was obtained for the third input combination.
Chart -4: Graph showing comparison of original and predicted data of COD of Kanyankode
The observed and ANN predicted values of COD of Kanyankode were having much resemblance for the third input combination.
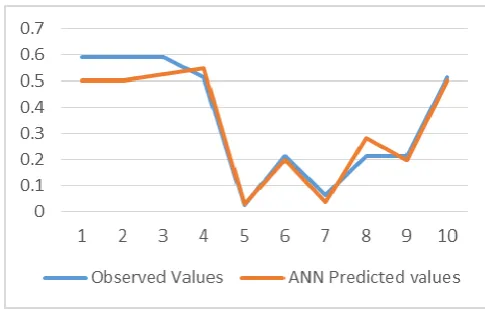
e. BOD of Korapuzha
© 2019, IRJET | Impact Factor value: 7.211 | ISO 9001:2008 Certified Journal | Page 4746
Table -8: Values of performance parametersANN
Model
Combination
R MSE MAE RMSE SSE
1 input 0.526 0.002 0.036 0.043 0.101
The highest R value of 0.526 and lowest MSE value of 0.002 was obtained for this input combination.
Chart -5: Graph showing comparison of original and predicted data of BOD of Korapuzha
The observed and ANN predicted values of BOD of Korapuzha are as shown above. There was a much resemblance between the observed and predicted value.
f. COD of Korapuzha
[image:6.595.37.290.258.403.2]ANN model was developed for three input combination. The first input combination included 13 inputs, the second input combination included 9 inputs and the third input combination includes 7 inputs.
Table -9: Values of performance parameters
ANN
Model
Combination
R MSE MAE RMSE SSE
13 inputs 0.739 0.056 0.167 0.238 0.242
9 inputs 0.764 0.132 0.227 0.363 0.704
7 inputs 0.830 0.004 0.045 0.067 0.443
The highest R value of 0.830 and lowest MSE value of 0.004 was obtained for the third input combination.
Chart -6: Graph showing comparison of original and predicted data of COD of Korapuzha
The observed and ANN predicted values of COD of Korapuzha were having much resemblance for the third input combination.
4. CONCLUSIONS
The objective of the present study was to model the Biochemical Oxygen Demand (BOD) and Chemical Oxygen Demand (COD) of Korapuzha river, Kozhikode at three different sampling locations using other twenty two parameters as input. Monthly data of water quality parameters for the duration of 2006 to 2015 was utilized for the study.
At first for the development of ANN model data reduction was done using the factor analysis. The factor analysis was done in order to identify the prominent parameters that are affecting the values of BOD and COD and the remaining parameters were exempted from the study. Different trials were done with different input combination depending upon the correlation value obtained from the factor analysis result. The algorithm used is feed forward back propagation. The result showed that neural network model prepared by BOD and COD high correlation coefficient (R) and low Mean Square Errors. Different graphs comparing the original and ANN predicted values were plotted. There was much resemblance for the predicted and original values in the ANN model. Slight variation of the result occurs due to the lack of data and it could be overcome by using data of more years. Thus it could be concluded that ANN is an efficient tool for modelling BOD and COD when combined with factor analysis for data reduction.
© 2019, IRJET | Impact Factor value: 7.211 | ISO 9001:2008 Certified Journal | Page 4747
REFERENCES
[1] Ammar Salman Dawood, Haleem K. Hussain, Aymanalak
Hassan (2016), Modelling of river water quality parameters using Artificial Neural Network- A Case Study, International Journal of Advances in Mechanical and Civil Engineering, Volume 03, Issue 05.
[2] Anitha Talib and Mawar Idati Amat, (2012), Prediction of
Chemical Oxygen Demand in Dongdang River Using Artificial Neural Network, International Journal of Information and Education Technology,Volume 02, Issue 03.
[3]J D Salas, J W. Delleur, V. Yevjevich and W. L. Lane, Applied
modeling of hydrologic time series, Water resources Publications
[4] Sujana Prajithkumar, Dr. Shweta Verma, B V Mahajan,
(2015), Application of ANN Model for the prediction of water quality index, International Journal of Engineering Research and General Science, Volume 03, Issue 01
[5] . Thair S.K. , Abdul Hameed M. J., and Ayad S. M., (2014),