A Simple Baseline for Discriminating Similar Languages
Matthew Purver
Cognitive Science Research Group
School of Electronic Engineering and Computer Science Queen Mary University of London
Abstract
This paper describes an approach to discriminating similar languages using word- and character-based features, submitted as the Queen Mary University of London entry to the Discriminating Similar Languages shared task. Our motivation was to investigate how well a simple, data-driven, linguistically naive method could perform, in order to provide a baseline by which more linguistically complex or knowledge-rich approaches can be judged. Using a standard supervised classifier with word and character n-grams as features, we achieved over 90% accuracy in the test; on fixing simple file handling and feature extraction bugs, this improved to over 95%, comparable to the best submitted systems. Similar accuracy is achieved using only word unigram features.
1 Introduction and Approach
Most approaches to written language detection use character or byte ngram features to capture charac-teristic orthographic sequences – see e.g. (Cavnar and Trenkle, 1994) to (Lui et al., 2014) and many in between, as well as implementations such as the widely used open-source Chromium Compact Lan-guage Detector.1 Some approaches determine these characteristic features from linguistic properties of the language (e.g. (Lins and Gonc¸alves, 2004)), while some determine them from data (e.g. (Cavnar and Trenkle, 1994)). A wide range of approaches to modelling and classification can be used, ranging from simple Na¨ıve Bayes models (Grefenstette, 1995) to more complex generative mixture models for tasks with multilingual texts (Lui et al., 2014). Our interest in this task was to see how well a naive, entirely data-driven baseline method would perform in the task of discriminating similar languages (DSL) as posed by the DSL Shared Task (Zampieri et al., 2014).
Our approach was intended to capture two basic insights into variation between similar languages. First, that closely related languages often use quite different words for the same concept: e.g. US English elevatorvs UK Englishlift; Croatiantjedanvs Serbiannedeljavs Bosniansedmica. Second, that there are often regular variations in the details of a word’s orthographic or phonological form: e.g. US English color,favorite vs UK Englishcolour,favourite; Croatian/Bosnian rijeka, htjetivs Serbianreka, hteti. The former insight can be approximated by use of word ngrams; the latter via character ngrams. While such ngram features cannot capture similarity of meaning or non-sequential dependencies, they may do a reasonable job of capturing similarity of sentential context (often taken to be an indicator of lexical meaning) and sequential phenomena.
Together with simplicity in method, speed and simplicity of implementation was also an objective. We therefore used only the training and development data available in the shared task — see (Tan et al., 2014) — together with a standard freely available discriminative SVM classifier and common text pre-processing methods.
This work is licensed under a Creative Commons Attribution 4.0 International Licence. Page numbers and proceedings footer are added by the organisers. Licence details:http://creativecommons.org/licenses/by/4.0/
1https://code.google.com/p/chromium-compact-language-detector/
2 Background and Related Work
Shared Task The Discriminating Similar Languages (DSL) Shared Task was established as part of the 2014 VarDial workshop.2 The task provided datasets for 13 different languages in 6 groups of closely related languages, shown in Table 1. Data was divided into training, development and test sets: for each language, 18,000 labelled training instances and 2,000 labelled development instances were provided; an unlabelled and previously unseen test set containing 1,000 instances per language was then used for evaluation by the organisers – see (Tan et al., 2014) for full details of the dataset, and (Zampieri et al., 2014) for the task and evaluation.
Group A Bosnian (bs), Croatian (hr), Serbian (sr) Group B Indonesian (id), Malaysian (my) Group C Czech (cz), Slovakian (sk)
Group D Brazilian Portuguese (pt-BR), European Portuguese (pt-PT) Group E Peninsular Spain (es-ES), Argentine Spanish (es-AR) Group F American English (en-US), British English (en-GB)
Table 1: Languages and groups in the DSL Shared Task.
However, problems were discovered in labelling the languages in Group F, and an evaluation for groups A-E was therefore performed separately; we discuss only this latter task and evaluation here.
Related Work Classification approaches based on character or byte sequences have shown success in providing general models of language identification; see e.g. (Lui et al., 2014). In more specific exper-iments into discriminating between pairs or triples of similar languages, many researchers have found that word-based features can aid accuracy; but classification method and feature choice vary widely.
When distinguishing Malay from Indonesian, Ranaivo-Malanc¸on (2006) combines character n-gram frequencies with heuristics based on number format and lists of words unique to each language. Ljubeˇsi´c et al. (2007) use a character trigram-based probabilistic language model, again in combination with a unique-word list, to distinguish between Croatian, Serbian and Slovenian, achieving high accuracies (over 99%); Tiedemann and Ljubeˇsi´c (2012) extend this task to include Bosnian and improve perfor-mance by using a Naive Bayes classifier with unigram word features to achieve accuracies over 95%.
Some research suggests that word-based features can even outperform character-based approaches. For Brazilian vs European Portuguese, Zampieri and Gebre (2012) found that word unigrams gave very similar performance to character n-gram features when used in a probabilistic language model; Zampieri et al. (2013) then showed that word 1- or 2-grams outperformed character ngrams of any length from 1 to 5 (and that both outperformed features based purely on syntactic part-of-speech), when distinguishing different varieties of Spanish. Lui and Cook (2013) likewise found that bag-of-words features generally outperformed features based on syntax or character sequences when distinguishing between Canadian, Australian and UK English. However, Zampieri (2013) found that in some cases (e.g French) character n-grams might give benefits above simple word unigram features.
In this work, then our interest was to investigate whether these simple, knowledge-poor approaches can generalise and apply across several language groups, using a single integrated approach to classification incorporating character- and word-based features within one model; and to compare the utility of word and character features.
3 Methods
Processing and training We tokenise the training texts from (Tan et al., 2014) based on transitions between alphanumeric and non-alphanumeric characters, and remove URLs, email addresses, Twitter usernames and emoticons. We then form feature vectors with entries for all observed word (token) uni-grams, and character ngrams of lengths 1-3; feature values are counts (raw term frequencies) normalised
by the text length in tokens or characters respectively. We then train a single multi-class linear-kernel sup-port vector machine using LIBLINEAR (Fan et al., 2008) with the language identifiers (en-US,en-UK, hr,bs, sretc.) as labels. SVMs are well-suited to high-dimensional feature spaces; and SVMs with ngrams of these lengths have shown good performance in other language identification work (Baldwin and Lui, 2010). Features were given numerical indices corresponding to the unique ngram type (i.e. we used a feature dictionary with no hashing). No feature selection or frequency cutoff was used. No part-of-speech tagging or grammatical analysis was attempted; no external language resources or tools were used other than described above.
Development and testing Development and test set texts were tokenised and featurised using the same process; feature indices were taken from the dictionary generated during training, with unseen ngram types ignored. LIBLINEAR was then used to predict the most likely language identifier label.
By re-using a standard set of in-house utilities for tokenisation and featurisation,3 the code for train-ing and parameter testtrain-ing (see below) was written and tested for functionality in around 30 minutes. Pre-processing, featurisation and vectorisation then took around 25 minutes over the training and devel-opment sets, and writing out LIBLINEAR format files around 15 minutes, running on a MacBook Air with 1.7GHz Intel Core i7 processor and 8Gb memory. Classifier training then takes around 1 minute, depending on exact parameter settings. Testing on the development set or test set takes around 1 second per language group.
4 Experiments and Results
Development We used 10-fold cross-validation on the training set, and testing on the development set, to choose a suitable SVM cost parameter (tradeoff between error and maximum margin criterion). We cross-validated over the training set to check overall multi-class accuracy while varying the cost over a range from 1 to 100 – see Table 2. We then trained on the full training set, and tested accuracy on the development across each language group – see Table 3. Given reported problems with the group F dataset (en-UK/en-US), we focussed on groups A-E.
Cost: 1.0 3.0 10.0 30.0 50.0 100.0 Overall A-E 91.36 93.24 94.44 94.83 94.86 94.85
Table 2: 10-fold cross-validation accuracy on training set with varying SVM cost.
Cost: 1.0 3.0 10.0 30.0 50.0 100.0 Group A bs/hr/sr 88.93 91.96 93.20 93.56 93.46 93.26 Group B id/my 97.11 97.72 98.14 98.28 98.31 98.42 Group C cz/sk 99.90 99.92 99.95 99.97 99.97 99.95 Group D pt-BR/pt-PT 89.83 91.99 93.52 94.12 94.00 94.05 Group E es-AR/es-ES 82.72 85.82 87.78 89.26 89.24 89.01 Overall A-E 91.34 93.28 94.34 94.86 94.81 94.73
Table 3: Accuracy on development set with varying SVM cost.
A cost parameter value of 30 to 50 appeared to perform best across all groups, so these two values were used for separate runs in the shared task test. Note though that performance appears relatively stable over a cost range of 10-100 (perhaps 30-100 for group E). The classifier performs worst for group E (es-AR/es-ES), with only this language group failing to reach 90% accuracy. Group C (cz/sk) performs best with almost perfect accuracy; this may be due to the existence of characters which are highly discriminative on their own (e.g. ˆo is used in Slovak, but not in Czech, ˚u in Czech but not in Slovak – although a few dozen examples appear labelled as Slovak in this dataset).
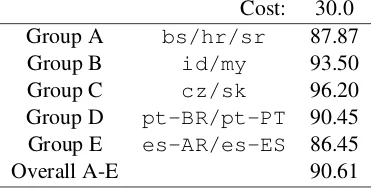
Test – Shared Task A blind run on the test set was then performed and submitted as part of the shared task. Overall accuracy was 90.61% (macro-averaged F-score 92.51%), placing us 5th amongst the task entrants; results per group are shown in Table 4.
Cost: 30.0 Group A bs/hr/sr 87.87 Group B id/my 93.50 Group C cz/sk 96.20 Group D pt-BR/pt-PT 90.45 Group E es-AR/es-ES 86.45
[image:4.595.206.392.117.212.2]Overall A-E 90.61
Table 4: Accuracy on test set as submitted for the shared task.
Corrected Test However, after submission of the test run, a bug was discovered in the code which paired test sentences with predictions; predictions had been omitted for about 500 of the 11,000 test texts (i.e. 4.5% of the data) due to an unfortunate combination of unpaired double-quote characters in the test data with the use of a standard CSV-file handling library. After release of the gold-standard test set labels, the classifier was therefore re-run, with resulting accuracies as shown in Table 5.
Cost: 1.0 3.0 10.0 30.0 50.0 100.0 Group A bs/hr/sr 87.97 90.70 92.40 92.90 93.00 93.17 Group B id/my 98.30 98.85 99.05 99.15 99.15 99.15 Group C cz/sk 99.90 99.95 99.95 99.95 99.95 99.95 Group D pt-BR/pt-PT 88.50 91.45 93.25 93.95 93.90 93.80 Group E es-AR/es-ES 83.65 86.70 88.45 89.35 89.45 89.45 Overall A-E 91.33 93.27 94.42 94.86 94.90 94.93
Table 5: True accuracy on test set after restoring omitted predictions.
Accuracies are very similar to those on the development set. Overall accuracy at the chosen cost parameter range of 30-50 is 94.9%, slightly worse than the 1st and slightly better than the 2nd-placed systems in the official test (95.71% and 94.68% respectively). Increasing the cost parameter setting could perhaps give a very slight boost to performance. Again, group E performs worst, and Group C best; per-group and overall accuracies are very similar to those achieved on the development set.
A second unintended feature of the feature generation code was subsequently discovered: character n-grams were being extracted spanning word boundaries (including the whitespace characters separating words). These were removed, leaving only the intended character n-grams within words, and accuracies are shown in Table 6. Again, overall performance increases slightly, now to over 95%, although Group A accuracy shows a slight decrease (0.1%). Group E accuracy improves by over 1% and is now over 90% at the chosen cost parameter.
Cost: 1.0 3.0 10.0 30.0 50.0 100.0 Group A bs/hr/sr 89.83 92.13 92.73 92.77 92.63 92.67 Group B id/my 98.55 99.15 99.25 99.35 99.35 99.35 Group C cz/sk 99.95 99.95 99.95 99.95 99.95 99.95 Group D pt-BR/pt-PT 91.00 93.25 94.80 95.15 95.10 95.15 Group E es-AR/es-ES 86.10 88.35 90.30 90.85 90.95 91.15 Overall A-E 92.79 94.35 95.16 95.35 95.33 95.37
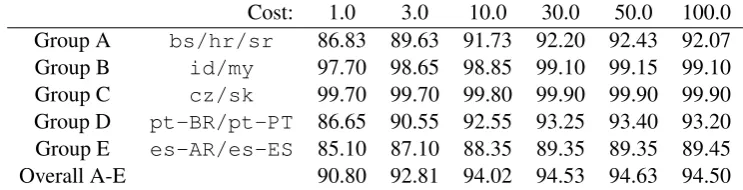
Effect of features To investigate the utility of our chosen feature sets and their insights into lexical and orthographic distinctions, we then compared the overall performance to that achieved when removing certain features. Table 7 shows the accuracies achieved without word unigram features (i.e. using only character ngrams of lengths 1-3); Table 8 shows accuracies without character ngram features (i.e. using only word unigrams).
[image:5.595.111.483.283.378.2]Cost: 1.0 3.0 10.0 30.0 50.0 100.0 Group A bs/hr/sr 81.43 85.40 88.03 89.77 90.10 90.70 Group B id/my 91.80 94.15 96.05 96.95 97.20 97.50 Group C cz/sk 99.90 99.95 99.95 99.95 99.95 99.95 Group D pt-BR/pt-PT 82.75 86.70 89.15 90.80 91.50 91.80 Group E es-AR/es-ES 77.80 80.95 83.50 85.20 85.10 85.65 Overall A-E 86.25 89.06 91.04 92.28 92.53 92.90
Table 7: Accuracy on test set without word unigrams.
Cost: 1.0 3.0 10.0 30.0 50.0 100.0 Group A bs/hr/sr 86.83 89.63 91.73 92.20 92.43 92.07 Group B id/my 97.70 98.65 98.85 99.10 99.15 99.10 Group C cz/sk 99.70 99.70 99.80 99.90 99.90 99.90 Group D pt-BR/pt-PT 86.65 90.55 92.55 93.25 93.40 93.20 Group E es-AR/es-ES 85.10 87.10 88.35 89.35 89.35 89.45 Overall A-E 90.80 92.81 94.02 94.53 94.63 94.50
Table 8: Accuracy on test set using only word unigrams.
Neither system performs as well as the classifier with the full, combined feature set (Table 6). How-ever, the system with only word unigrams does almost as well as the full system, losing a maximum of 2% performance at the extreme range of cost parameter values, and less than 1% at the chosen optimal values. The system with only character ngrams, however, loses noticably more performance, with around 3% lost even at optimal cost values.
5 Conclusions
A simple approach using ngram features and discriminative classification achieves competitive results on the task of discriminating similar languages, and the availability of existing language processing and machine learning tools makes setting up and training such a system easy and extremely quick. Simple word unigram features perform well on their own, although combination with character n-gram features improves performance; the choice of classifier parameters is important but seems to generalise well across different languages. Future extensions of this work could include features which take into account longer word or character sequences and/or more flexible characterisations and combinations of those features, for example via the convolutional neural network approach of (Kalchbrenner et al., 2014).
References
Timothy Baldwin and Marco Lui. 2010. Language identification: The long and the short of the matter. In
Human Language Technologies: The 2010 Annual Conference of the North American Chapter of the Association
for Computational Linguistics, pages 229–237, Los Angeles, California, June. Association for Computational
Linguistics.
William B. Cavnar and John M. Trenkle. 1994. N-gram-based text categorization. In Proceedings of the 3rd
Symposium on Document Analysis and Information Retrieval, pages 161–175, Las Vegas.
Gregory Grefenstette. 1995. Comparing two language identification schemes. InProceedings of Analisi Statistica dei Dati Testuali (JADT), pages 263–268, Rome.
Nal Kalchbrenner, Edward Grefenstette, and Phil Blunsom. 2014. A convolutional neural network for modelling sentences. InProceedings of the 52nd Annual Meeting of the Association for Computational Linguistics (Volume
1: Long Papers), pages 655–665, Baltimore, Maryland, June. Association for Computational Linguistics.
Rafael Dueire Lins and Paulo Gonc¸alves. 2004. Automatic language identification of written texts. InProceedings
of the 2004 ACM Symposium on Applied Computing, SAC ’04, pages 1128–1133, New York, NY, USA. ACM.
Nikola Ljubeˇsi´c, Nives Mikeli´c, and Damir Boras. 2007. Language identification: How to distinguish similar languages? InProceedings of the 29th International Conference on Information Technology Interfaces (ITI), pages 541–546.
Marco Lui and Paul Cook. 2013. Classifying english documents by national dialect. In Proceedings of the
Australasian Language Technology Association Workshop 2013 (ALTA 2013), pages 5–15, Brisbane, Australia.
Marco Lui, Jey Han Lau, and Timothy Baldwin. 2014. Automatic detection and language identification of multi-lingual documents.Transactions of the Association for Computational Linguistics, 2:27–40.
Bali Ranaivo-Malanc¸on. 2006. Automatic identification of close languages - case study: Malay and Indonesian.
ECTI Transactions on Computer and Information Technology, 2(2):126–134, November.
Liling Tan, Marcos Zampieri, Nikola Ljubeˇsi´c, and J¨org Tiedemann. 2014. Merging comparable data sources for the discrimination of similar languages: The DSL Corpus Collection. InProceedings of the 7th Workshop on
Building and Using Comparable Corpora (BUCC).
J¨org Tiedemann and Nikola Ljubeˇsi´c. 2012. Efficient discrimination between closely related languages. In
Proceedings of COLING 2012, pages 2619–2634, Mumbai, India, December.
Marcos Zampieri and Binyam Gebrekidan Gebre. 2012. Automatic identification of language varieties: The case of Portuguese. InProceedings of KONVENS2012, pages 233–237, Vienna, September.
Marcos Zampieri, Binyam Gebrekidan Gebre, and Sascha Diwersy. 2013. N-gram language models and POS distribution for the identification of Spanish varieties. InProceedings of TALN2013, pages 580–587, Sables d’Olonne, France.
Marcos Zampieri, Liling Tan, Nikola Ljubeˇsi´c, and J¨org Tiedemann. 2014. A report on the DSL Shared Task 2014. InProceedings of the 1st Workshop on Applying NLP Tools to Similar Languages, Varieties and Dialects (VarDial).
Marcos Zampieri. 2013. Using bag-of-words to distinguish similar languages: How efficient are they? In