A COMPARATIVE STUDY OF CLASSIFIERS FOR STUDENT MODULE IN TECHNICAL
1
Prof.Dr. P. K. Srimani and
1
Director, R&D
2
Departments of ISE, JSSATE, Bangalore, Karnataka, India
ARTICLE INFO ABSTRACT
In recent years, huge amount of data with regard to higher education system especially with regard to technical education system(TES) is available and queries related to Edu
interest as SQL appr
study aims at developing a technique called Edu
educational institutions using data mining techniques into useful information. The disco knowledge will have a great impact on the educational research and practices.
explores Edu quality of educat Edu
of the experimental analysis is presented and the results are found to be of immense practical interest. Finally, optimal classifiers
INTRODUCTION
Educational Mining (Edu-mining) is a method of exploring Educational data (Edu-data) which is a large data repository consisting of data related to educational systems. It has earned lot of scope in educational research. Edu
because of huge collection of data mainly from WWW, study material available in the internet, e-learning schemes, computerization of education system, online registration schemes for admission process in the universities, student information system, examination evaluatio
Recent development of such data repository not only belongs to higher education system but also to the secondary education system. Aim of this paper is to study the higher education system using data mining (DM) techniques [1] to provide a better approach to teaching, learning and management process of the education system. The paper focuses on the following important aspects: Education system: a bench mark system for edu-mining; Goal seeking analysis; Optimization analysis
Sensitivity analysis; Related work
Implementation; KDD process; Selection of classifiers Description of data set; Experiments and results; Conclusions
TECHNICAL EDUCATION SYSTEM: A B MARK SYSTEM FOR EDU-MINING
The present section mainly focuses on the typical Education system, which is considered as a ben
*Corresponding author: [email protected]; [email protected].
ISSN: 0975-833X
Article History:
Received 25th October, 2011
Received in revised form
27th November, 2011
Accepted 17th December, 2011
Published online 31st January, 2012
Key words:
Edu-DATA, Classifiers, data mining, Edu-MINING,
Knowledge, Information, Stake holders.
RESEARCH ARTICLE
A COMPARATIVE STUDY OF CLASSIFIERS FOR STUDENT MODULE IN TECHNICAL
EDUCATION SYSTEM (TES)
Prof.Dr. P. K. Srimani and
2Mrs. Malini M. Patil
Director, R&D Division, B.U., DSI, Bangalore, Karnataka, India
of ISE, JSSATE, Bangalore, Karnataka, India and Research Scholar, Bhartiyaar University,
Coimbatore, Tamilnadu, India
ABSTRACT
In recent years, huge amount of data with regard to higher education system especially with regard to technical education system(TES) is available and queries related to Edu
interest as SQL approach is insufficient and needs to be focused in a different way. The present study aims at developing a technique called Edu-MINING which converts raw data coming from educational institutions using data mining techniques into useful information. The disco knowledge will have a great impact on the educational research and practices.
explores Edu-DATA, discovers new knowledge and suggests useful methods to improve the quality of education with regard to teaching and learning process. The stud
Edu-student-data set comprising of 3500 instances and fourteen attributes. A comprehensive study of the experimental analysis is presented and the results are found to be of immense practical interest. Finally, optimal classifiers are identified and excellent accuracy is achieved.
Copy Right, IJCR, 2012, Academic Journals
mining) is a method of exploring data) which is a large data repository consisting of data related to educational systems. It has earned lot of scope in educational research. Edu-data is evolved collection of data mainly from WWW, study learning schemes, computerization of education system, online registration schemes for admission process in the universities, student information system, examination evaluation systems etc. Recent development of such data repository not only belongs to higher education system but also to the secondary education system. Aim of this paper is to study the higher education system using data mining (DM) techniques [1] to provide a etter approach to teaching, learning and management process focuses on the following ench mark system for ptimization analysis;
elated work; Edu-mining;
election of classifiers; ; Experiments and results; Conclusions
TECHNICAL EDUCATION SYSTEM: A BENCH
section mainly focuses on the typical Technical Education system, which is considered as a bench mark
;
system for the study of Edu-mining
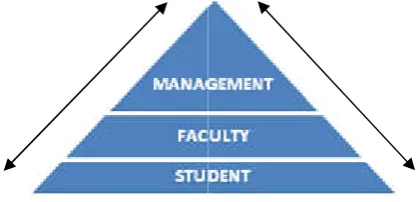
by three main components, which are called as st
shown in the Figure 1. The three important stakeholders of the system are discussed as follows: Stakeholder 1 is Management, which is the supreme authority to manage the system. Stakeholder 2 is Students who are
[image:1.595.326.536.597.698.2]main revenue generators in the system, who work on a give and take policy. They have to pay the necessary fees to get a degree of their choice and also join the institution to acquire a degree and expect a home away from home atmosphere system. Stakeholder 3 is Teachers who are instrumental in strengthening of the system and are in teaching and learning process.
Figure 1. A Typical Technical Education System
With this brief overview of the system, we will try to analyze the system under three different headings. viz., Goal seeking analysis, Optimization analysis, Sensitivity analysis. The detailed discussion on these different approaches of analysis is International Journal of Current Research
Vol. 4, Issue, 01, pp.249-254, January, 2012
INTERNATIONAL
A COMPARATIVE STUDY OF CLASSIFIERS FOR STUDENT MODULE IN TECHNICAL
, DSI, Bangalore, Karnataka, India
Research Scholar, Bhartiyaar University,
In recent years, huge amount of data with regard to higher education system especially with regard to technical education system(TES) is available and queries related to Edu-DATA are of practical oach is insufficient and needs to be focused in a different way. The present MINING which converts raw data coming from educational institutions using data mining techniques into useful information. The discovered knowledge will have a great impact on the educational research and practices. Edu-MINING DATA, discovers new knowledge and suggests useful methods to improve the learning process. The study is carried out for the data set comprising of 3500 instances and fourteen attributes. A comprehensive study of the experimental analysis is presented and the results are found to be of immense practical
are identified and excellent accuracy is achieved.
, Academic Journals. All rights reserved.
mining. The system is organized onents, which are called as stakeholders The three important stakeholders of the system are discussed as follows: Stakeholder 1 is Management, which is the supreme authority to manage the Stakeholder 2 is Students who are considered as the main revenue generators in the system, who work on a give and take policy. They have to pay the necessary fees to get a degree of their choice and also join the institution to acquire a degree and expect a home away from home atmosphere in the system. Stakeholder 3 is Teachers who are instrumental in strengthening of the system and are in teaching and learning
Figure 1. A Typical Technical Education System
With this brief overview of the system, we will try to analyze the system under three different headings. viz., Goal seeking analysis, Optimization analysis, Sensitivity analysis. The detailed discussion on these different approaches of analysis is
based on the typical education system that we have considered.
GOAL SEEKING ANALYSIS
This analysis mainly focuses on the aims and objectives of the institution set by the management or in other words, it can be stated as the goal of the management. They are summarized as follows: The mission and vision of the management must be very clear. Management aims at keeping the brand image of the system as the best institution providing highly sophisticated infrastructure. Maintaining and following the proper evaluation and grading policies set by the statutory bodies and providing facilities for the faculty and students in the teaching and learning process are the two main necessary activities of the management. Conducting regular induction programs for students, encouraging them by providing extra tutorials for below average students which naturally improves the results, arranging industry visits, promoting good hobby projects, arranging fests, sports, and other all extra co-curricular activities are essential. Selection procedure of students is based on proper aptitude tests for admissions by which input quality will increase. Revision of institutional policies for in-house activities of both faculty and students must be carried out. Maintenance of the transparent selection procedures for the students as well as the faculty and proper mentor system activities to make the student-teacher relationship stronger are necessary.
OPTIMIZATION ANALYSIS
This kind of analysis in the system is mainly concerned with the qualitative measures of the system. They include standardization of policies related to administrative procedures for the students, proper faculty recruitment procedures as per the norms, strengthening of training and placement activities by providing soft skills training program, training of technical staff with latest industry requirements, signing of MOUs with
industries, developing Industry-Institute-Interactions,
providing hostel, sports and transportation facilities, and constitution of anti-ragging committees. All these optimization issues are management dependent and the policy measures should be regularly improvised so that the institute can maintain a good ranking in the present educational scenario.
SENSITIVITY ANALYSIS
This kind of analysis deals with selection procedures for students in order to improve the quality of the intake and to maintain overall ranking of the institution. Perfect result analysis procedures are essential to find out short falls in teaching process, faculty feed back by students to improve the faculty responsibilities in teaching, and promotions to both teaching and non-teaching staff based on their attitude and aptitude. Motivational programs like arranging faculty development programs, encouraging the faculty to attend conferences and workshops, encouraging them to present papers, attending summer schools and winter schools , floating the idea of best teacher award etc. are the important sensitivity parameters. The presentation of a typical education system in this compact manner is to find the key areas where proper improvements could be implemented in the system. Currently the paper concentrates on only one stakeholder i.e., student. The analysis is carried out based on the data available in the
student database of an education system. Comparisons with respect to hypothetical data and real data are done and the results are presented and discussed.
RELATED WORK
Some amount of work in this regard has been done and is outlined briefly in this section. A thorough survey of the literature reveals that very sparse literature is available pertaining to the present work. Recently [2, 3] have studied machine learning approach for Edu-mining.
RECOMMENDATIONS FOR STUDENTS
The main objective of the present investigation is to provide recommendations directly to the students with respect to their personalized activities, links to visits, the next task or problem to be done, etc., and enable them to adapt learning contents, interfaces, and sequences. Several DM techniques have been used for this task, but the most common are association-rule
mining, clustering, and sequential pattern mining.
Sequence/sequential pattern mining aims to discover the relationships between occurrences of sequential events to find if there exists any specific order in the occurrences [4]. Clustering has been developed to establish a recommendation model for students in similar situations in the future [5]. Some other works include [6, 7, 8, 9, 10, 11].
PREDICTING STUDENT’S PERFORMANCE
The objective of prediction in this context is to estimate the unknown value of a variable that describes the student. In an education report, these values normally predicted are performance, knowledge, score, or mark. These values can be numerical/continuous (regression task) or categorical/discrete (classification task). Regression analysis finds the relationship between a dependent variable and one or more independent variables. Classification is a procedure in which individual items are placed into groups based on quantitative information regarding one or more characteristics inherent in the items, which are based on a training set of previously labeled items [7].
DETECTING UNDESIRABLE STUDENT BEHAVIORS
The objective of detecting undesirable student behavior is to discover/detect those students who have some type of problem or unusual behavior such as erroneous actions, low motivation, playing games, misuse, cheating, dropping out, academic failure, etc. Several DM techniques that have been used to reveal some types of students in order to provide them with appropriate help in plenty of time. Some of the classification algorithms that have been used to detect problematic student’s behavior are decision tree neural networks, naive Bayes, instance-based learning logistic
regression, and support vector machines for
predicting/preventing student drop out [5];
EDU-MINING
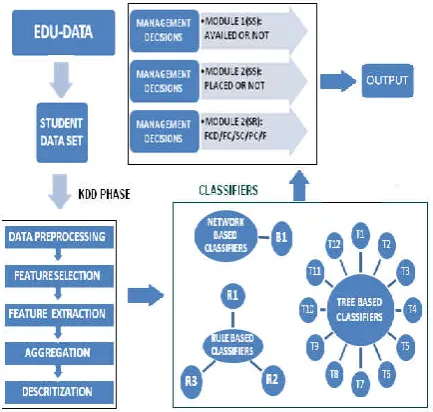
2. Proposed Edu-mining system consists of data preprocessing unit where the student data is preprocessed and inputted to KDD phase. This is the knowledge generation phase of data mining techniques. Different data mining techniques used in this phase are classification, clustering, association rule mining and visualization techniques. In this paper the three types of classification techniques used are viz., rule based, tree based and network based. The first technique comprises of 3 classifiers, the second 12 and the third only 1. A comparison of all these classifiers has been made and the results are discussed.
Figure 2. Architecture of Proposed Edu-mining system
IMPLEMENTATION
The Selection of proper data mining algorithm is a very important step. Since the paper aims at student analysis based on the data available in the student database of an education system. The steps of implementation phase are described below.
KDD PROCESS
Proper preprocessing methods such as discretization and aggregation and feature selection are used to prepare the data for KDD process. data is in the CSV format. Edu-data used in this system consists of 3500 instances. The KDD process constitutes five steps. Namely, Data preprocessing, Data Cleaning, Data Transformation, Data mining and Report Generation.
SELECTION OF CLASSIFIERS
Classification techniques were developed as machine learning algorithms in order to extract rules and patterns from data that are used for prediction. The objective of classification is to build a mapping function that assigns class labels to each new instance or to verify the appropriateness of class labels already assigned. For the present investigation, the classifiers[12] considered are: Network Based (B1) : Neive Bayes, Rule Based(R1, R2, R3): Jrip, OneR, ZeroR. Decision tree based (T1, T2.….T12) : BFtree, Decision stump, FT, LADtree, LMT, J48, J48graft, REPtree, Random Tree, Random forest,
ID3, NBTree. A brief description of the classifiers is discussed here is presented below.
Naïve Bayesian-classifier is a simple probability based
algorithm. It uses Bayes theorem, but assumes that instances are independent of each other which is a rather an unrealistic assumption when a practical situation is considered.
ZeroR-is the simplest classification method, which relies on the target and ignores all predictors. ZeroR classifier simply predicts the majority category (class). Although there is no predictability power in ZeroR, it is useful for determining a baseline performance as a benchmark for other classification methods.
OneR-OneR(One Rule), is a simple, yet accurate,
classification algorithm that generates one rule for each predictor in the data, then selects the rule with the smallest total error as its "one rule". To create a rule for a predictor, a frequency table is constructed for each predictor against the target.
JRIP-implements ripper including heuristic global
optimization of the rule set. This class implements a propositional rule learner, Repeated Incremental Pruning to Produce Error Reduction (RIPPER), which was proposed by William W. Cohen as an optimized version of IREP. It is based in association rules with reduced error pruning (REP), a very common and effective technique found in decision tree algorithms.
J48-In order to classify a new item, it first needs to create a
decision tree based on the attribute values of the available training data. Therefore, whenever it encounters a set of items (training set) it identifies the attribute that discriminates the various instances most clearly.
LMT-Logistic Model Trees A logistic model tree (LMT) is an
algorithm which creates a model tree with a standard decision tree structure with logistic regression functions at leaf nodes. In LMT, leaves have a associated logic regression functions instead of just class labels.
Random Forest-is an ensemble classifier that consists of many decision trees and outputs the class that is the mode of the class's output by individual trees. Random Forests grows many classification trees without pruning. Then a test sample is classified by each decision tree and random forest assigns a class which have maximum occurrence among these classifications.
J48graft-decision tree is a predictive machine-learning model
that decides the target value (dependent variable) of a new sample based on various attribute values of the available data.
Random trees-Random trees can deal with both classification
and regression problems. the random trees classifier takes the input feature vector, classifies it with every tree in the forest, and outputs the class label that receives the majority of “votes”.
REPtree-The REPTree(Reduced Error Pruning Tree)
Decisionstump-builds one-level binary decision tres for datasets with a categorical or numeric class, dealing with missing values by treating them as a separate value and extending a third branch from the stump.
NBtree-is a hybrid tree between decision trees and Naïve Bayes. It creates trees whose leaves are Naïve Bayes classifiers for the instances that reach the leaf. When constructing the tree, cross validation is used to decide whether the node should be split further or a naïve Bayes model should be used instead.
LMT-Logistic Model Tree (LMT) Uses regression methods.
When fitting the logistic regression functions at a node it uses cross validation to determine how many iterations to run just once and employs the same number throught the tree instead of cross validating at each node. This has a little effect on the accuracy.
LAD-Logical Analysis of Data (LAD) builds a classifier for
binary target variable based on learning a logical expression that can distinguish between positive and negative samples in a data set. The basic assumption of LAD model is that a binary point covered by some positive patterns, but not covered by any negative pattern is positive, and similarly, a binary point covered by some negative patterns, but not covered by positive pattern is negative.
FT-Functional trees(FT) which are classification trees that could have logistic regression functions at the inner nodes and/or leaves. The algorithm can deal with binary and multi-class target variables, numeric and nominal attributes and missing values.
DESCRIPTION OF DATA SET
[image:4.595.307.532.153.248.2]The data set used in EDU-MINER is EDU-DATA, which comprises of the attributes shown in table I. Edu-Data, which mainly comprises of student related data, which is either in the form of spreadsheets or in the form of text documents, paper documents, online data stored in the data base server. etc. The edu-student data consists of 14 attributes and 3500 instances.
Table 1: Data set description of EDUDATA
Attribute Description
Sl.NO. The sl.no. of the instance, no role in KDD USN NO Unique ID of student( numeric value)
Name Name of student
Gender M=male /F=female -Gender of the student Category BCM/SC/GM-caste of student
INCOME ICH/ICL, high or low income
SCH_AVAIL YES/NO
SSLC Marks Marks
mode of entry R/D, R= regular, D = Diploma seat_type CET/MGT/CMK, CET, Management
or COMED-K
PUC Pre University marks
aggregate Aggregate Percentage of all 8 semesters
Result Class availed by the students: FCD/FC/SC/PC/FL
Status C/DC, whether a student is continued or not
The methodology used for the implementation process is presented in table 2. The three different modules considered from Student stakeholder in TES are Student Results (SR), Student Scholarship(SS) and Student Placement(SP) respectively. The KDD process is applied on these three modules of edu-student –data.
Table 2: Data set description of Student Module
Module Description of Attributes
Student Result USN No, Gender, Category, Mode of
entry, Seat_ type, aggregate, result
Student Scholarship USN NO, Gender, Category, INCOME, SSLC marks , SCH-AVAIL
Student Placement USN NO, Gender, Category, mode of entry,
Seat_type, Aggrgate, Result, Character, Placement
EXPERIMENTS AND RESULTS
Tables 3, 4, 5 present the results pertaining to the three modules of edu-student data respectively, by considering the following 16 classifiers:
Network Based (B1) : Neive Bayes
Rule Based(R1, R2, R3): Jrip, OneR, ZeroR.
[image:4.595.306.554.414.642.2]Decision tree based (T1, T2.….T2) : BFtree, Decision stump, FT, LADtree, LMT, J48, J48graft, REPtree, Random Tree, Random forest, ID3, NBTree.
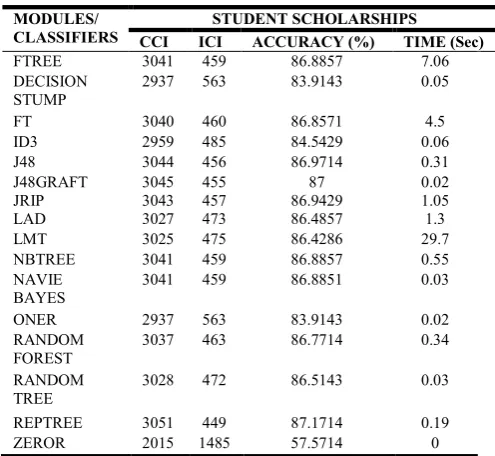
Table 3: Student as a Stake Holder in TES for SS module
MODULES/ CLASSIFIERS
STUDENT SCHOLARSHIPS
CCI ICI ACCURACY (%) TIME (Sec)
FTREE 3041 459 86.8857 7.06
DECISION STUMP
2937 563 83.9143 0.05
FT 3040 460 86.8571 4.5
ID3 2959 485 84.5429 0.06
J48 3044 456 86.9714 0.31
J48GRAFT 3045 455 87 0.02
JRIP 3043 457 86.9429 1.05
LAD 3027 473 86.4857 1.3
LMT 3025 475 86.4286 29.7
NBTREE 3041 459 86.8857 0.55
NAVIE BAYES
3041 459 86.8851 0.03
ONER 2937 563 83.9143 0.02
RANDOM FOREST
3037 463 86.7714 0.34
RANDOM TREE
3028 472 86.5143 0.03
REPTREE 3051 449 87.1714 0.19
ZEROR 2015 1485 57.5714 0
A glance at the table 3 reveals the following results:
For SS module REPtree(87.1714%) performs best
while zeroR(57.1714%) worst.
A glance at the table 4 reveals the following results:
For SR module BFTREE, FT, J48, J48GRAFT,
LMT, NEIVEBAYES, NBTREE, ONER perform perform(96.0286%) extremely well while
[image:4.595.36.264.561.768.2]Table 4: Student as a Stake Holder in TES for SR module
MODULES/ CLASSIFIERS
STUDENT RESULTS
CCI ICI ACCURACY (%) TIME (Sec)
BFTREE 3361 139 96.0286 5.86
DECISION STUMP
2238 1262 63.9429 0.03
FT 3361 139 96.0286 8.89
ID3 3271 213 93.4571 0.05
J48 3361 139 96.0286 0.03
J48GRAFT 3361 139 96.0286 0.31
JRIP 3359 141 95.9714 0.25
LAD 3271 213 93.4571 2.74
LMT 3361 139 96.0286 39.72
NBTREE 3361 139 96.0286 0.66
NAVIE BAYES
3361 139 96.0286 0.03
ONER 3361 139 96.0286 0.02
RANDOM FOREST
3302 198 94.3429 0.16
RANDOM TREE
3235 265 92.4286 0.02
REPTREE 3359 141 95.9714 0.13
[image:5.595.321.543.87.241.2]ZEROR 1825 1675 52.1429 0.0
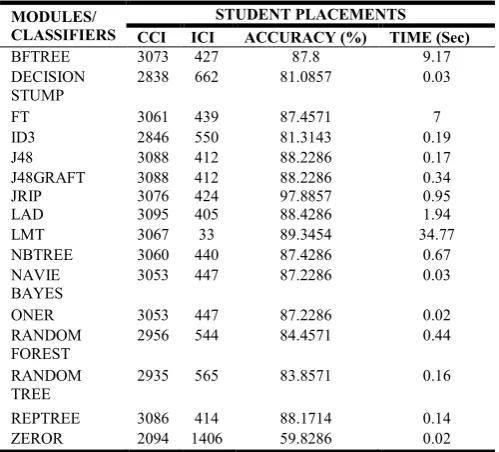
Table 5: Student as a Stake Holder in TES for SP module
MODULES/ CLASSIFIERS
STUDENT PLACEMENTS
CCI ICI ACCURACY (%) TIME (Sec)
BFTREE 3073 427 87.8 9.17
DECISION STUMP
2838 662 81.0857 0.03
FT 3061 439 87.4571 7
ID3 2846 550 81.3143 0.19
J48 3088 412 88.2286 0.17
J48GRAFT 3088 412 88.2286 0.34
JRIP 3076 424 97.8857 0.95
LAD 3095 405 88.4286 1.94
LMT 3067 33 89.3454 34.77
NBTREE 3060 440 87.4286 0.67
NAVIE BAYES
3053 447 87.2286 0.03
ONER 3053 447 87.2286 0.02
RANDOM FOREST
2956 544 84.4571 0.44
RANDOM TREE
2935 565 83.8571 0.16
REPTREE 3086 414 88.1714 0.14
ZEROR 2094 1406 59.8286 0.02
A glance at the table 5 reveals the following results:
For SP module JRIP(97.8897%) performs best while
zeroR (59.8286%)worst.
In figure 3 the graph of accuracy vs different classifiers is presented for the three edu-student modules. The figure clearly shows the performance of different classifiers and at the same time the optimum classifier for a specific module also. Figure 4 illustrates the time complexity involved in each classification process. It is observed that the time complexities of the classifiers are: J48GRAFT (0.02 sec) and OneR (0.02 sec) for the case of SS module. In the case of SR module the time complexities of the classifiers are: oneR(0.02sec) and Random tree(0.02sec). In the case of SP module the time complexity of the classifier is :OneR (0.02sec). Therefore it can be concluded that ONER is the best classifier with regards to Edu-student module. The accuracy achieved in this case is
[image:5.595.323.541.278.433.2]96.0286% for SP and SR modules while REPTREE can be considered as the best performing classifier for SS module.
Figure 3. Graph of Accuracy vs Classifiers
Figure 4. Graph of Time vs Classifiers
CONCLUSIONS
The present investigation on Edu-student data consisting of 3500 instances with 14 attributes was carried out with an objective to provide effective managerial decisions in a technical institutions. The experiments on the Edu-student data set were performed for three different types of modules namely: placement, results, scholarship by applying 16 different classifiers from the three classification techniques namely: rule based, tree based and network based. The results are found to be quite interesting and of practical importance. The structural aspects of the results provide a better platform for taking right decisions at right time from the management perspective. Therefore it can be concluded that ONER is the best classifier with regards to SP and SR modules. The accuracy achieved in this case is 96.0286% while REPTREE can be considered as the best performing classifier for SS module. The analysis is found to be first of its kind and has lot of scope for future research.
ACKNOWLEDGEMENTS
[image:5.595.38.288.350.576.2]REFERENCES
[1] Cristobal Romero, Sebastian Ventura,” Education Data mining A
Review of the state of Art”, IEEE Transactions on Systems, Man and Cybernetics 2006, Vol 0, No. 6
[2] Srimani P.K, Malini M Patil, “ Eduming:A Machine
learning approach”, ICM2ST, AIP, 2011
[3] Srimani P.K, Malini M Patil, “ A classification Model for Eduming PSRC, ICICs-2012, in the press.
[4] Knauf, R. Boeck, Y. Sakurai, S. Dohi, and S. Tsuruta, “Knowledge mining for supporting learning processes”, Proc. Of the 2008 IEEE International Conference on Systems, Man, and Cybernetics (SMC 2008)}, Singapore, IEEE Catalog Number CFP08SMC-USB, ISBN 978-1-4244-2384-2, Library Of Congress: 2008903109.
[5] Y. Sakurai, S. Dohi, S. Tsuruta, and R. Knauf, R., “Modeling Academic Education Processes by Dynamic Storyboarding”, Journal of Educational Technology & Society”, vol. 12, ISSN 1436-4522 (online) and 1176-3647 (print), International Forum of Educational Technology & Society (IFETS), 2009, pp. 307-333.
[6] H. Gardner, Frames of Mind: The Theory of Multiple Intelligences. 1993, Basic Books.
[7] R.M. Felder and L.K. Silverman, “Learning and Teaching Styles in Engineering Education”, 78(7), 1988, pp. 674-681.
[8] Senol Zafer ERDOGAN, Mehpare TIMOR, ”A Data
Mining Application in a Student Database”. Journal of Aeronautics and Space Technologies. Vol 2, No 2, pp, 53-57.
[9] Cesar Vialardi, Javier Bravo, Leila Shafti, Avlao
Ortigosa, “ Recommendation in Higher Education using Data Mining Techniques” . Journal of Education Data mining, 2009, pp 192-199.
[10] Shaeela Ayesha, Tasleem Mustafa, Ansar Raza Satter, M Inayat Khan, “ Data Mining Model for Higher Education “ European journal of scientific research. Vol 43, No(1) 2010, pp 24-29.
[11] Ryan J.D. Baker and Kalina Yacef, “The State of Education Data mining : A Review and Future Visions “. Journal of Education Data mining. 2009, Vol ,1 Issue 1, pp 3-17.
[12] Ian H. Witten and Eibe Frank “Data Mining :Practical Machine Learning Tools and Techniques , Second Edition,2008, Morgon kaufman Publishers.