OPTIMIZATION OF PROCESSED AMARANTH GRAIN FLOUR CHAPATTI USING RESPONSE
1
Department of Food Science, Periyar
ARTICLE INFO ABSTRACT
In the present investigation attempts have been made to process boiled amaranth grain (
cruentus
and to develop fiber rich chapatti by the addition of optimized proportions of Wheat flour (WF), Boiled Amaranth Grain Flour (BAGF) and Water(W) with other ingredients using Response Surface Methodology (RSM) for acceptable Chapatti considering Carbohydrate, Protein, Fat, Fiber, Diameter, Product weight and overall acceptability as a response variables. Combinations of wheat flour, Boiled amaranth grain flour and Water with their lower and upp
respectively were optimized by varying proportions to result a better quality chapatti. Whereas iodized salt and vegetable oil were kept constant for all formulations. Results revealed that, Response Surface Methodol
optimum levels and it was found that desirable values of Carbohydrate (75.83g), Protein (13.16), Fat (3.45), Fiber (2.80 g), Diameter (
was obtained for the corresponding optimum condition of wheat flour (80gm), boiled amaranth grain flour (20gm) and Water (70ml). Hence it is concluded that RSM was used successfully to optimize the level of wheat flour and boile
INTRODUCTION
Wheat (Triticum aestivum) is the major food produce among all the cereal crops. It is a staple food of large segment of world population. Wheat is extensively used for production of flat breads (Shewry, 1994) such as the
steam-a msteam-ajor source of nutrients (Dhingrsteam-a, 2001
common to Pakistan, India, and some parts of Africa ( Islam, 1987). About 85% of wheat consumption in India is in the form of chapattis. Amaranth grains are lentil
small (approximately 1 mm diameter) and light (Belton & Taylor, 2002). These grains have high nutritional and functional values which are associated with the quality and quantity of their proteins, fats and antioxidant potential (Gorinstein et al., 2007). Amaranth grains have been identified as low glycaemic index food.
A low glycaemic index food are very important in the dietary treatment of diabetes mellitus, increases satiety, facilitate the control of food intake and has other health benefits for healthy subject in terms of post-prandial glucose and lipid metabolism (Rizkalla, 2002). Regular consumption of
may have important protective effects on risk for cardiovascular disease. Unleavened bread (chapatti and roti) is the staple diet of people in the India, utilizing almost 90 percent of the wheat produced in the region. The objective of this study is to investigate the effect of bo
Physiochemical and microstructure of the amaranth grain and
*Corresponding author: [email protected]
ISSN: 0975-833X
Article History: Received 04th August, 2012 Received in revised form 03thSeptember, 2012 Accepted 26th October, 2012 Published online 23th November, 2012
Key words: Chapatti,
Boiled amaranth grain flour, Water,
Response Surface Methodology.
RESEARCH ARTICLE
OPTIMIZATION OF PROCESSED AMARANTH GRAIN FLOUR CHAPATTI USING RESPONSE
SURFACE METHODOLOGY
1
Durgadevi R. and
1Nazni .P
Department of Food Science, Periyar University, Salem-636 011, TamilNadu, India
ABSTRACT
In the present investigation attempts have been made to process boiled amaranth grain (
cruentus) into flour and analyzing the physiochemical properties and proximate composition of flour and to develop fiber rich chapatti by the addition of optimized proportions of Wheat flour (WF), Boiled Amaranth Grain Flour (BAGF) and Water(W) with other ingredients using Response Surface Methodology (RSM) for acceptable Chapatti considering Carbohydrate, Protein, Fat, Fiber, Diameter, Product weight and overall acceptability as a response variables. Combinations of wheat flour, Boiled amaranth grain flour and Water with their lower and upper limits are 80
respectively were optimized by varying proportions to result a better quality chapatti. Whereas iodized salt and vegetable oil were kept constant for all formulations. Results revealed that, Response Surface Methodology (RSM) was applied for optimization, the multiple regressions was used to get optimum levels and it was found that desirable values of Carbohydrate (75.83g), Protein (13.16), Fat (3.45), Fiber (2.80 g), Diameter (6.19cm), Product weight (162.99g
was obtained for the corresponding optimum condition of wheat flour (80gm), boiled amaranth grain flour (20gm) and Water (70ml). Hence it is concluded that RSM was used successfully to optimize the level of wheat flour and boiled amaranth grain flour for the development of value added Chapatti.
Copy Right, IJCR, 2012, Academic Journals
Wheat (Triticum aestivum) is the major food produce among all the cereal crops. It is a staple food of large segment of population. Wheat is extensively used for production of -leavened chapatti, Dhingra, 2001) and staple diet common to Pakistan, India, and some parts of Africa
(Nurul-out 85% of wheat consumption in India is in Amaranth grains are lentil-shaped, very small (approximately 1 mm diameter) and light (Belton & These grains have high nutritional and with the quality and quantity of their proteins, fats and antioxidant potential have been identified
A low glycaemic index food are very important in the dietary s mellitus, increases satiety, facilitate the control of food intake and has other health benefits for healthy prandial glucose and lipid metabolism ). Regular consumption of Amaranth grains tive effects on risk for Unleavened bread (chapatti and roti) is the staple diet of people in the India, utilizing almost 90 percent of the wheat produced in the region. The objective of this study is to investigate the effect of boiling on
of the amaranth grain and
to assess the nutritional characteristics and sensory quality of chapattis supplemented with boiled amaranth grain flour.
MATERIALS AND METHODS
Boiling of Amaranth grain
Amaranth grain (Amaranthus Cruentus
salt used for this investigation were procured from the Local market. All the ingredients procured from the market were checked for its purity.The boiling proc
was carried out with the standard procedure suggested by Sidhu and Scribel (1998).The boiled grains were dried and made into flour and paced in a air tight container for further analysis.
Physiochemical properties and microstructure amaranth grain and flour
Physical properties such as thousand grain weight and volume, hydration ratio and swelling capacity of the grain, rehydration ratio of grain flour was calculated by the method of Ranganna, (1986). Amylose and amylopecti
spectrophotometer. The water absorption capacity and oil absorption capacity was determined by the method of Sathe et al, (1982) and the bulk density of the boiled amaranth grain flour was determined using Ige, (1984).
properties such as moisture, total ash, crude fibre, protein and fat were determined using AOAC method. The carbohydrate was assessed using Anthrone method. Morphology of the grain was assessed by Scanning Electron Microscopy (SEM).
Available online at http://www.journalcra.com
International Journal of Current Research Vol. 4, Issue, 11, pp.231-239, November, 2012
INTERNATIONAL
OPTIMIZATION OF PROCESSED AMARANTH GRAIN FLOUR CHAPATTI USING RESPONSE
636 011, TamilNadu, India
In the present investigation attempts have been made to process boiled amaranth grain (amaranthus
the physiochemical properties and proximate composition of flour and to develop fiber rich chapatti by the addition of optimized proportions of Wheat flour (WF), Boiled Amaranth Grain Flour (BAGF) and Water(W) with other ingredients using Response Surface Methodology (RSM) for acceptable Chapatti considering Carbohydrate, Protein, Fat, Fiber, Diameter, Product weight and overall acceptability as a response variables. Combinations of wheat flour, Boiled er limits are 80-90g, 10-20g and 60-70g respectively were optimized by varying proportions to result a better quality chapatti. Whereas iodized salt and vegetable oil were kept constant for all formulations. Results revealed that, Response ogy (RSM) was applied for optimization, the multiple regressions was used to get optimum levels and it was found that desirable values of Carbohydrate (75.83g), Protein (13.16), Fat 162.99g) and Overall Acceptability (7.30) was obtained for the corresponding optimum condition of wheat flour (80gm), boiled amaranth grain flour (20gm) and Water (70ml). Hence it is concluded that RSM was used successfully to optimize d amaranth grain flour for the development of value added Chapatti.
, Academic Journals. All rights reserved.
to assess the nutritional characteristics and sensory quality of chapattis supplemented with boiled amaranth grain flour.
METHODS
Amaranthus Cruentus), wheat flour and table salt used for this investigation were procured from the Local All the ingredients procured from the market were The boiling process of Amaranth grain was carried out with the standard procedure suggested by .The boiled grains were dried and made into flour and paced in a air tight container for further
Physiochemical properties and microstructure of boiled
Physical properties such as thousand grain weight and volume, hydration ratio and swelling capacity of the grain, rehydration ratio of grain flour was calculated by the method of Ranganna, (1986). Amylose and amylopectin content determined using spectrophotometer. The water absorption capacity and oil absorption capacity was determined by the method of
, (1982) and the bulk density of the boiled amaranth grain flour was determined using Ige, (1984). The chemical properties such as moisture, total ash, crude fibre, protein and fat were determined using AOAC method. The carbohydrate was assessed using Anthrone method. Morphology of the grain was assessed by Scanning Electron Microscopy (SEM).
Preparation of chapatti
Whole wheat flour
Boiled amaranth grains flour
Add water and salt
Made into dough
Divided into balls
Thin it in roll board and pin
Heat the tawa and cook till it was done
Experimental design (central composite rotatable designs)
The Response Surface Methodology (RSM) is a widely adopted tool for the quality of optimizations processes (P.Nazni et al., 2011). The RSM, originally described by Box and Wilson (1951) is effective for responses that affect many factors and their interactions. The central composite rotatable composite design (CCRD), (Box and Hunter, 1957) was adopted to predict responses based on few sets of experimental data in which all factors were varied within a chosen range. The experiment consisted of 8 factorial runs, 6 axial runs and 6 center runs. The 3 independent variables were Wheat flour (g) (X1), Boiled amaranth grain flour (g) (X2) and Water (ml) (X3).
Each variable was set at 5 levels and a total of 20 experiments were designed whereby formulation 15, namely the centre-point formulation, was repeated 6 times. The independent variables and their variation levels are shown in Table 1. The levels of each variable were established according to literature information and preliminary trials. The outline of the experimental layout with the coded and natural values is presented in Table 2.
Homogeneous variance is a necessary pre- requisite for (linear) regression models. Therefore, a reduction in variability within the objective response (dependent variables) was by transforming the data to standardized scores Z= X-X / S where X = dependent variable of interest; X = mean of dependent variable of interest and S = standard deviation). For each standardized scores, Analysis of Variance (ANOVA) was conducted to determine significant differences among the treatment combinations. Also, data were analyzed using multiple regression procedures (Design Expert Version 8.0). To estimate Wheat flour, Boiled amaranth grain flour and Water effect on each objective response such as Carbohydrate (Y1), Protein (Y2), Fat (Y3), Fiber (Y4), Diameter (Y5), Cooked
weight (Y6) and Overall acceptability(Y7) , the standardized
scores were fitted to a quadratic polynomial regression model by employing a least square technique (Gacula and Singh, 1984; Wanasundara and Shahidi, 1996). The model proposed for each response of Y was:
Y= β 0+ β 1X1+ β 2 X2+ β 3X3+ β 11X12+ β 22X22+ β 33X32 + β 12
X1X2+ β 13X1X3+ β 23X2X3
Where Y = the response, X1= Wheat flour, X2 = Boiled
amaranth grain flour, X3 = Water. β0= intercepts, β1, β2, β3 are
linear, β11, β22, β33, = are quadratic and β12, β13 and β23 are
interaction regression coefficient terms, respectively. Coefficients of determination (R2) were computed. The adequacy of the model was examined based on three criterion, F value, Lack of Fit (LoF) and adequate precision value. The optimization was done by numerical optimization. Constraints were set to get the optimized coded value of the variable between the upper and lower limits of the variable. For each response, response surface plots were produced from the equations, by holding the variable with the least effect on the response equal to a constant value, and changing the other two variables.
Sensory evaluation of developed chapattis
The sensory evaluation was carried out in order to get consumer response for overall acceptability of the boiled amaranth grain flour supplemented chapatti compared to the control chapatti (Wheat). The developed chapattis were served hot for the sensory evaluation. Products were evaluated by a panel of 10 semi-trained judges for different sensory attributes like appearance, flavour, taste, texture and overall acceptability. A 9-point hedonic scale ranging from 1 to 9, where 1=extremely dislike and 9 =like was used to evaluate acceptability of sample. Data were subjected to analysis of variance (ANOVA) using the SPSS software and differences among means were compared using Duncan’s Multiple Range test. A significance level of 0.05 was chosen.
Statistical analysis
The analytical data obtained for BAGF chapattis were subjected to analysis of variance (ANOVA) (one way anova) using complete randomized design .The critical difference at p<0.05 was estimated and used to find significant difference if any.
FINDINGS
Microstructure and Physiochemical proprieties of Raw and Boiled amaranth grain and its flour
Microstructure of Boiled amaranth grain by SEM
Table 1. Independent Variables and Levels used for central composite rotatable design
Variable Symbols Coded variable level
-1.68(µ) -1 0 1 1.68(µ)
Wheat flour (g) X1 76.59 80 85 90 93.40
Boiled amaranth grain flour (g) X2 5.47 10 15 20 26.47
[image:3.595.98.489.417.542.2]Water (ml) X3 56.59 60 65 70 73.40
Table 2. Experimental design in their natural units and coded form
Design points Independent variables in Uncoded form
Independent variables in coded form
X1 X2 X3 x1 x2 x3
1 80 10 60 -1 -1 -1
2 90 10 60 1 -1 -1
3 80 20 60 -1 1 -1
4 90 20 60 1 1 -1
5 80 10 70 -1 -1 1
6 90 10 70 1 -1 1
7 80 20 70 -1 1 1
8 90 20 70 1 1 1
9 76.59 15 65 -1.682 0 0
10 93.41 15 65 1.682 0 0
11 85 6.59 65 0 -1.682 0
12 85 23.41 65 0 1.682 0
13 85 15 56.59 0 0 -1.682
14 85 15 73.41 0 0 1.682
15 85 15 65 0 0 0
16 85 15 65 0 0 0
17 85 15 65 0 0 0
18 85 15 65 0 0 0
19 85 15 65 0 0 0
20 85 15 65 0 0 0
X1= Wheat flour, X2 = Boiled amaranth grain flour, X3 = Water
Tablen 3. Physiochemical proprieties of both Raw and Boiled amaranth grain and its flour
S.No Physiochemical proprieties Raw Amaranth Grain (g/100g) Boiled Amaranth Grain (g/100g)
1 Thousand Amaranth Grain weight 1.04 g 1.5g
2 Thousand Amaranth Grain volume 0.65ml 1ml
3 Amylose content 8.50 % 10.80%
4 Amylopectin content 38.50 % 48.20%
5 Water absorption of flour 2.13ml 3.84ml
6 Bulk density of flour 5.6g/ml 6.7g/ml
7 Moisture flour 7.4% 5.1 (%)
8 Total ash of flour 4.6% 4.2 (%)
9 Crude protein of flour 14.1% 13.3 (%)
10 Crude fibre of flour 7.2% 9.0 (%)
11 crude fat of flour 6.4% 6.6 (%)
12 Carbohydrate of flour 74.9 75(%)
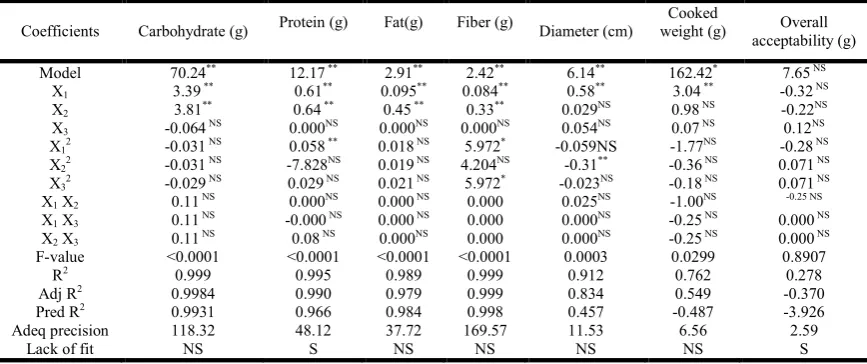
Table 4. Regression coefficient (coded variables) from quadratic model and their significance
Coefficients Carbohydrate (g) Protein (g) Fat(g) Fiber (g) Diameter (cm)
Cooked
weight (g) Overall acceptability (g)
Model 70.24** 12.17 ** 2.91** 2.42** 6.14** 162.42* 7.65 NS X1 3.39 ** 0.61** 0.095** 0.084** 0.58** 3.04 ** -0.32 NS X2 3.81** 0.64 ** 0.45 ** 0.33** 0.029NS 0.98 NS -0.22NS X3 -0.064 NS 0.000NS 0.000NS 0.000NS 0.054NS 0.07 NS 0.12NS X12 -0.031 NS 0.058 ** 0.018 NS 5.972* -0.059NS -1.77NS -0.28 NS X22 -0.031 NS -7.828NS 0.019 NS 4.204NS -0.31** -0.36 NS 0.071 NS X32 -0.029 NS 0.029 NS 0.021 NS 5.972* -0.023NS -0.18 NS 0.071 NS X1 X2 0.11 NS 0.000NS 0.000 NS 0.000 0.025NS -1.00NS -0.25 NS X1 X3 0.11 NS -0.000 NS 0.000 NS 0.000 0.000NS -0.25 NS 0.000 NS X2 X3 0.11 NS 0.08 NS 0.000NS 0.000 0.000NS -0.25 NS 0.000 NS F-value <0.0001 <0.0001 <0.0001 <0.0001 0.0003 0.0299 0.8907
R2 0.999 0.995 0.989 0.999 0.912 0.762 0.278
Adj R2 0.9984 0.990 0.979 0.999 0.834 0.549 -0.370
Pred R2 0.9931 0.966 0.984 0.998 0.457 -0.487 -3.926
Adeq precision 118.32 48.12 37.72 169.57 11.53 6.56 2.59
Lack of fit NS S NS NS NS NS S
[image:3.595.76.510.573.755.2]boiled grain has more (1ml) value than raw grain (0.65ml), because boiling will explode the grain when subjected to high temperature. Amylose essentially consists of linear chains, with a small amount of branching. Approximately 25% of starch in the main cereal crops is amylose. Amylopectin, making up around 75% of the starch, consists of linear chains of glucose residues linked to other ramifications through alfa-1, 6 bonding. A high percentage of amylose in food leads to the formation of "resistant starch", stimulating the activity of the intestinal flora and inducing the production of protective substances against colon cancer. Besides, foods with "high amylose" have a low glycemic index, which is beneficial to 25% of the insulin-resistant population and, by stimulating the formation of HDL cholesterol, prevents cardiovascular disease (Kuswanto, et al.,
Fig. 1. Cross-Sectional morphologies of the boiled amaranth grain flour
[image:4.595.53.274.529.694.2]2011). The amylose and amylopectin content of boiled amaranth grain was 10.08 and 48.20% respectively compared to raw grain which was only 8.5% and 38.5% respectively which showed that it has got high therapeutic value for the subjects with non-communicable diseases. The study results reports that, the water absorption capacity of the raw grain was less (2.13ml) compared to boiled grain (3.84ml), because higher the temperature, the greater the water absorption due to increased water diffusion rate (Sopade et al., 1992).
Fig. 2. Cross-Sectional morphologies of the raw amaranth grain flour
Bulk density is a measure of heaviness of a flour sample. The bulk density was affected by the processing method and dropped with moisture reduction. The high bulk density (6.7g/ml) compared to raw amaranth grain(5.6g/ml) may be due to the large particle size due to boiling as compared to the raw grain flour which had course particles. Grains are the
storehouses of many chemical components including nutrients, phytochemicals, and non-nutritive plant protective functional constituents. The nutritive value of millets is comparable to other cereals with slightly higher contents of protein and minerals (Gopalan et al., 2002). Except moisture, all the other nutrients value such as ash, protein, fiber and fat has been increased during processing compared to the raw amaranth grain.
Optimization of Boiled amaranth grain Flour Chapatti
The Chapatti prepared with the help of wheat flour, BAGF, water and Salt was characterized for its physiochemical and organoleptic characteristics. Carbohydrate (Y1), Protein (Y2),
Fat (Y3), Fiber (Y4), Diameter (Y5), Cooked weight (Y6) and
Overall acceptability (Y7) was measured as response variables.
Diagnostic checking of fitted model and surface plot for various responses
Regression analysis indicated that the fitted quadratic model accounted that above 99% for carbohydrate, protein and fiber, 98% for fat, 91% for diameter, 76% for cooked weight and 27% for over all acceptability of the developed boiled amaranth grains flour incorporated chapatti. The values of regression coefficients, sum of squares, F values and P values for coded form of process variables are presented in Table 4.
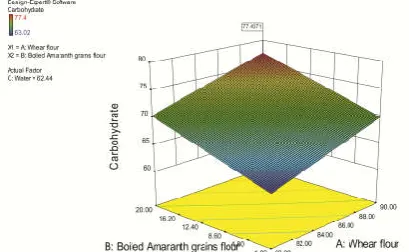
Carbohydrate
The carbohydrate of the developed chapatti was ranged from 63.02 to 77.4g. The coefficient of determination R2 was 99% of the regression model. The F value of the model is <0.0001 and lack of fit is not significant. The developed model for noodle in the form of uncoded (actual) process variables is as follows: Y1(Carbohydrate)=+70.24+3.39X1+3.81X2-0.064X3-0.031X1
2
-0.031X22-0.029X23+0.11X1X2-0.11X1 X3+0.11X2X3
In coded form of process variables, the model equation is as follows:
Y1(Carbohydrate)=-25.1258+1.1470x1+0.061x2+04865x3
-1.222x12-3.3867x221.1518x23+2.3157x1x2-4.4000x1
x3+2.3157x2x3
The magnitude of P and F value in Table 4 indicates that the linear variables such as X1, X2 and interaction variables X1X2,
X1X3, X2X3 had the positive contribution, the interaction
variables such as X12, X22, X32 and linear variable X3 had
negative contribution on Carbohydrate. The effect of Wheat flour, Boiled amaranth grains flour and Water on the carbohydrate level has been shown in Figs 3 to 5.
Diagnostic checking of fitted model and surface plot for various responses
[image:4.595.331.536.635.761.2]Fig. 4. Effect of Water and WF on Carbohydrate of chapatti
Fig. 5. Effect of Water and BAGF on Carbohydrate of chapatti
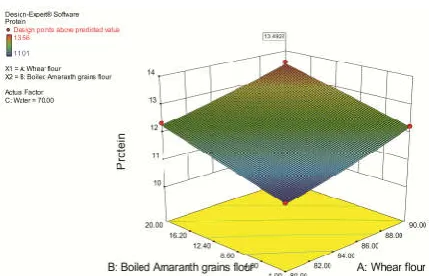
Protein
The Protein content of the developed noodles was ranged from 11.01 to 13.56g. The coefficient of determination R2 was 99% of the regression model. The F value of the model is <0.0001 and lack of fit is significant. The developed model for chapatti in the form of uncoded (actual) process variables is as follows: Y2(Protein)=+12.17+0.61X1+0.64X2+0.000X3+0.058X127.828
X22+0.029X23+0.000X1X2+0.000X1 X3+0.000X2X3
In coded form of process variables, the model equation is as follows:
Y2(Protein)=+22.6947-0.2698x1+0.0691x2-.1523x3+2.3031x1 2
-8.6732x22+1.1718x23-1.6217x1x2+4.1607x1 x3-1.4461x2x3
Diagnostic checking of fitted model and surface plot for various responses:
[image:5.595.47.281.220.374.2]Fig. 6. Effect of BAGF and WF on Protein of chapatti
Fig. 7. Effect of Water and WF on protein of chapatti
Fig. 8. Effect of Water and BAGF on protein of chapatti
The magnitude of P and F value of indicates the maximum positive contribution by the linear, quadratic and interaction variables. But X22 and X1X3 of quadratic and interaction variables had negative contribution for the fiber content. The effect of Wheat flour, BAGF and Water on the protein content has been shown in Figs 6 to 8.
Fat
The Fat content of the developed chapatti was ranged from 847.84±74.27 to 2.42to 3.51 g. The coefficient of determination R2 was 98% of the regression model. The F value of the model is <0.0001 and lack of fit is not significant.
The developed model for noodle in the form of uncoded (actual) process variables is as follows:
Y3(Fat)=+2.91+0.095X1+0.45X2+0.000X3+0.018X1 2
+0.019X2 2
+0.021X23+0.000X1X2+0.000X1X3+0.000X2X3
In coded form of process variables, the model equation is as follows:
Y3(Fat)=+9.45073-0.10027x1+0.042829x2-0.10960x3+
7.01662x12+2.13954x22+8.43083x23-6.71421x1x2+1.15304x1
x3-8.00541x2x3
The magnitude of P and F value indicates the maximum positive contribution on the fat content. The linear terms of X1, X2, X3 quadratic terms of X1
2
, X2 2
and X3 2
and interaction terms of X1X2, X1X3, X2X3 has the only positive effect on fat
[image:5.595.317.551.234.382.2] [image:5.595.58.273.609.747.2]Fig. 9. Effect of BAGF and WF on Fat of chapatti
Fig. 10. Effect of Water and WF on Fat of chapatti
Fig. 11. Effect of water and BAGF on Fat of chapatti
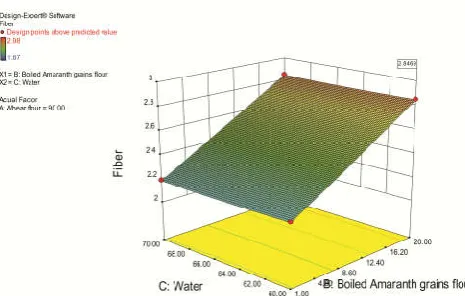
Fiber
The Fiber content of the developed chapatti was ranged from 2.02 to 2.85 g. The coefficient of determination R2 was 99% of the regression model. The F value of the model is <0.0001 and lack of fit is not significant.
The developed model for chapatti in the form of uncoded (actual) process variables is as follows
Y4(Fiber)=+2.42+0.084X1+0.33X2+0.000X3+5.972X1 2
+4.204 X22+5.972X23+0.000X1X2+0.000X1 X3+0.000X2X3
In coded form of process variables, the model equation is as follows:
Y4(Fiber)=+3.35919-0.02375x1+0.033759x2
-0.031052x3+2.38861x12+4.65791x22
+2.38861x23+0.0000x1x2+7.3598x1 x3-1.23886x2x3
The magnitude of P and F value indicates the maximum positive contribution on the fiber content. All the terms such as linear terms of X1, X2, X3 quadratic terms of X12, X22 and X32
and interaction terms of X1X2, X1X3, X2X3 has only the
[image:6.595.46.280.232.379.2]positive effect on fiber input. The effect of Wheat flour, BAGF and Water on the fiber content has been shown in Figs 12 to 14.
Fig. 12. Effect of BAGF and WF on Fiber of chapatti
Fig. 13. Effect of Water and WF on Fiber of chapatti
Fig.14: Effect of Water and BAGF on Fiber of chapatti Diameter
The Diameter acceptability of the developed chapatti was ranged from 5 to 6.5. The coefficient of determination R2 was 91% of the regression model. The F value of the model is 0.0003 and lack of fit is not significant.
The developed model for chapatti in the form of uncoded (actual) process variables is as follows
Y5 (Diameter) =+6.14+0.58X1+0.029X2+0.054X3-0.059X1 2
[image:6.595.316.549.324.468.2] [image:6.595.42.284.411.552.2] [image:6.595.316.549.501.649.2]In coded form of process variables, the model equation is as follows:
Y5 (Diameter=-5.32453+0.51026x1+0.029522x2+0.1321852x3
-2.34801x12-3.39266x22-9.33800x23+5.26316x1x2-2.61028x1 x3
-4.13699x2x3
The magnitude of P and F value indicates the maximum positive contribution and minimum negative contribution on the diameter of the product. All the terms such as linear terms of X1, X2, X3 quadratic terms of X12, X22 and X32 and
interaction terms of X1X2, X1X3, X2X3 has the positive effect
on diameter. But X12, X22 and X32.The effect of Wheat flour,
[image:7.595.54.271.242.377.2]BAGF and Water on the fiber content has been shown in Figs 15 to 17.
[image:7.595.326.536.273.403.2]Fig. 15. Effect of BAGF and WF on Diameter of chapatti
Fig. 16. Effect of Water and WF on Diameter of chapatti
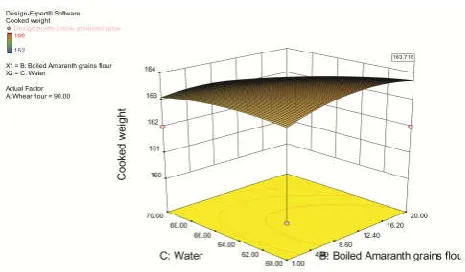
Cooked chapatti weight (CCW)
[image:7.595.57.271.379.530.2]The Cooked chapatti weight acceptability of the developed chapatti was ranged from 154 to 165. The coefficient of determination R2 was 76% of the regression model. The F value of the model is 0.0299 and lack of fit is not significant.
Fig. 17. Effect of Water and WF on Diameter of chapatti
The developed model for chapatti in the form of uncoded (actual) process variables is as follows
Y6(CCW)=+162.42+3.04X1+0.98X2-0.077X3-1.77X1 2
-0.36X22-0.18X23-1.00X1X2-0.25X1 X3-0.25X2X3
In coded form of process variables, the model equation is as follows:
Y6 (CCW) = -509.2323+13.51555x1+2.31737x2+1.82087x3
-0.070800x12-3.94237x22-7.16089x23-0.021053x1x2-0.010000x1
x3-5.26316x2x3
The magnitude of P and F value indicates the positive contribution and negative contribution on the cooked weight of the product. Expect the linear terms X1, X2, X3, quadratic terms
of X12, X22 and X32 and interaction terms of X1X2, X1X3, X2X3
has the negative effect on product weight. The effect of Wheat flour, BAGF and Water on the weight of the product has been shown in Figs 18 to 20.
Fig. 18. Effect of BAGF and WF on Weight of chapatti
Fig. 19. Effect of Water and WF on weight of chapatti Overall Acceptability
[image:7.595.323.544.426.567.2]The overall acceptability of the developed chapatti was ranged from 7 to 9. The coefficient of determination R2 was 27% of
[image:7.595.307.540.630.766.2] [image:7.595.48.274.638.767.2]the regression model. The F value of the model is 0.8907 and lack of fit is significant.
The developed model for noodle in the form of uncoded (actual) process variables is as follows:
Y7(Overallacceptability)=+7.65-0.32X1-0.22X2+0.12X3
-0.28X1X2+0.071X1X3+0.071X2X3-
0.25X12+0.000X22+0.000X32
[image:8.595.76.252.154.261.2]Fig. 21. Effect of BAGF and WF on Overall acceptability of chapatti
Fig. 22. Effect of Water and WF on Overall acceptability of chapatti
Fig. 23. Effect of Water and BAGF on Overall acceptability of chapatti
In coded form of process variables, the model equation is as follows:
Y7 (Overall acceptability) =-62.79833+1.91630x1+0.40747x2
-0.34235X3- 0.011319x2
+7.81963x1x3+2.82289x2x3-5.26316x12
-9.73457x22+4.13182x32
The magnitude of P and F value in Table 4 indicates the linear terms of X1 and X2, quadratic terms of X12, interaction terms of
X1X2 had the negative effects. The effect of Wheat flour,
Boiled amaranth grains flour and Water on the overall acceptability has been shown in Figs 21 to 23.
[image:8.595.310.555.238.336.2]Criteria of optimum value for the responses
Table 5. Criteria of optimum value for the responses
Process variable Optimum value Response Optimum value Wheat flour (g) 80.00 Carbohydrate
Protein Fat Fiber Diameter Cooked weight Overall acceptability
75.83 13.16 3.45 2.80 6.19 162.99 7.30 Boiled amaranth
grain flour (g)
20.00
Water(g) 70.00
For the optimization variables, the responses, that is carbohydrate, protein, Fat, Fiber, Diameter, Cooked weight and overall acceptability were selected on the basis that these responses had direct effect on the acceptability and quality of chapattis. To consider all the responses simultaneously for optimization, the multiple regression was used to get compromise optimum conditions and it has found that the values were 75.83, 13.16, 3.45, 2.80, 6.19, 162.99 and 7.30 for carbohydrate (g), protein (g), Fat (g), Fiber (g), Diameter (cm), Cooked weight (g) and Overall acceptability respectively, corresponding to the optimum condition of Wheat flour 80g as X1, Boiled amaranth grain flour 20g as X2 and water 70ml as
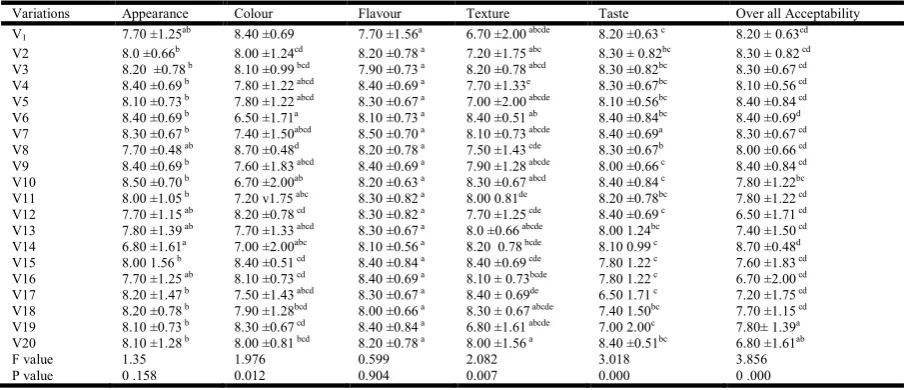
X3. Among the 20 variations of chapattis, V10 have scored
[image:8.595.63.264.413.526.2]highest mean value (8.50) the other variations in appearance. In colour attributes, V8 obtained 8.70 of highest score than V6 (6.50). Regarding flavour attributes, the highest score 8.70 is obtained by the variation V7 which is followed by the variation V18 with least score of 8.00 is obtained.
Table 6. Organoleptic evaluation of the developed chapatti
Variations Appearance Colour Flavour Texture Taste Over all Acceptability
V1 7.70 ±1.25ab 8.40 ±0.69 7.70 ±1.56a 6.70 ±2.00 abcde 8.20 ±0.63 c 8.20 ± 0.63cd
V2 8.0 ±0.66b 8.00 ±1.24cd 8.20 ±0.78 a 7.20 ±1.75 abc 8.30 ± 0.82bc 8.30 ± 0.82 cd
V3 8.20 ±0.78 b 8.10 ±0.99 bcd 7.90 ±0.73 a 8.20 ±0.78 abcd 8.30 ±0.82bc 8.30 ±0.67 cd
V4 8.40 ±0.69 b 7.80 ±1.22 abcd 8.40 ±0.69 a 7.70 ±1.33e 8.30 ±0.67bc 8.10 ±0.56 cd
V5 8.10 ±0.73 b 7.80 ±1.22 abcd 8.30 ±0.67 a 7.00 ±2.00 abcde 8.10 ±0.56bc 8.40 ±0.84 cd
V6 8.40 ±0.69 b 6.50 ±1.71a 8.10 ±0.73 a 8.40 ±0.51 ab 8.40 ±0.84bc 8.40 ±0.69d
V7 8.30 ±0.67 b 7.40 ±1.50abcd 8.50 ±0.70 a 8.10 ±0.73 abcde 8.40 ±0.69a 8.30 ±0.67 cd
V8 7.70 ±0.48 ab 8.70 ±0.48d 8.20 ±0.78 a 7.50 ±1.43 cde 8.30 ±0.67b 8.00 ±0.66 cd
V9 8.40 ±0.69 b 7.60 ±1.83 abcd 8.40 ±0.69 a 7.90 ±1.28 abcde 8.00 ±0.66 c 8.40 ±0.84 cd
V10 8.50 ±0.70 b 6.70 ±2.00ab 8.20 ±0.63 a 8.30 ±0.67 abcd 8.40 ±0.84 c 7.80 ±1.22bc
V11 8.00 ±1.05 b 7.20 v1.75 abc 8.30 ±0.82 a 8.00 0.81de 8.20 ±0.78bc 7.80 ±1.22 cd
V12 7.70 ±1.15 ab 8.20 ±0.78 cd 8.30 ±0.82 a 7.70 ±1.25 cde 8.40 ±0.69 c 6.50 ±1.71 cd
V13 7.80 ±1.39 ab 7.70 ±1.33 abcd 8.30 ±0.67 a 8.0 ±0.66 abcde 8.00 1.24bc 7.40 ±1.50 cd
V14 6.80 ±1.61a 7.00 ±2.00abc 8.10 ±0.56 a 8.20 0.78 bcde 8.10 0.99 c 8.70 ±0.48d
V15 8.00 1.56 b 8.40 ±0.51 cd 8.40 ±0.84 a 8.40 ±0.69 cde 7.80 1.22 c 7.60 ±1.83 cd
V16 7.70 ±1.25 ab 8.10 ±0.73 cd 8.40 ±0.69 a 8.10 ± 0.73bcde 7.80 1.22 c 6.70 ±2.00 cd
V17 8.20 ±1.47 b 7.50 ±1.43 abcd 8.30 ±0.67 a 8.40 ± 0.69de 6.50 1.71 c 7.20 ±1.75 cd
V18 8.20 ±0.78 b 7.90 ±1.28bcd 8.00 ±0.66 a 8.30 ± 0.67 abcde 7.40 1.50bc 7.70 ±1.15 cd
V19 8.10 ±0.73 b 8.30 ±0.67 cd 8.40 ±0.84 a 6.80 ±1.61 abcde 7.00 2.00c 7.80± 1.39a
V20 8.10 ±1.28 b 8.00 ±0.81 bcd 8.20 ±0.78 a 8.00 ±1.56 a 8.40 ±0.51bc 6.80 ±1.61ab
F value 1.35 1.976 0.599 2.082 3.018 3.856
P value 0 .158 0.012 0.904 0.007 0.000 0 .000
**-Significant at 0.01% level; *-Significant at 0.05% level; NS-No significant
[image:8.595.76.529.572.767.2]In texture attributes, V6 scored highest of 8.40 than V1 which scored the least sore of 6.70. Regarding taste, the highest score of 8.40 is scored by the variations of V6, V7, V10, V12 and V20 and is followed by the least score by V18 and V19 with score of 7.40 and 7.00. Regarding over all acceptability attributes, the highest score 8.40 is scored by V5, V6 and V9 followed by the least score 6.50 is obtained by V12.Results of the Duncan’s test revealed that there was significant difference for all the variations.
Conclusion
Response Surface Methodology (RSM) was used successfully to optimize the level of wheat flour, BASF and Water for the development of Chapatti. The incorporation of Boiled Amaranth Grain Flour (BASF) had an impact on the physicochemical and sensory properties of chapattis. The incorporation of BASF significantly increased in the nutrients. However, they had significantly decreased (P<0.05) acceptability of product when the flour increased. The sensory evaluation result showed there were only slight differences between the values of sensory attributes with the increasing incorporation of BASF. The overall acceptability of chapatti with high proximate composition (high fiber and normal carbohydrate) of the chapatti can be prepared using the combination of 80g of wheat flour, 20 g of boiled amaranth grain flour and 70ml of water. In conclusion, this study provides useful functional information for the future development of Amaranth Grain Flour-based food products.
REFERENCES
Atwell, W. 2001. Wheat Flour: practical guides for the food industry. USA: Eagan Press.
Belton, P. and Taylor, J. 2002. Pseudocereals and less common cereals: Grain properties and utilization potential, Springer, New York.
Billaud, C. Brun-Mérimée, S. Louarme, L. and Nicolas, J. 2004. Effect of glutathione and Maillard reaction products prepared from glucose or fructose with glutathione on polyphenoloxidase from apple—I: Enzymatic browning and enzyme activity inhibition. Food Chemistry, Vol. 84, pp. 223-233.
Box G.E.P. and Hunter J.S. 1957. Multifactor experimental design for exploring response surfaces. Annals Math. Stat, Vol. 28, pp.195-242.
Box G. E. P. and Wilson, K. B. 1951. On the Experimental Attainment of Optimum Condition”. Journal of the Royal Statistical Society, Vol. 13, pp.1-45.
Dhingra S, Jood S. 2001. Organoleptic and nutritional evaluation of wheat breads supplemented with soybean and barley flour. Journal ofFood Chem, Vol. 77, pp.479-488. Fu B. X. 2008. Asian noodles: History, classification, raw
materials, and processing Food Research International, Vol. 41, pp. 888-902.
Gacula Jr MC and Singh J. 1984. Statistical methods in food consumer research, New York; Academic Press, Inc, pp.214- 272.
Gorinstein, S. Vargas, O. J. M. Jaramillo, N. O., Salas, I. A. Ayala, A. L. M. Arancibia- Avila, P. Toledo, F. Katrich, E. & Trakhtenberg, S. 2007. The total polyphenols and the antioxidant potentials of some selected cereals and pseudocereals. European Food Research and Technology, Vol.225, pp.321–328.
Hou, G. and Kruk, M. 1998. Asian noodle technology. Technical Bulletin 20:10.
Hossein Afshari. Mostafa Eftekhari. Miad Faraji. Abdol Ghaffar Ebadi and Abbas Ghanbarimalidareh. 2011. Studying the effect of 1000 grain weight on the sprouting of different species of Salvia L. grown in Iran. Journal of Medicinal Plants Research, Vol. 5, pp. 3991-3993,
Khor. H and Chieng, D. 1997.Journal of Nutr. Res, vol. 17,pp. 475
Kaur, L. Singh, J. and Singh, N. 2005. Effect of glycerol monostearate on the physic-chemical, thermal, rheological and noodle making properties of corn and potato starches.
Food Hydrocolloids, Vol.19, pp. 839-849.
Kuswanto K and Rahayu. 2004. Industrialization of tempe fermentation. In: Steinkraus KH. Industrialization of Indigenous Fermented Foods, 2nd ed, pp 587-635.
Lara N. & Rualse J. 2002. J.Sci. Food Agric, Vol. 82, pp.797-805.
Lim, H. X. 2006. Effects of konjac glucomnnan (KGM) and kansui addition of the physiochemical properties of wheat flour and yellow alkaline noodles. Universiti Sains Malaysia, Penang, Malaysia
Nazni.P. and Karuna thara, D. 2011. optimization of beetroot peel osmotic dehydration process using responseSurface methodology, International journal of current research, Vol. 3, issue, 8, pp.027-032.
Nurul-Islam MD, Johansen HB.1987. Physical chemical tests-A basis for selecting the size of wheat flour. J Food Sci Technol, Vol. 24, pp.136-138.
Owen,G. 2001. Cereal processing technology. Cambridge woodhead publishing.
Ranganna, S. 1986. “Handbook of analysis and quality control for fruit and vegetable products”. Tata McGraw Hill Pub. Co. Ltd., New Delhi.
Rizkalla SW, Bellisle F, Slama G. 2002 Health benefits of low glycaemic index foods, such as pulses, in diabetic patients and healthy individuals. Br. J. of Nutr, Vol. 88, pp. 255-262.
Sopade, P.A., E.S. Ajisegiri and M.H. Badau. 1992. The use of Peleg’s equation to model water absorption in some cereal grains during soaking. Journal of Food Engineering, Vol 15, pp. 269-283.
Shiau, S.Y. and Yeh, A.I. 2001. Effects of alkali and acid on dough rheological properties and characteristics of extruded noodles, Journal of Cereal Science, Vol.33, pp. 27-37. Shewry PR, Tatham AS 1994 Wheat endosperm proteins and
their impact on the human mankind. In Martino al Cimino S (Ed.), Wheat kernel proteins: molecular and functional aspects .Italy, University of Tuscia, Viterbo. pp. 19-26. Sidhu and Scribel, 1998. Effect of flour milling conditions on
the quality of Indian unleavened flat bread(chappathi) J.Fd.Sci.1998, 53;1563-1565.
Yalchin, S. and Basmani, A. 2008. Quality characteristics of corn noodles containing gelatinized starch, transglutaminase and gum. Journal of Food Quality, vol. 31, pp. 465-479.
Wanasaundara and Shahidi. 1996. Optimization of hexametaphosphate assisted extraction of flaxgrain proteins using response surface methodology. J. Food Sci, Vol.61, pp. 604-607.